Copyright
©The Author(s) 2024.
World J Clin Cases. Aug 6, 2024; 12(22): 4956-4964
Published online Aug 6, 2024. doi: 10.12998/wjcc.v12.i22.4956
Published online Aug 6, 2024. doi: 10.12998/wjcc.v12.i22.4956
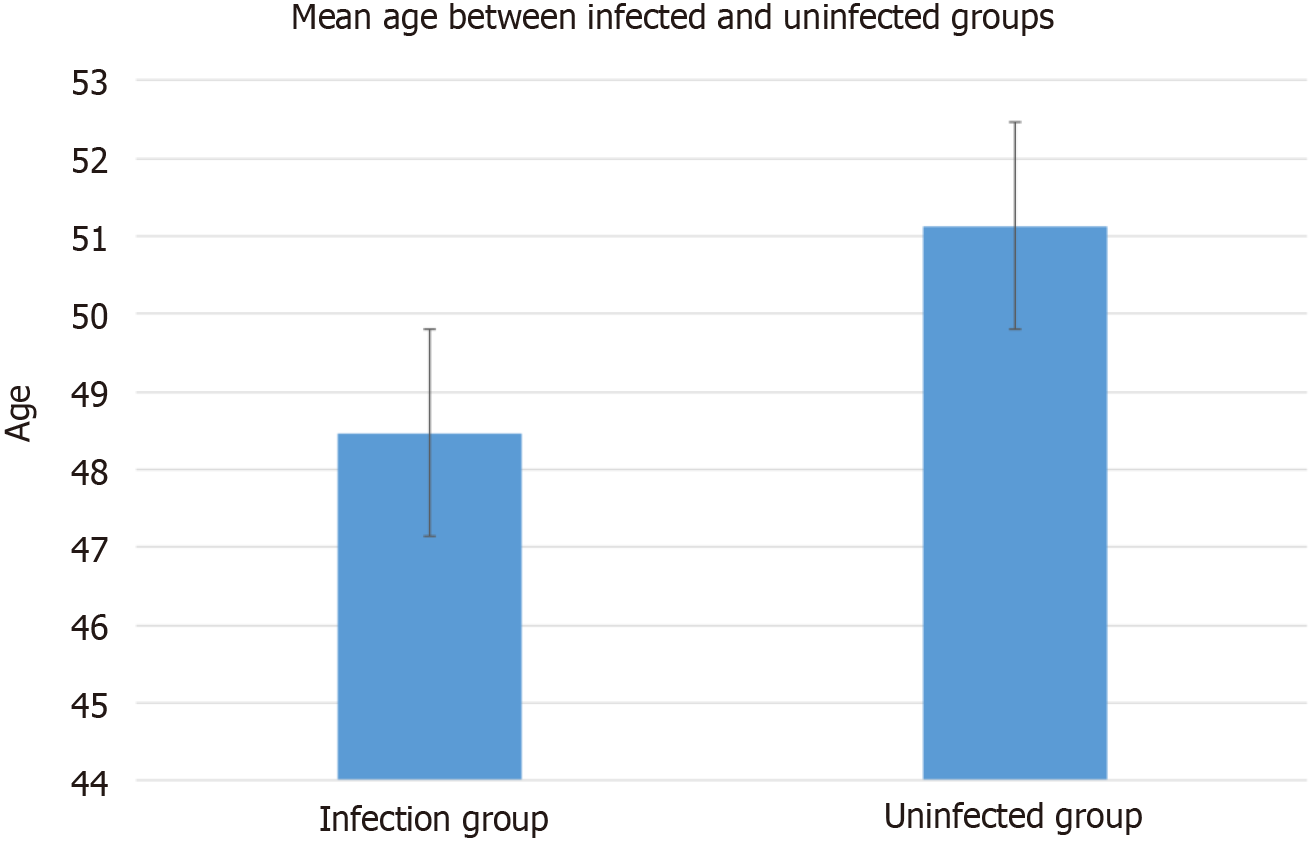
Figure 1 Comparison of mean age between patients in the infected and uninfected groups.
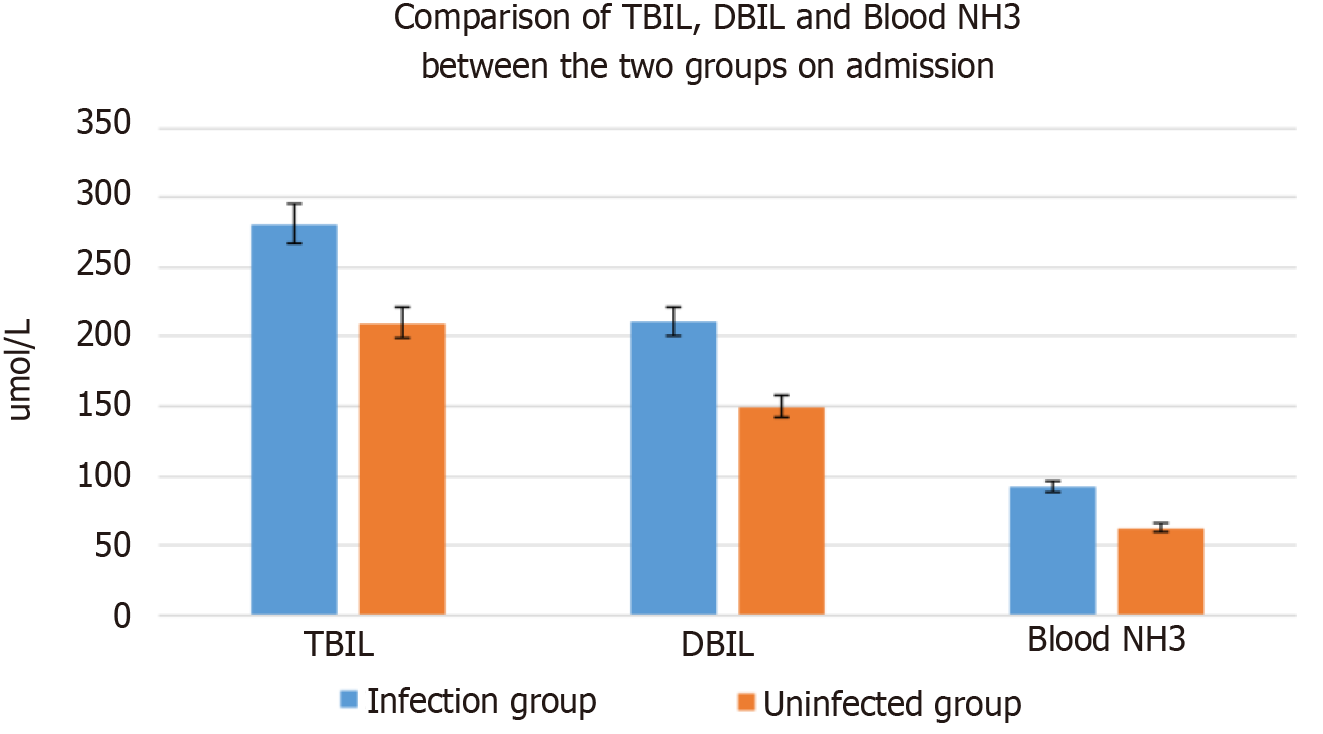
Figure 2 Comparison of total bilirubin, direct bilirubin, and blood ammonia levels at admission between the patients in the infected and uninfected groups.
TBIL: Total bilirubin; DBIL: Direct bilirubin; NH3: Ammonia
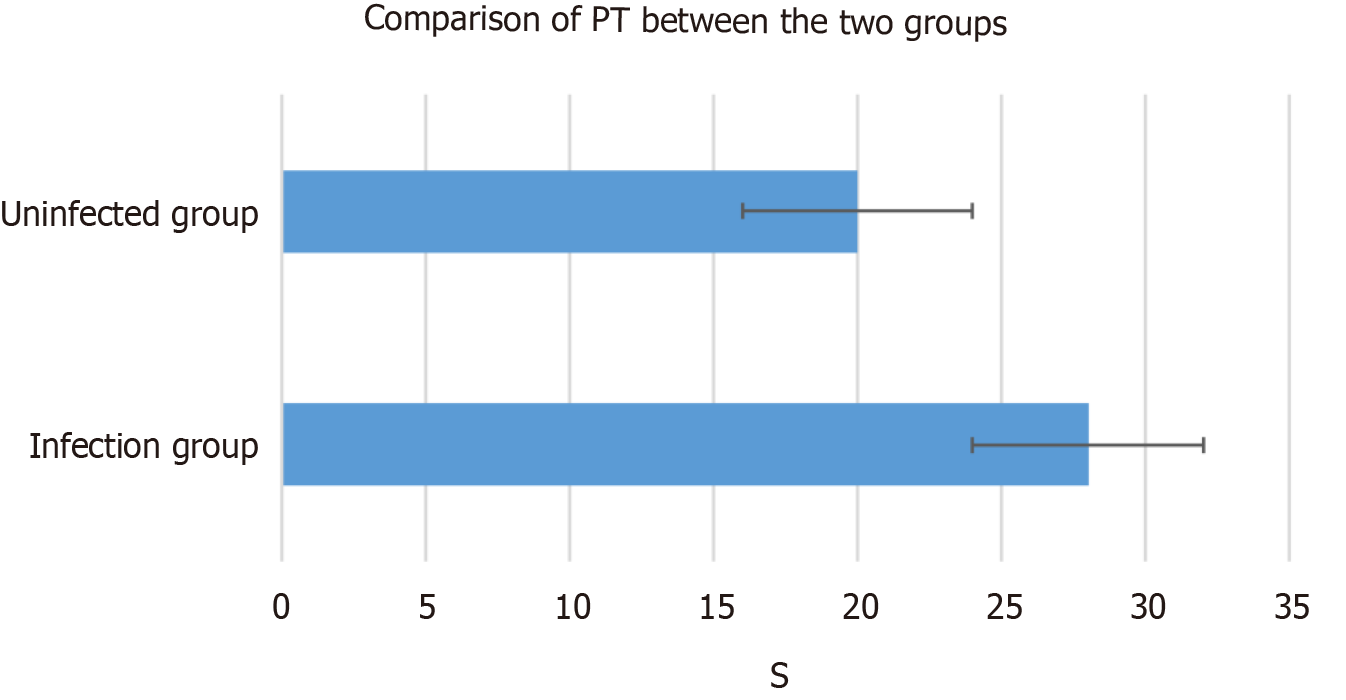
Figure 3 Comparison of prothrombin time at admission between the patients in the infected and uninfected groups.
PT: Prothrombin time.
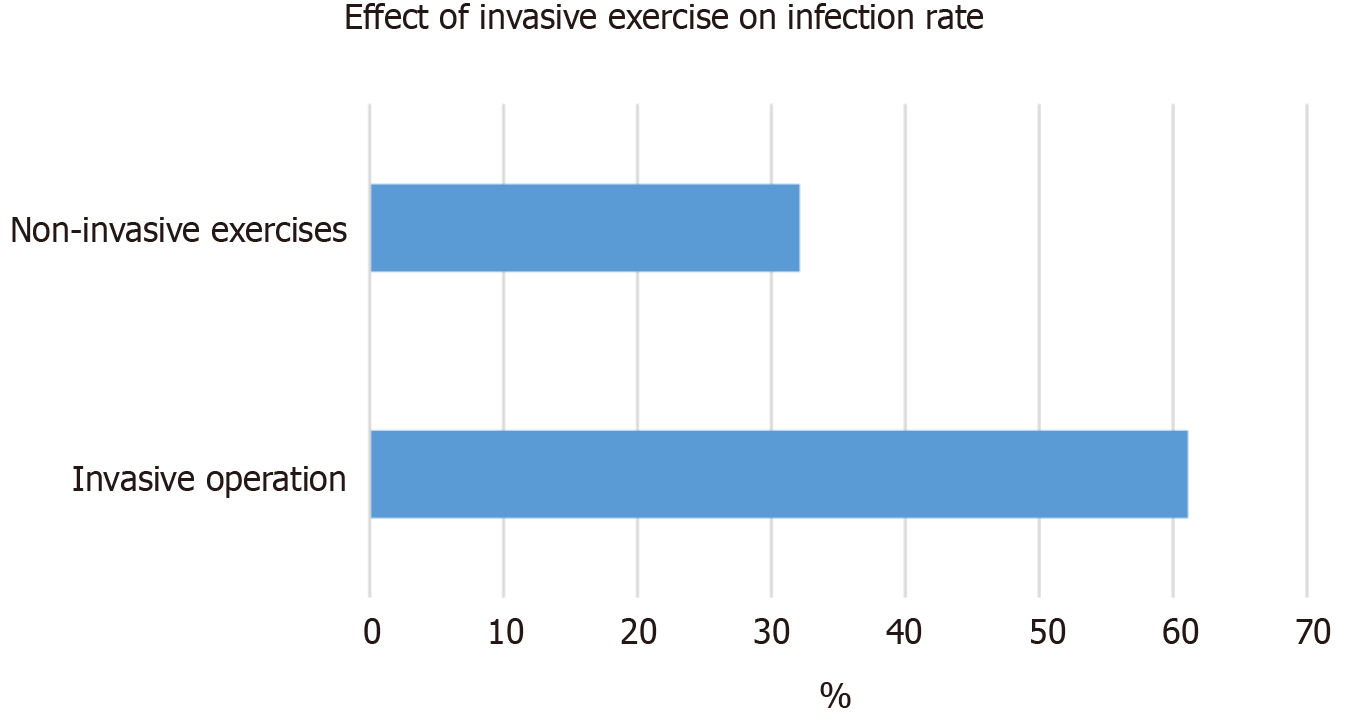
Figure 4 Comparison of the infection rate between patients who underwent invasive procedures and those who underwent noninvasive procedures.
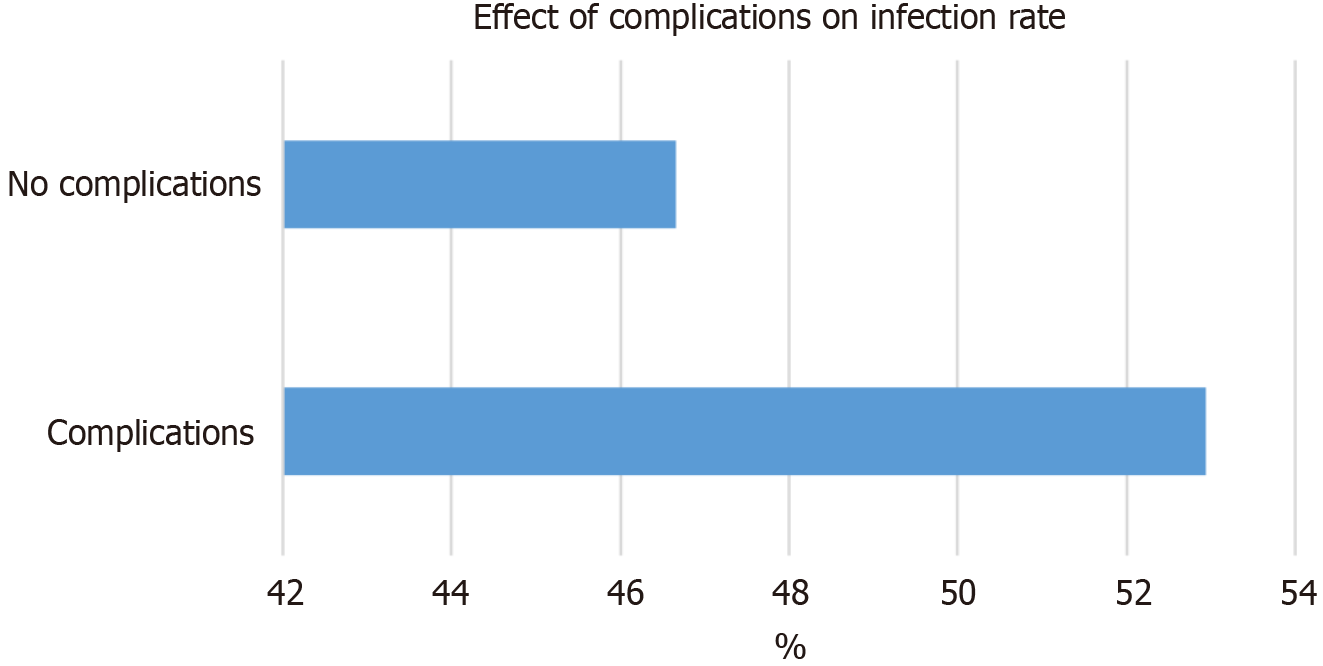
Figure 5 Comparison of the infection rate between patients with and without complications.
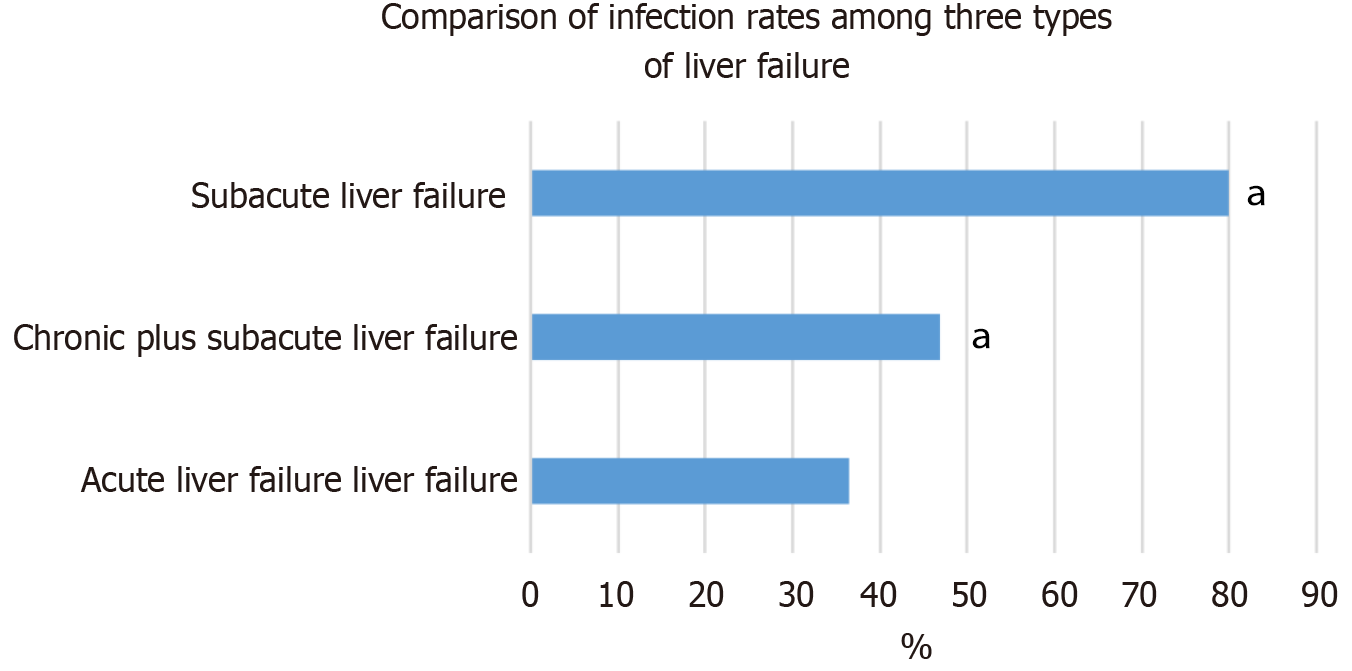
Figure 6 Comparison of the infection rate among patients categorized according to the type of liver failure.
aP < 0.05 versus acute liver failure.
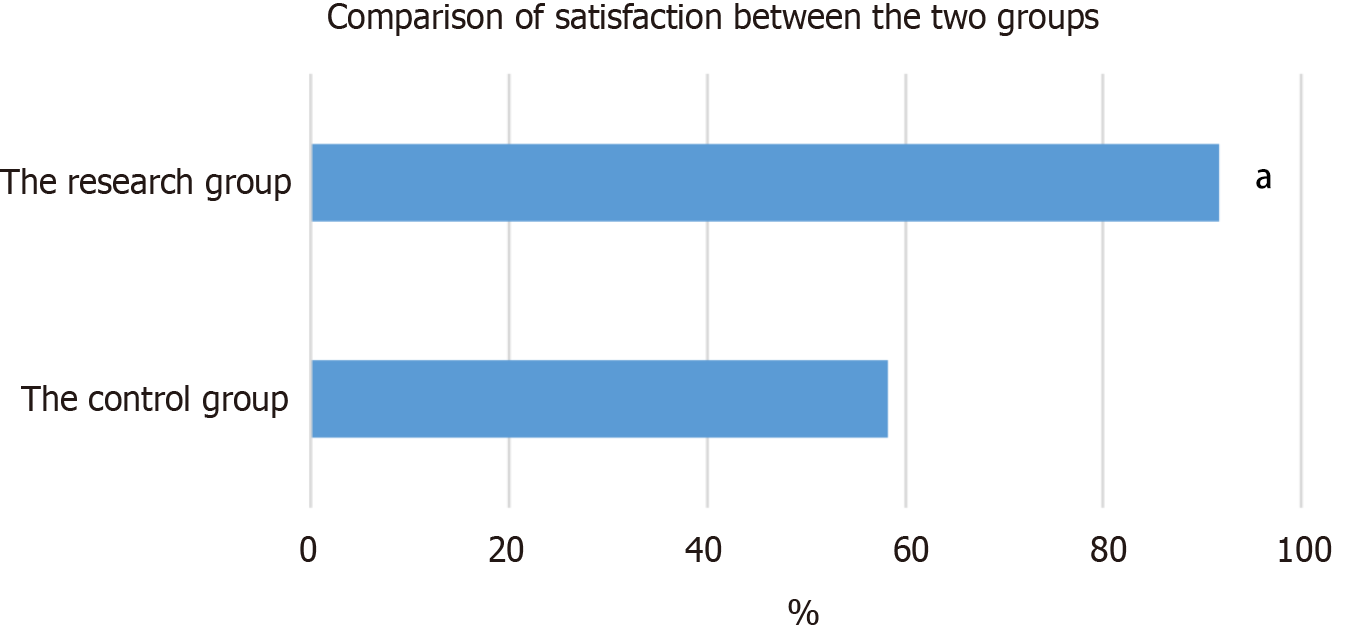
Figure 7 Comparison of satisfaction between the patients in the infected and uninfected groups.
aP < 0.05.
- Citation: Zhang WW, Chen L, Wu YF. Risk factors for secondary infection after liver failure and effect of comprehensive nursing intervention. World J Clin Cases 2024; 12(22): 4956-4964
- URL: https://www.wjgnet.com/2307-8960/full/v12/i22/4956.htm
- DOI: https://dx.doi.org/10.12998/wjcc.v12.i22.4956


