Copyright
©The Author(s) 2024.
World J Clin Cases. Aug 6, 2024; 12(22): 4924-4931
Published online Aug 6, 2024. doi: 10.12998/wjcc.v12.i22.4924
Published online Aug 6, 2024. doi: 10.12998/wjcc.v12.i22.4924
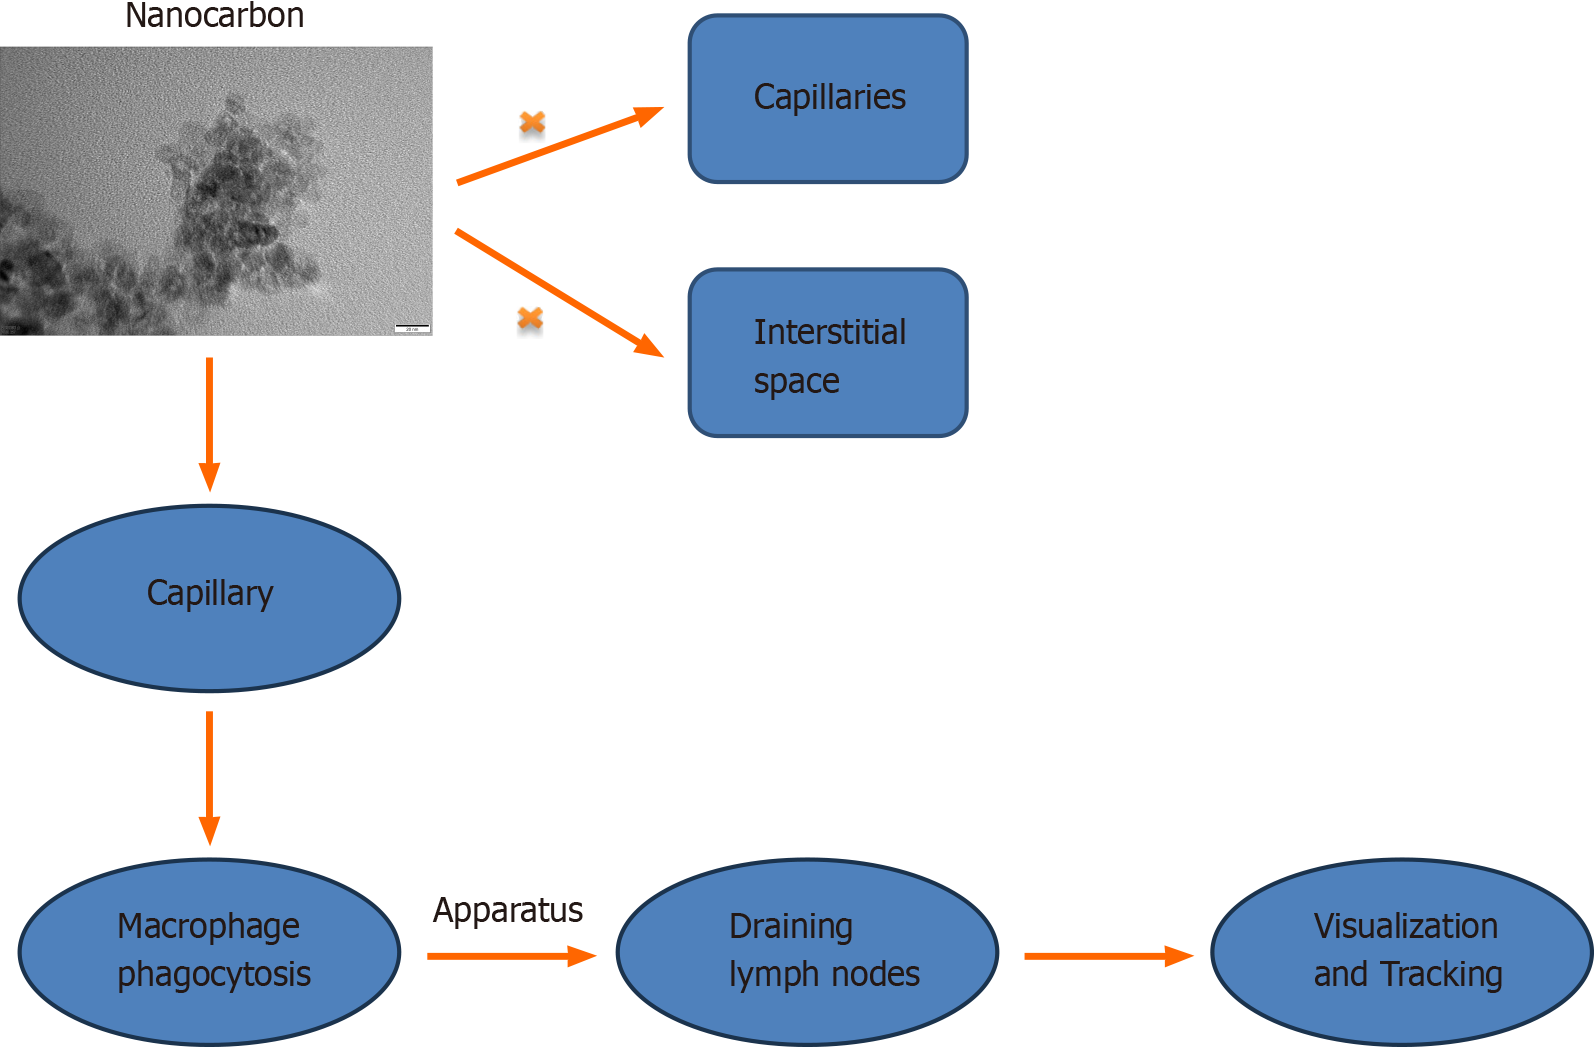
Figure 1
Schematic diagram of the visualization process using the nanocarbon lymph node tracer.
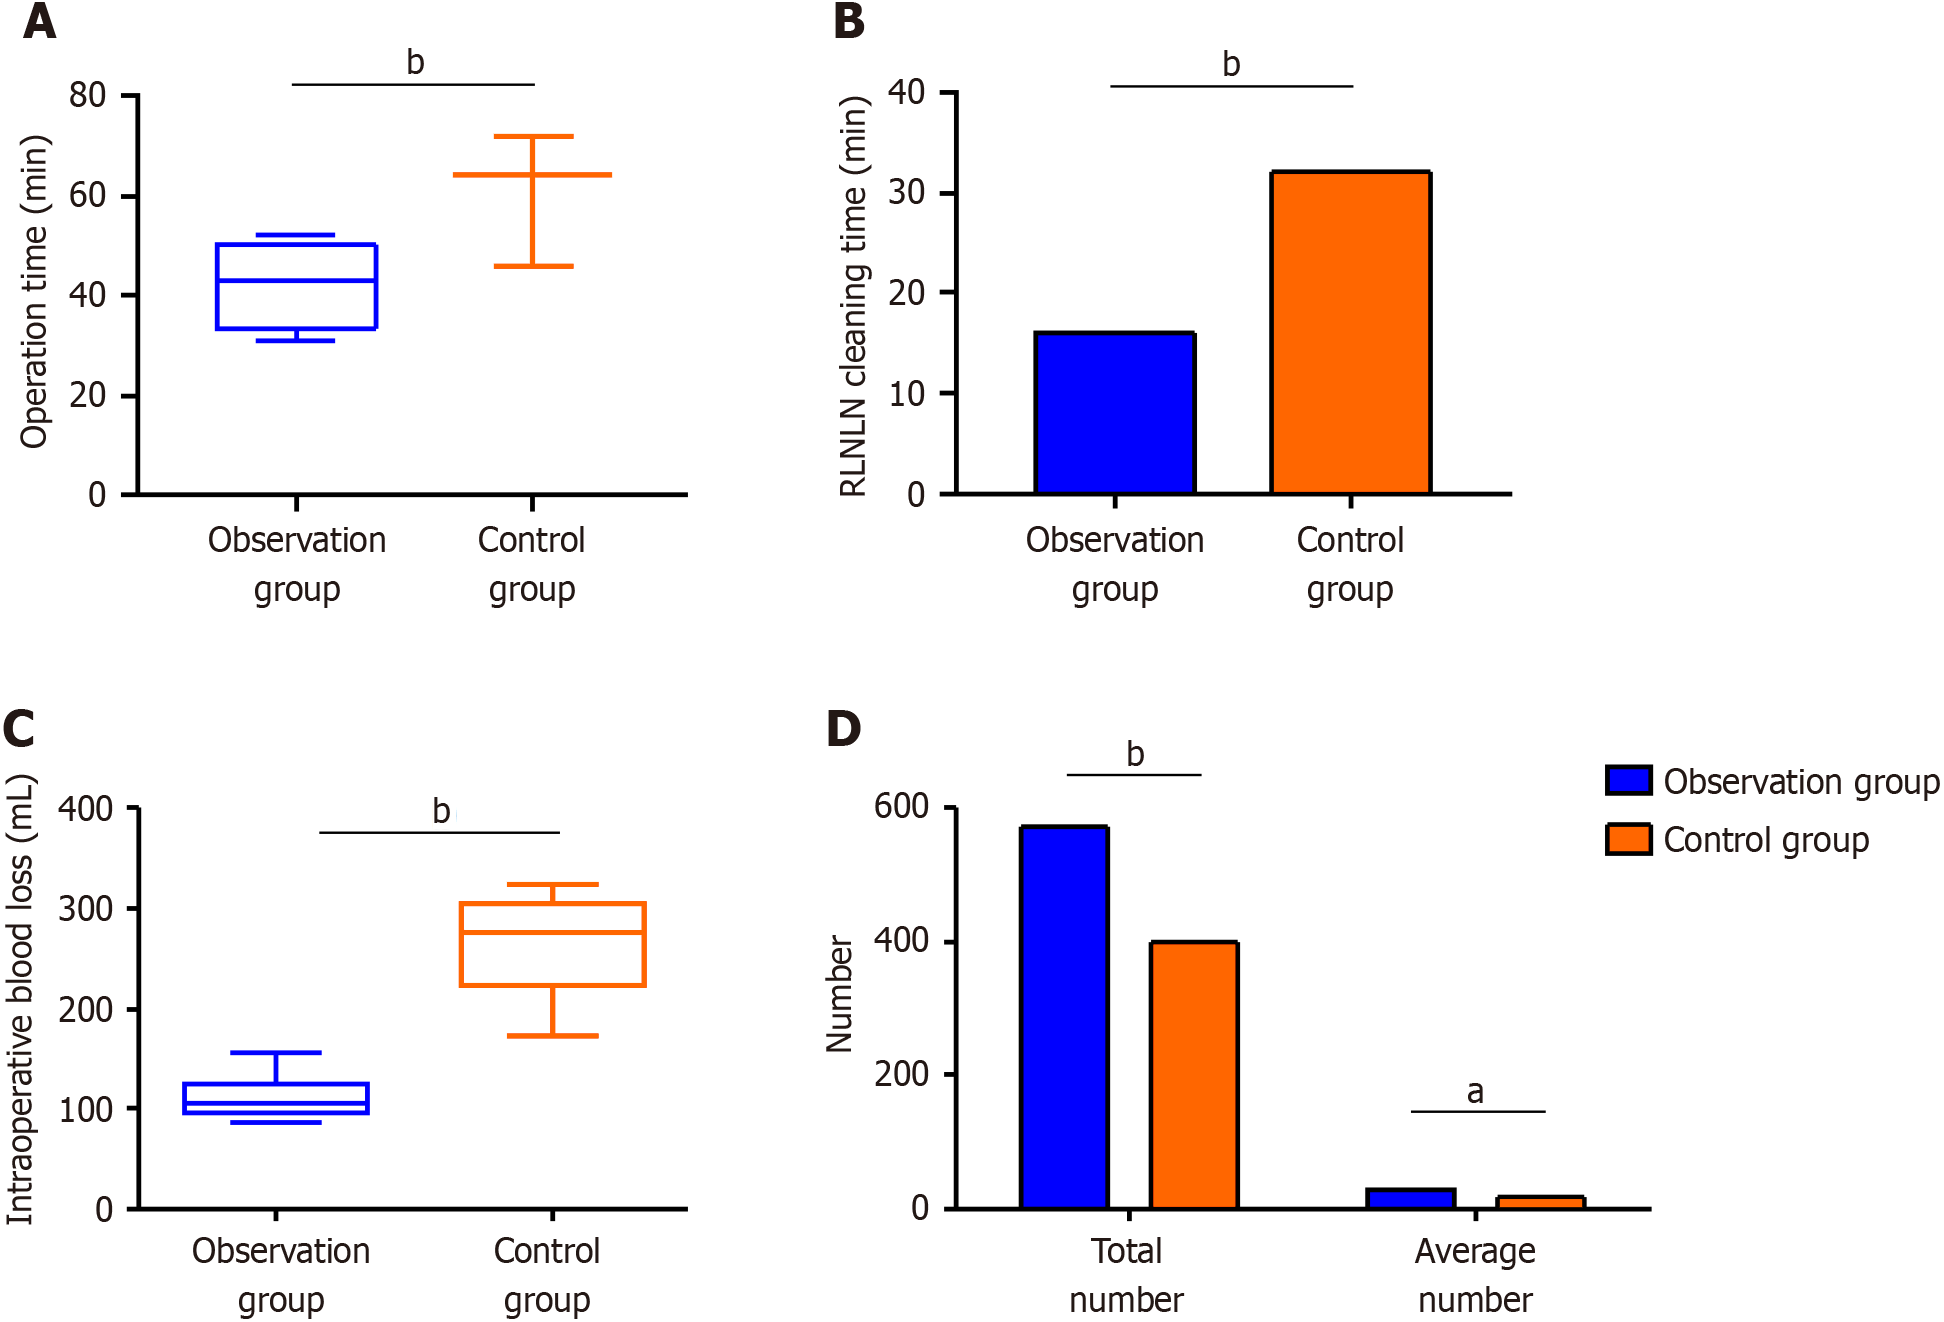
Figure 2 Comparison between the observation and control groups.
A: Operation time; B: Recurrent laryngeal nerve lymph node dissection time; C: Intraoperative blood loss; D: Number of dissected lymph nodes. aP < 0.05, indicates statistically significant difference between the two groups; bP < 0.01, indicates statistically significant difference between the two groups.
Figure 3 Comparison between the observation and control groups.
A: C-reactive protein (CRP); B: Cortisol; C: Adrenaline levels. aP < 0.05; bP < 0.01; cP < 0.001. E: Epinephrine.
Figure 4 Comparison between the observation and control groups in pre- and postoperative results.
A: Interleukin (IL)-6; B: IL-10; C: Tumor necrosis factor-alpha levels (TNF-a). aP < 0.05; bP < 0.01.
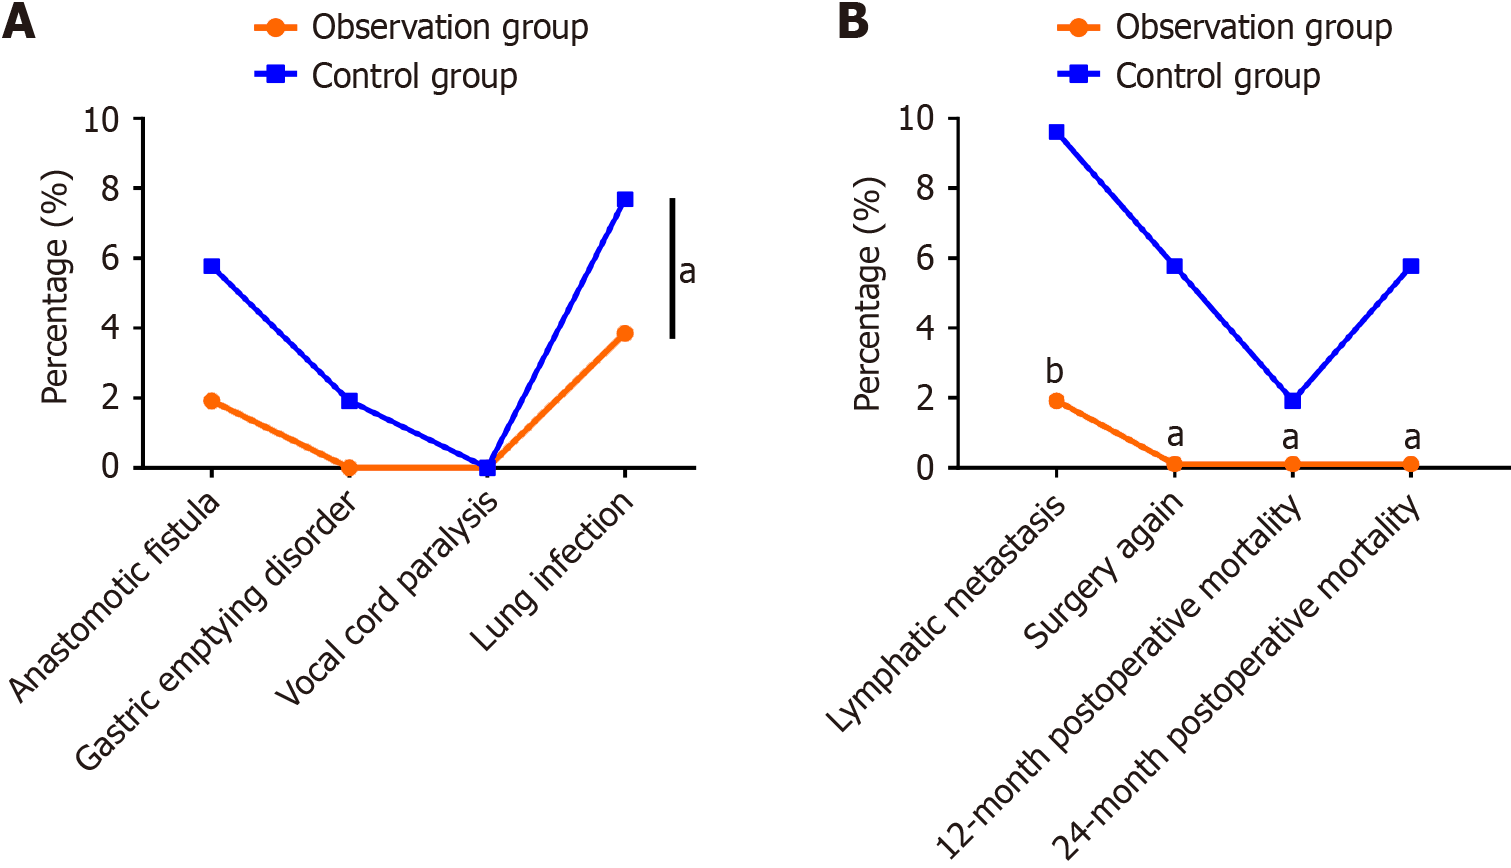
Figure 5 Comparison between the observation and control groups.
A: Occurrence of complications; B: Patient prognosis. aP < 0.05; bP < 0.01.
- Citation: Qi FQ, Sun Y. Efficacy and prognostic analysis of carbon nanotracers combined with the da Vinci robot in the treatment of esophageal cancer. World J Clin Cases 2024; 12(22): 4924-4931
- URL: https://www.wjgnet.com/2307-8960/full/v12/i22/4924.htm
- DOI: https://dx.doi.org/10.12998/wjcc.v12.i22.4924


