Copyright
©The Author(s) 2024.
World J Clin Cases. Aug 6, 2024; 12(22): 4913-4923
Published online Aug 6, 2024. doi: 10.12998/wjcc.v12.i22.4913
Published online Aug 6, 2024. doi: 10.12998/wjcc.v12.i22.4913
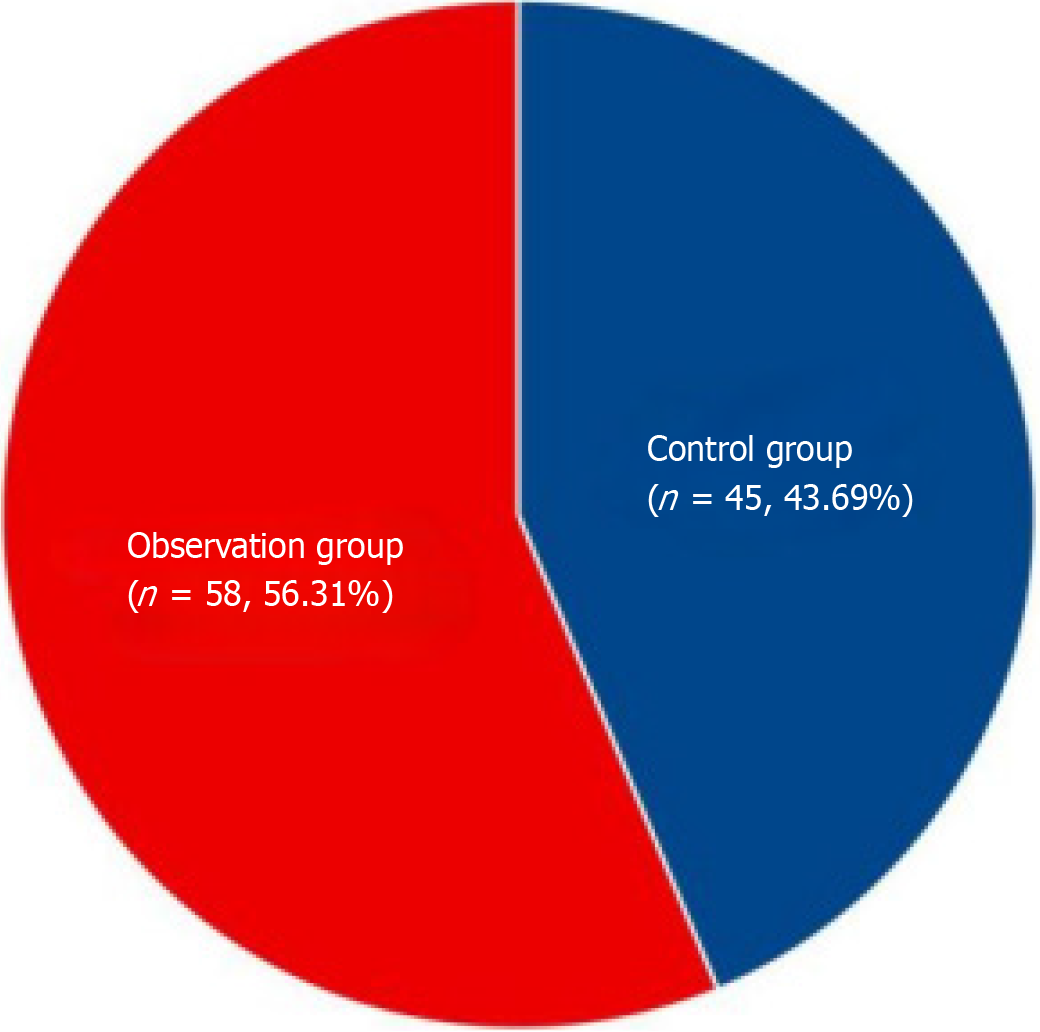
Figure 1
Comparison of the total effective rate of clinical treatment between the two groups.
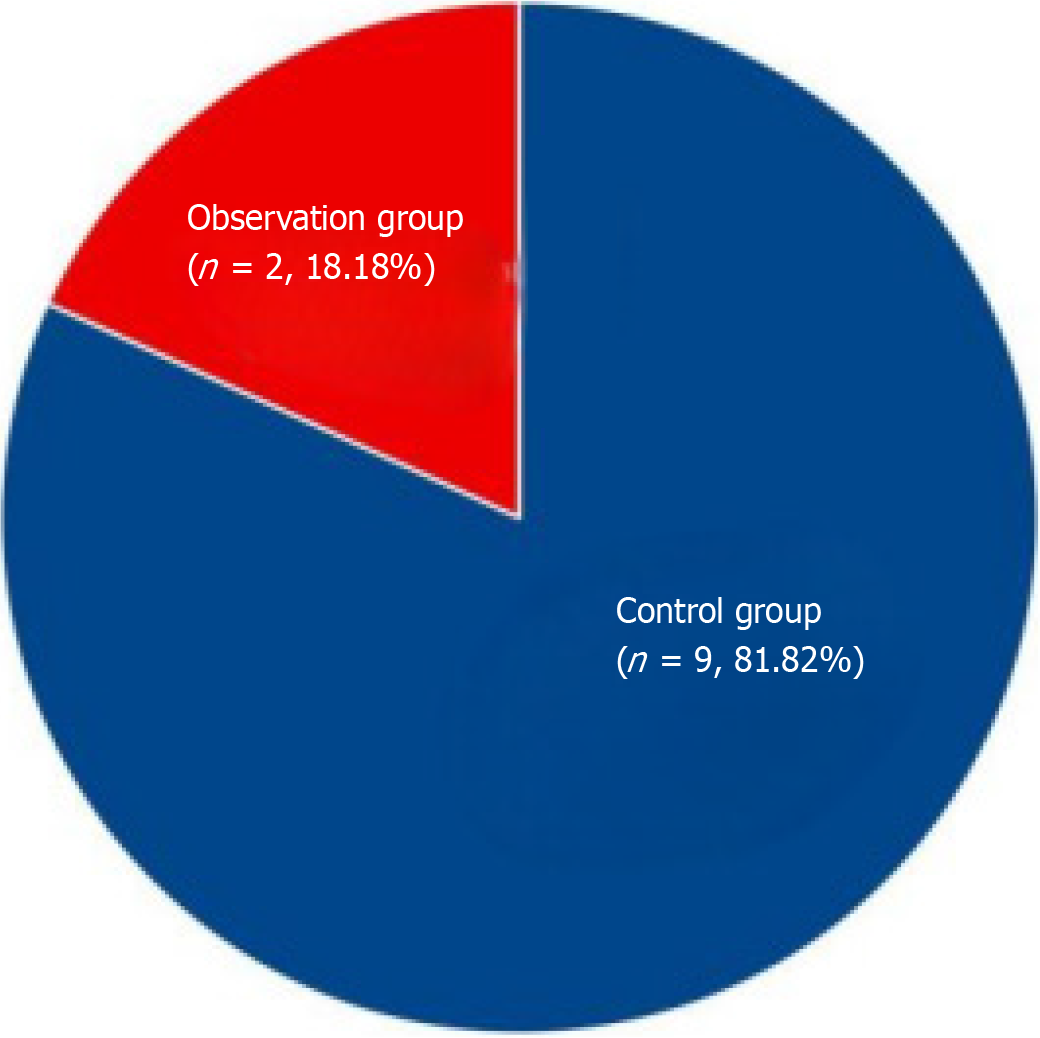
Figure 2
Comparison of the frequency of adverse reactions (vomiting, nausea, anorexia) between the two groups of patients.
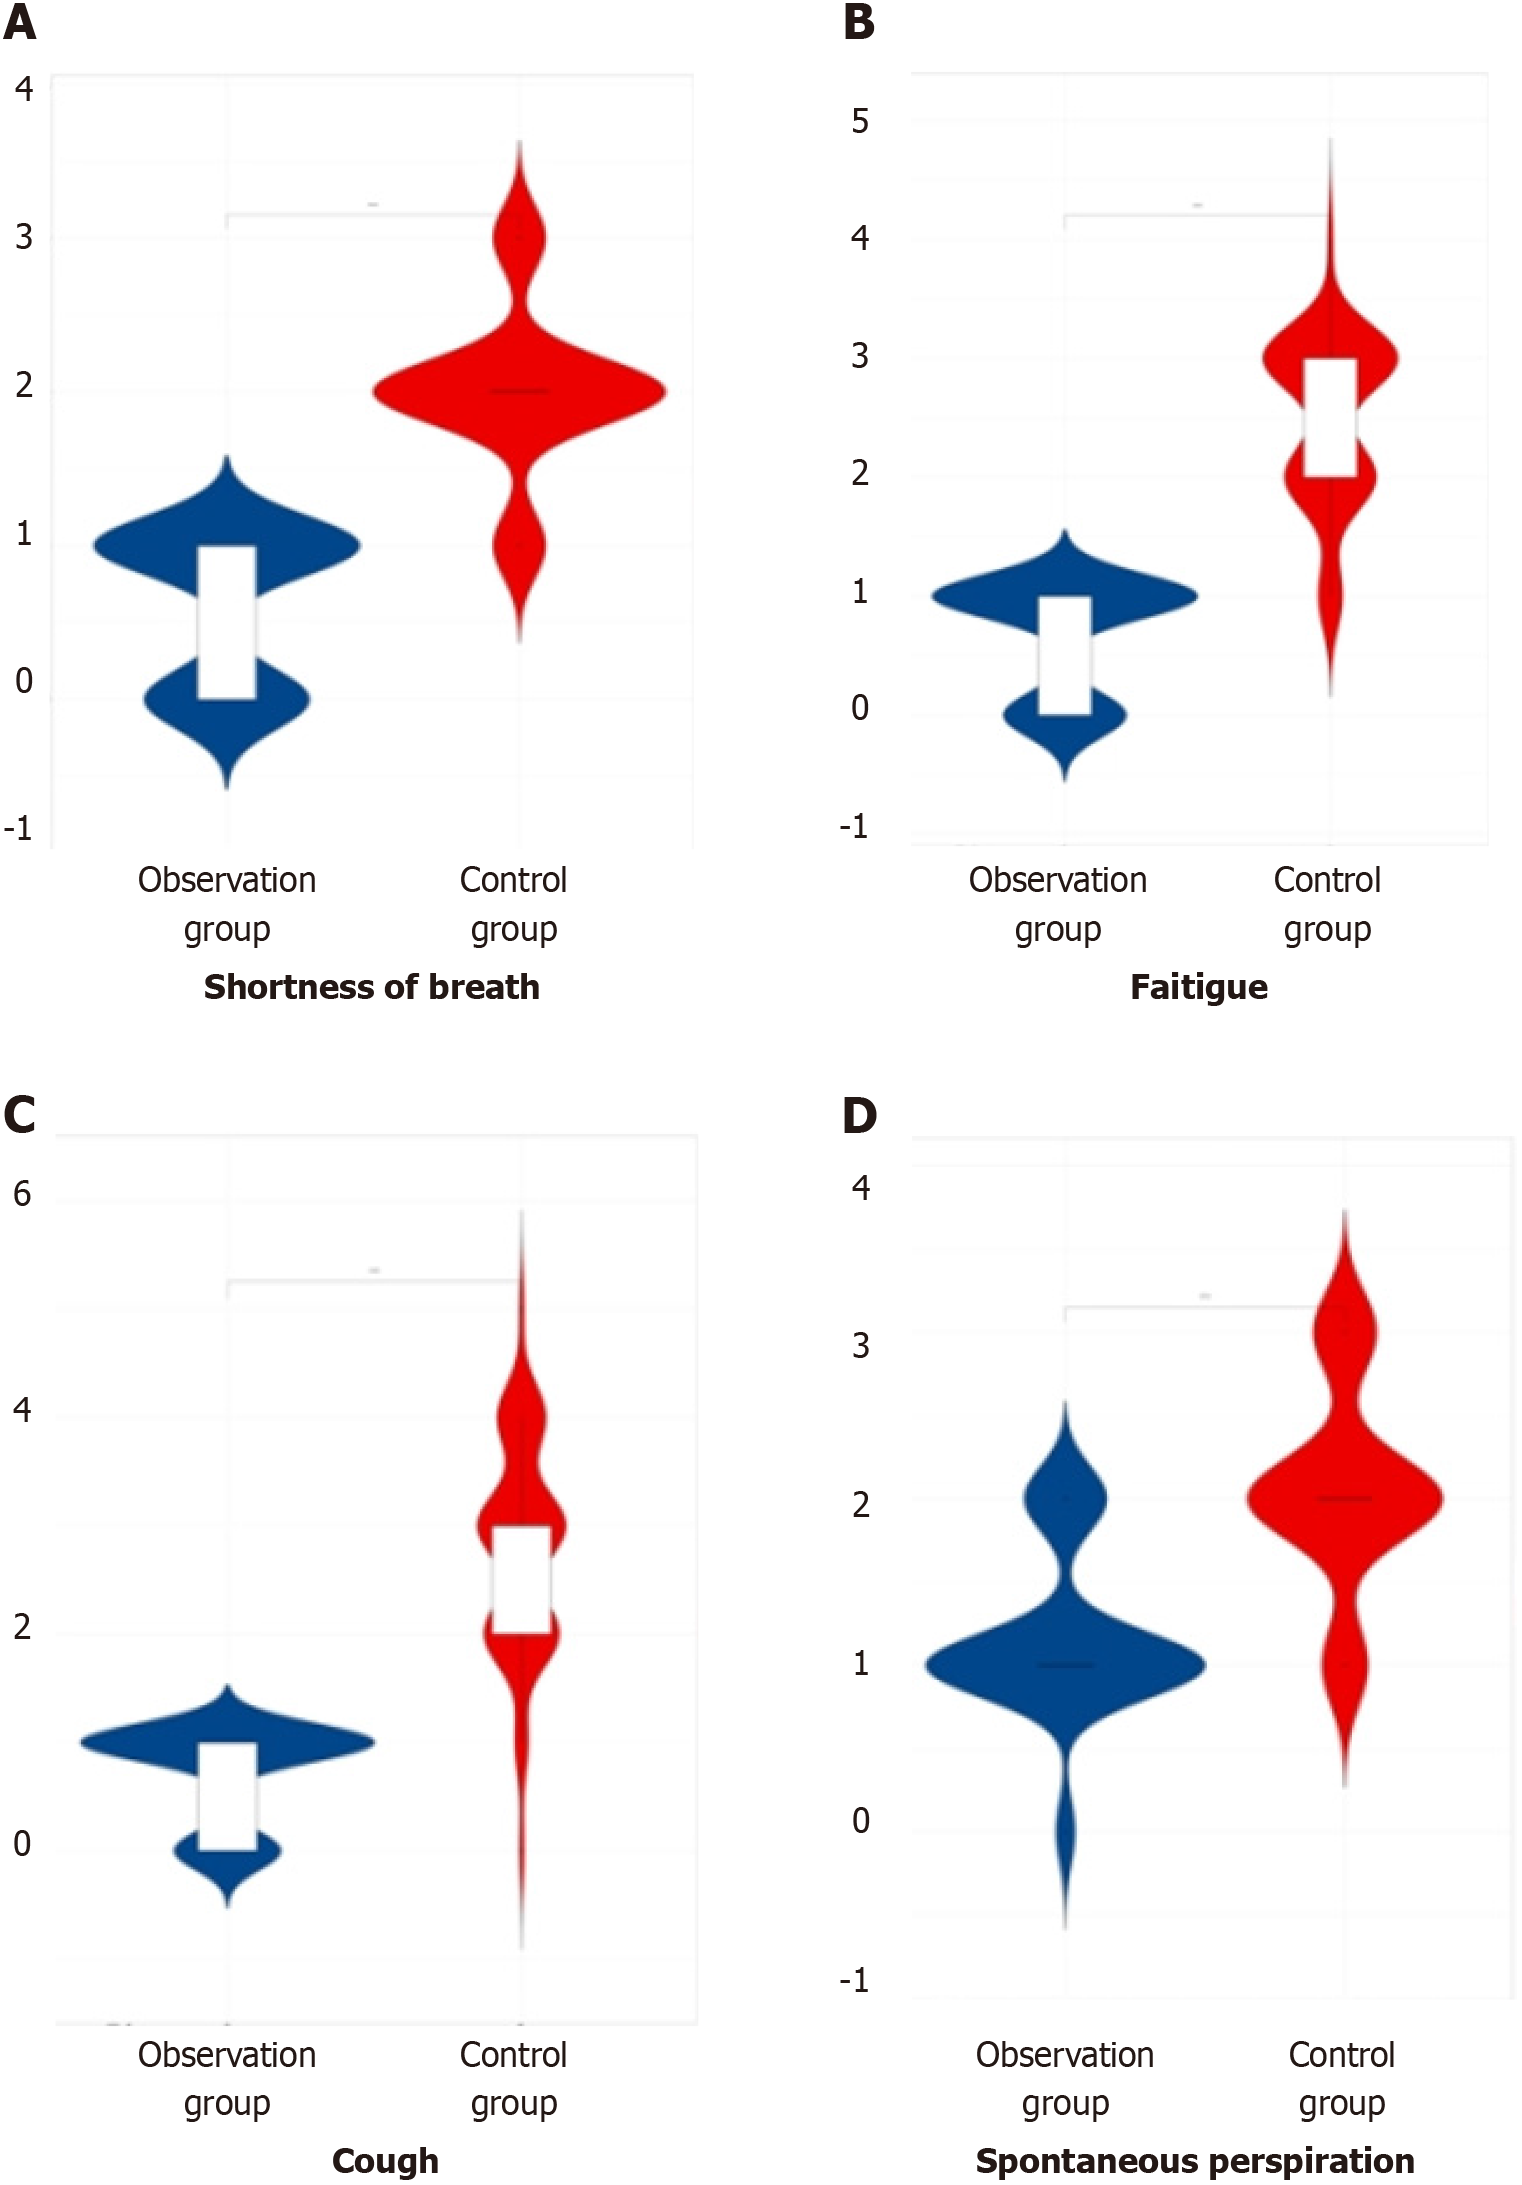
Figure 3 Comparison of symptom points between the two groups of patients.
A: Shortness of breath; B: Fatigue; C: Cough; D: Spontaneous perspiration.
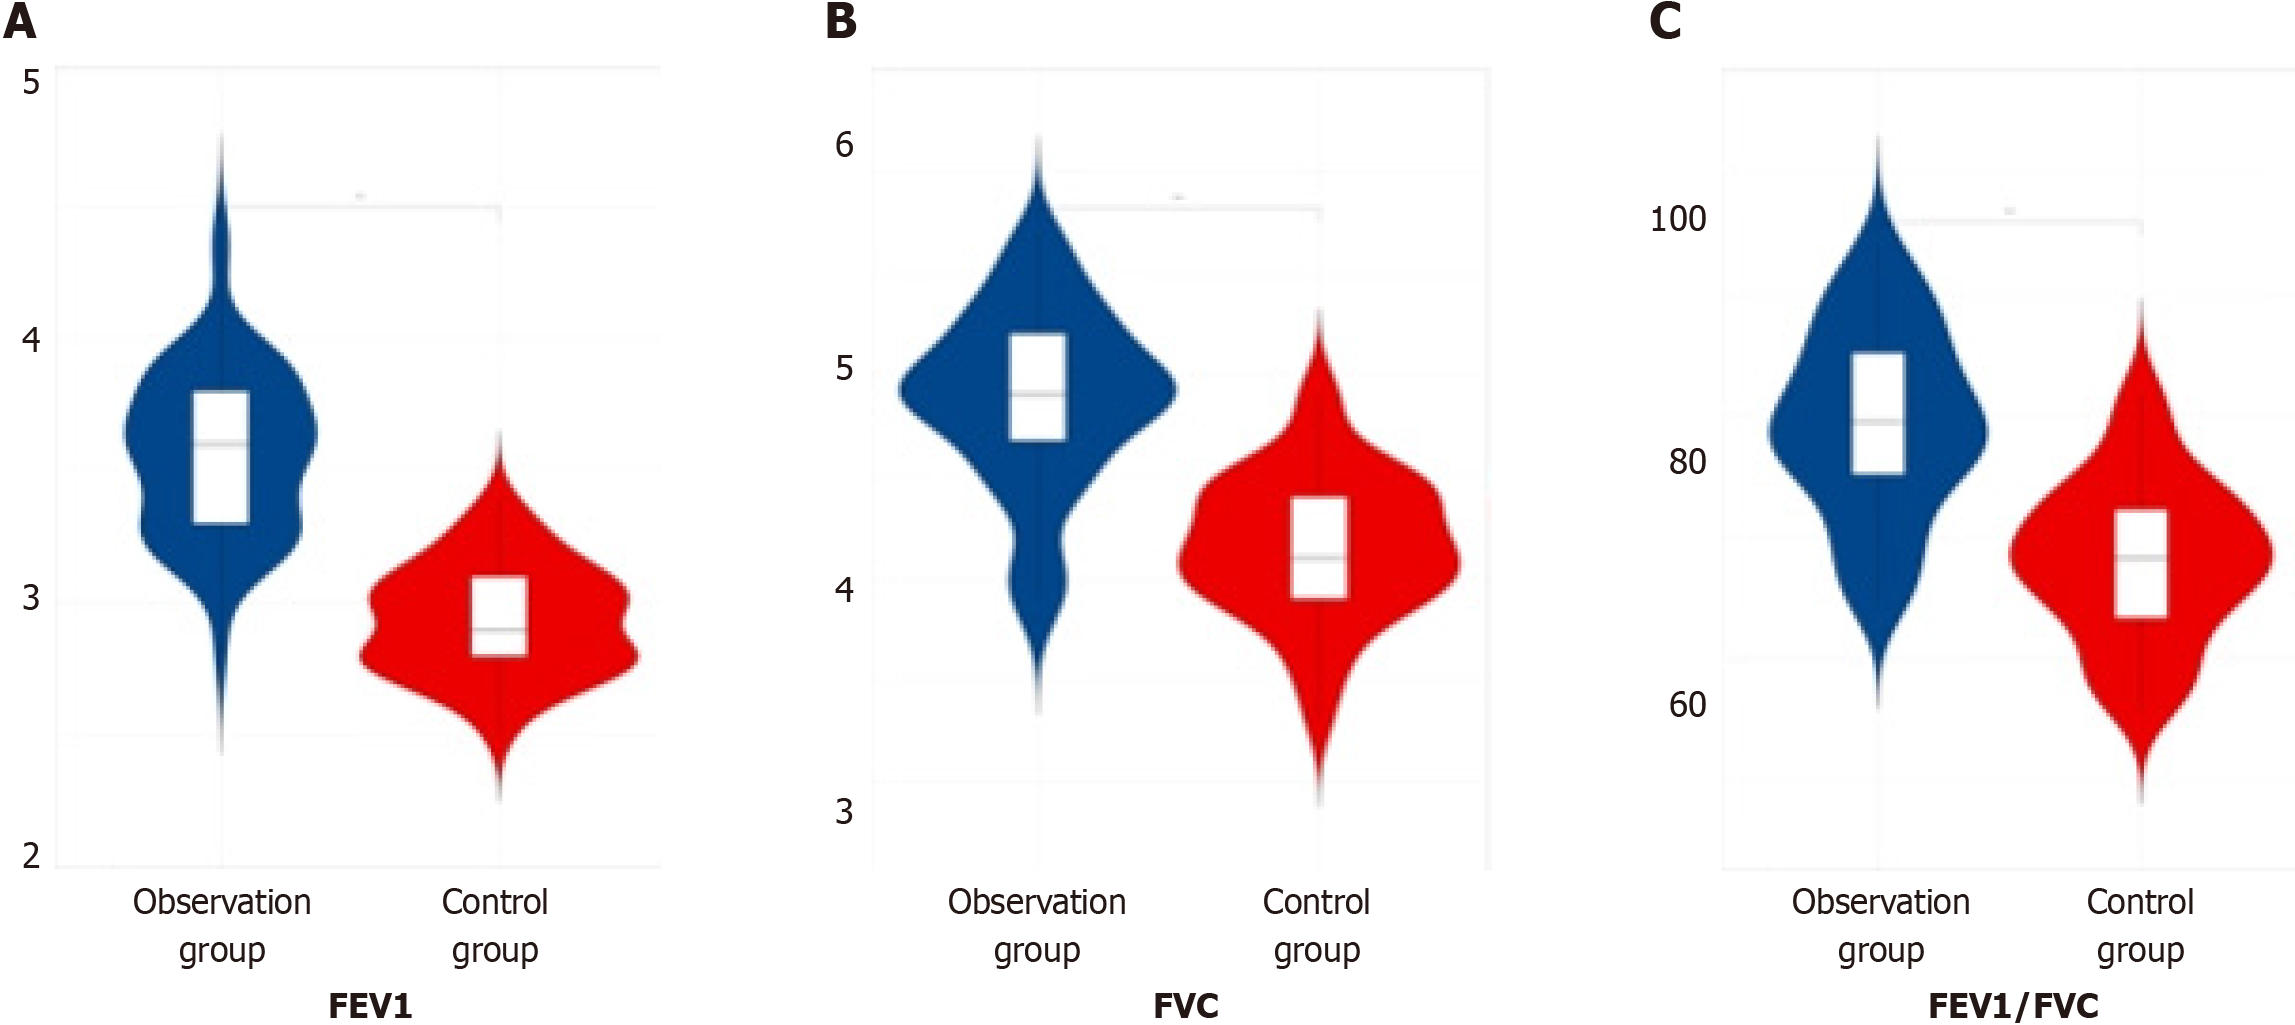
Figure 4 Comparison of the levels of pulmonary function indicators between the two groups.
A: 1-s forced expiratory volume (FEV1); B: Forced vital capacity (FVC); C: FEV1/FVC.
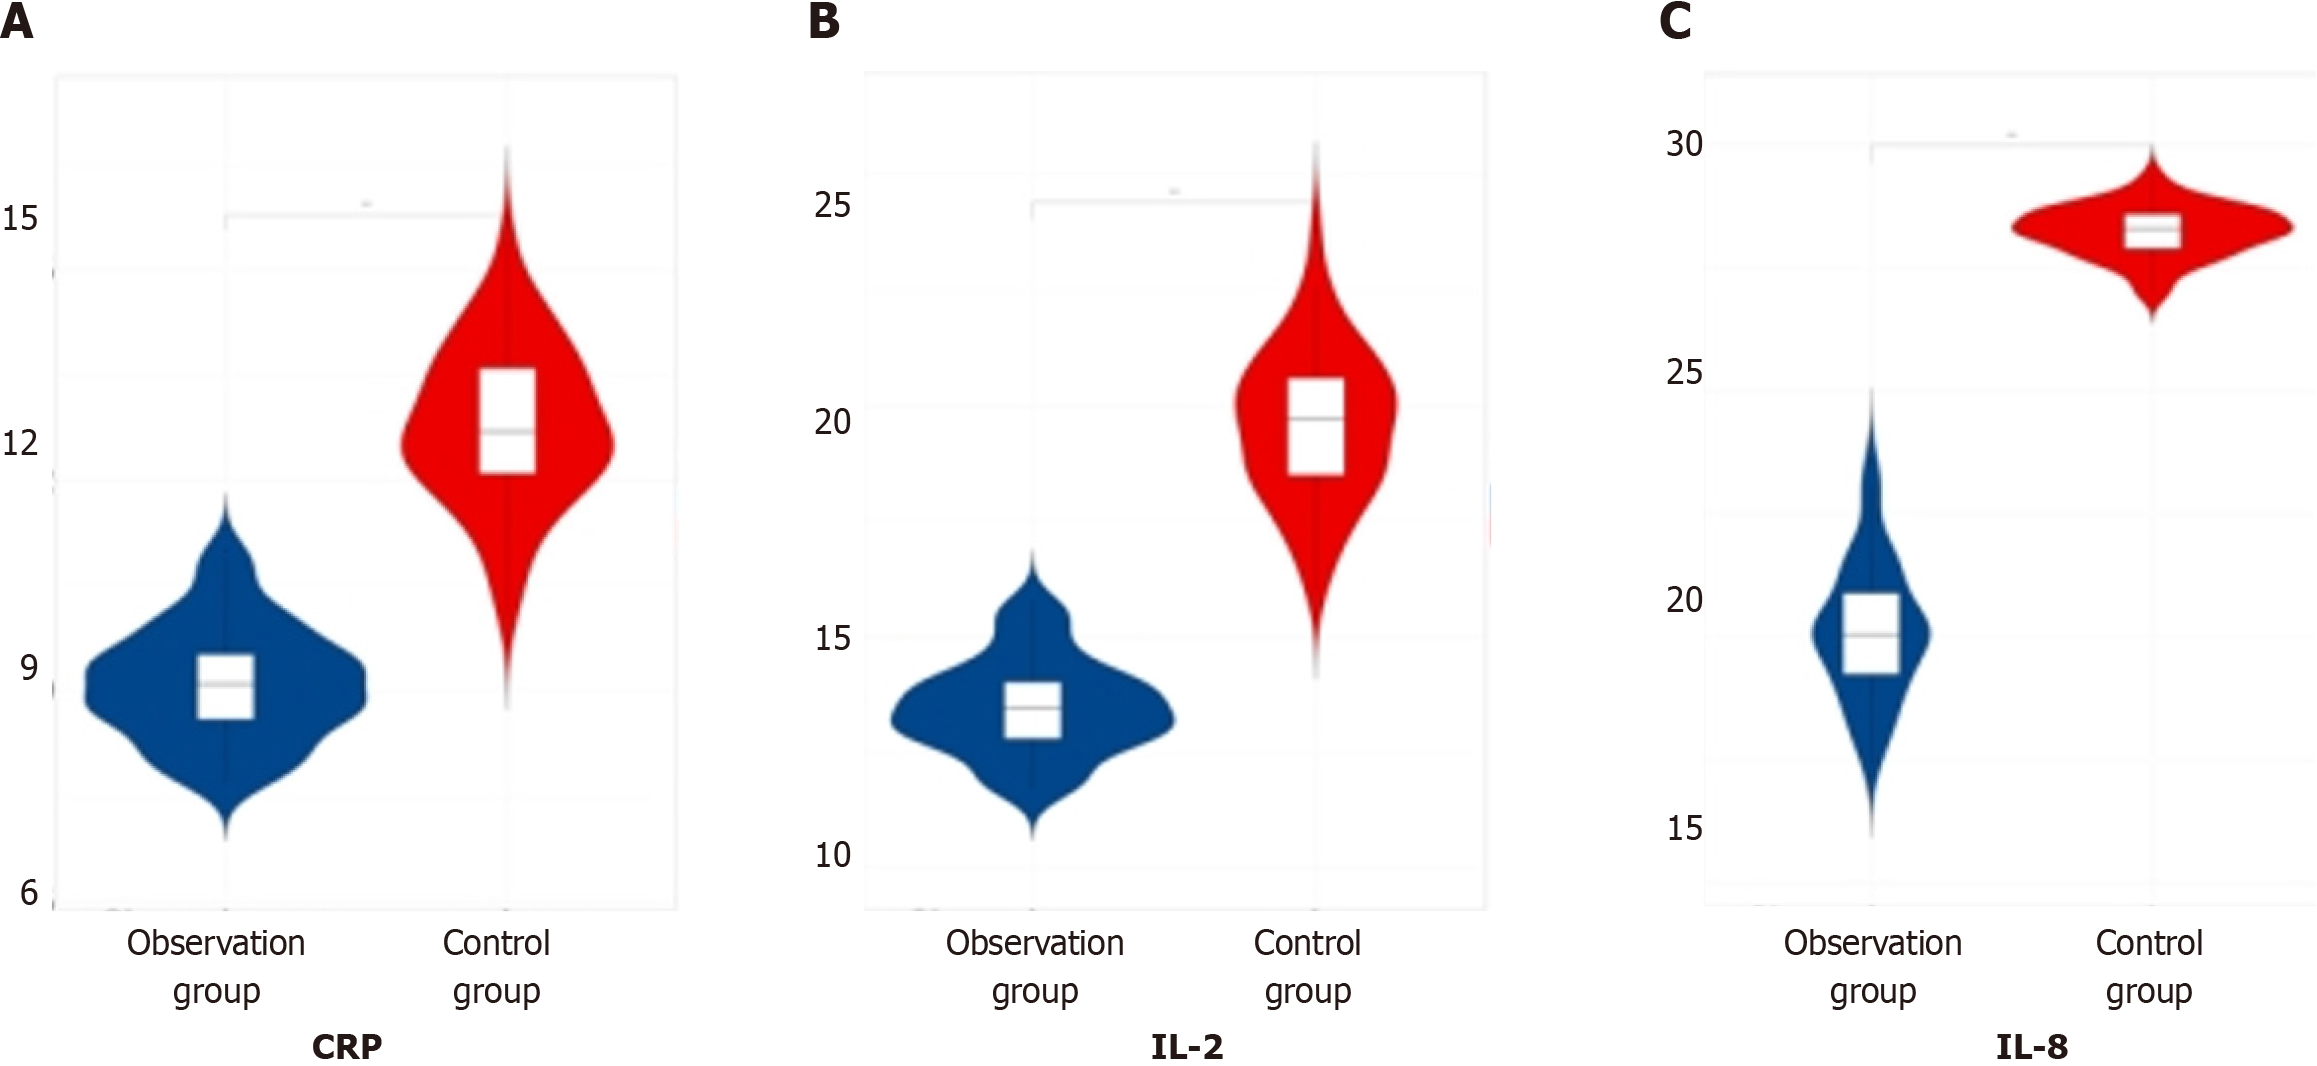
Figure 5 Comparison of inflammatory factor indicators between the two groups of patients.
A: C-reactive protein (CRP); B: Interleukin 2 (IL-2); C: IL-8.
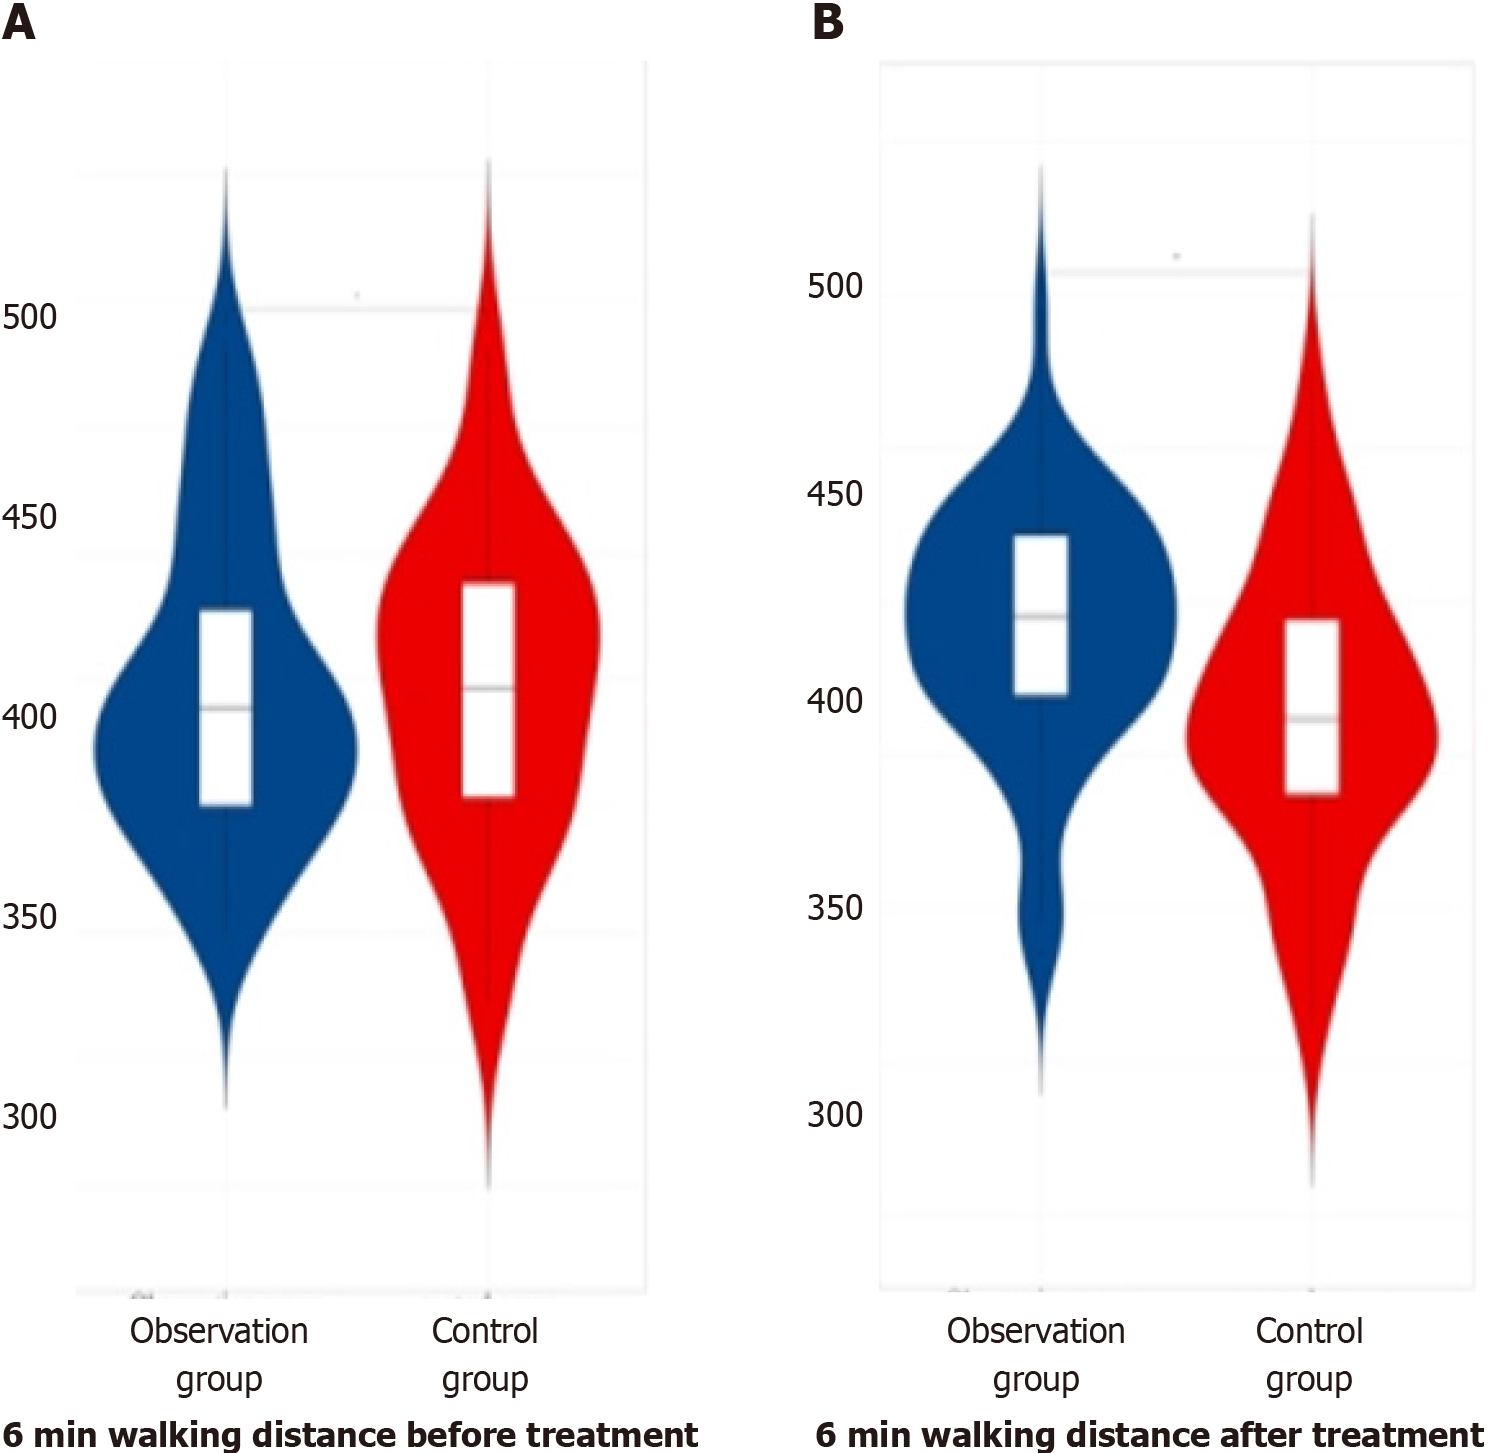
Figure 6 Comparison of 6-min walking distance between the two groups of patients before and after therapy.
A: Before therapy; B: After therapy.
- Citation: Lei Y, Sheng JH, Jin XR, Liu XB, Zheng XY, Xu XH. Study on the efficacy of early treatment with pirfenidone on the lung function of patients with idiopathic pulmonary fibrosis. World J Clin Cases 2024; 12(22): 4913-4923
- URL: https://www.wjgnet.com/2307-8960/full/v12/i22/4913.htm
- DOI: https://dx.doi.org/10.12998/wjcc.v12.i22.4913


