Copyright
©The Author(s) 2024.
World J Clin Cases. Aug 6, 2024; 12(22): 4897-4904
Published online Aug 6, 2024. doi: 10.12998/wjcc.v12.i22.4897
Published online Aug 6, 2024. doi: 10.12998/wjcc.v12.i22.4897
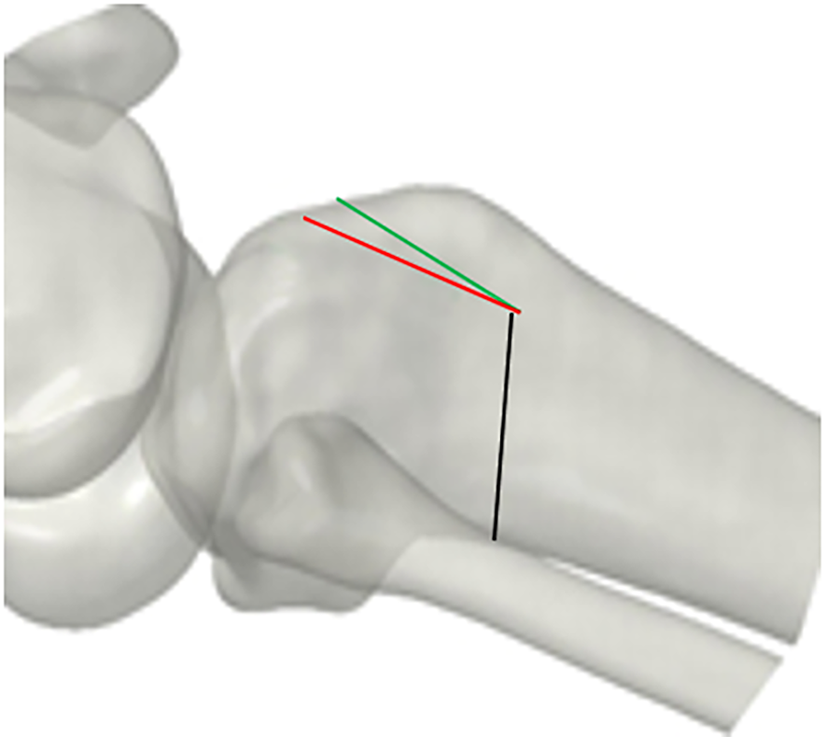
Figure 1 Surgical details.
The green line is the ascending osteotomy line behind the tibial tubercle and the red line is another wedge osteotomy line. The area between the two lines is closed to correct the posterior tibial slope.
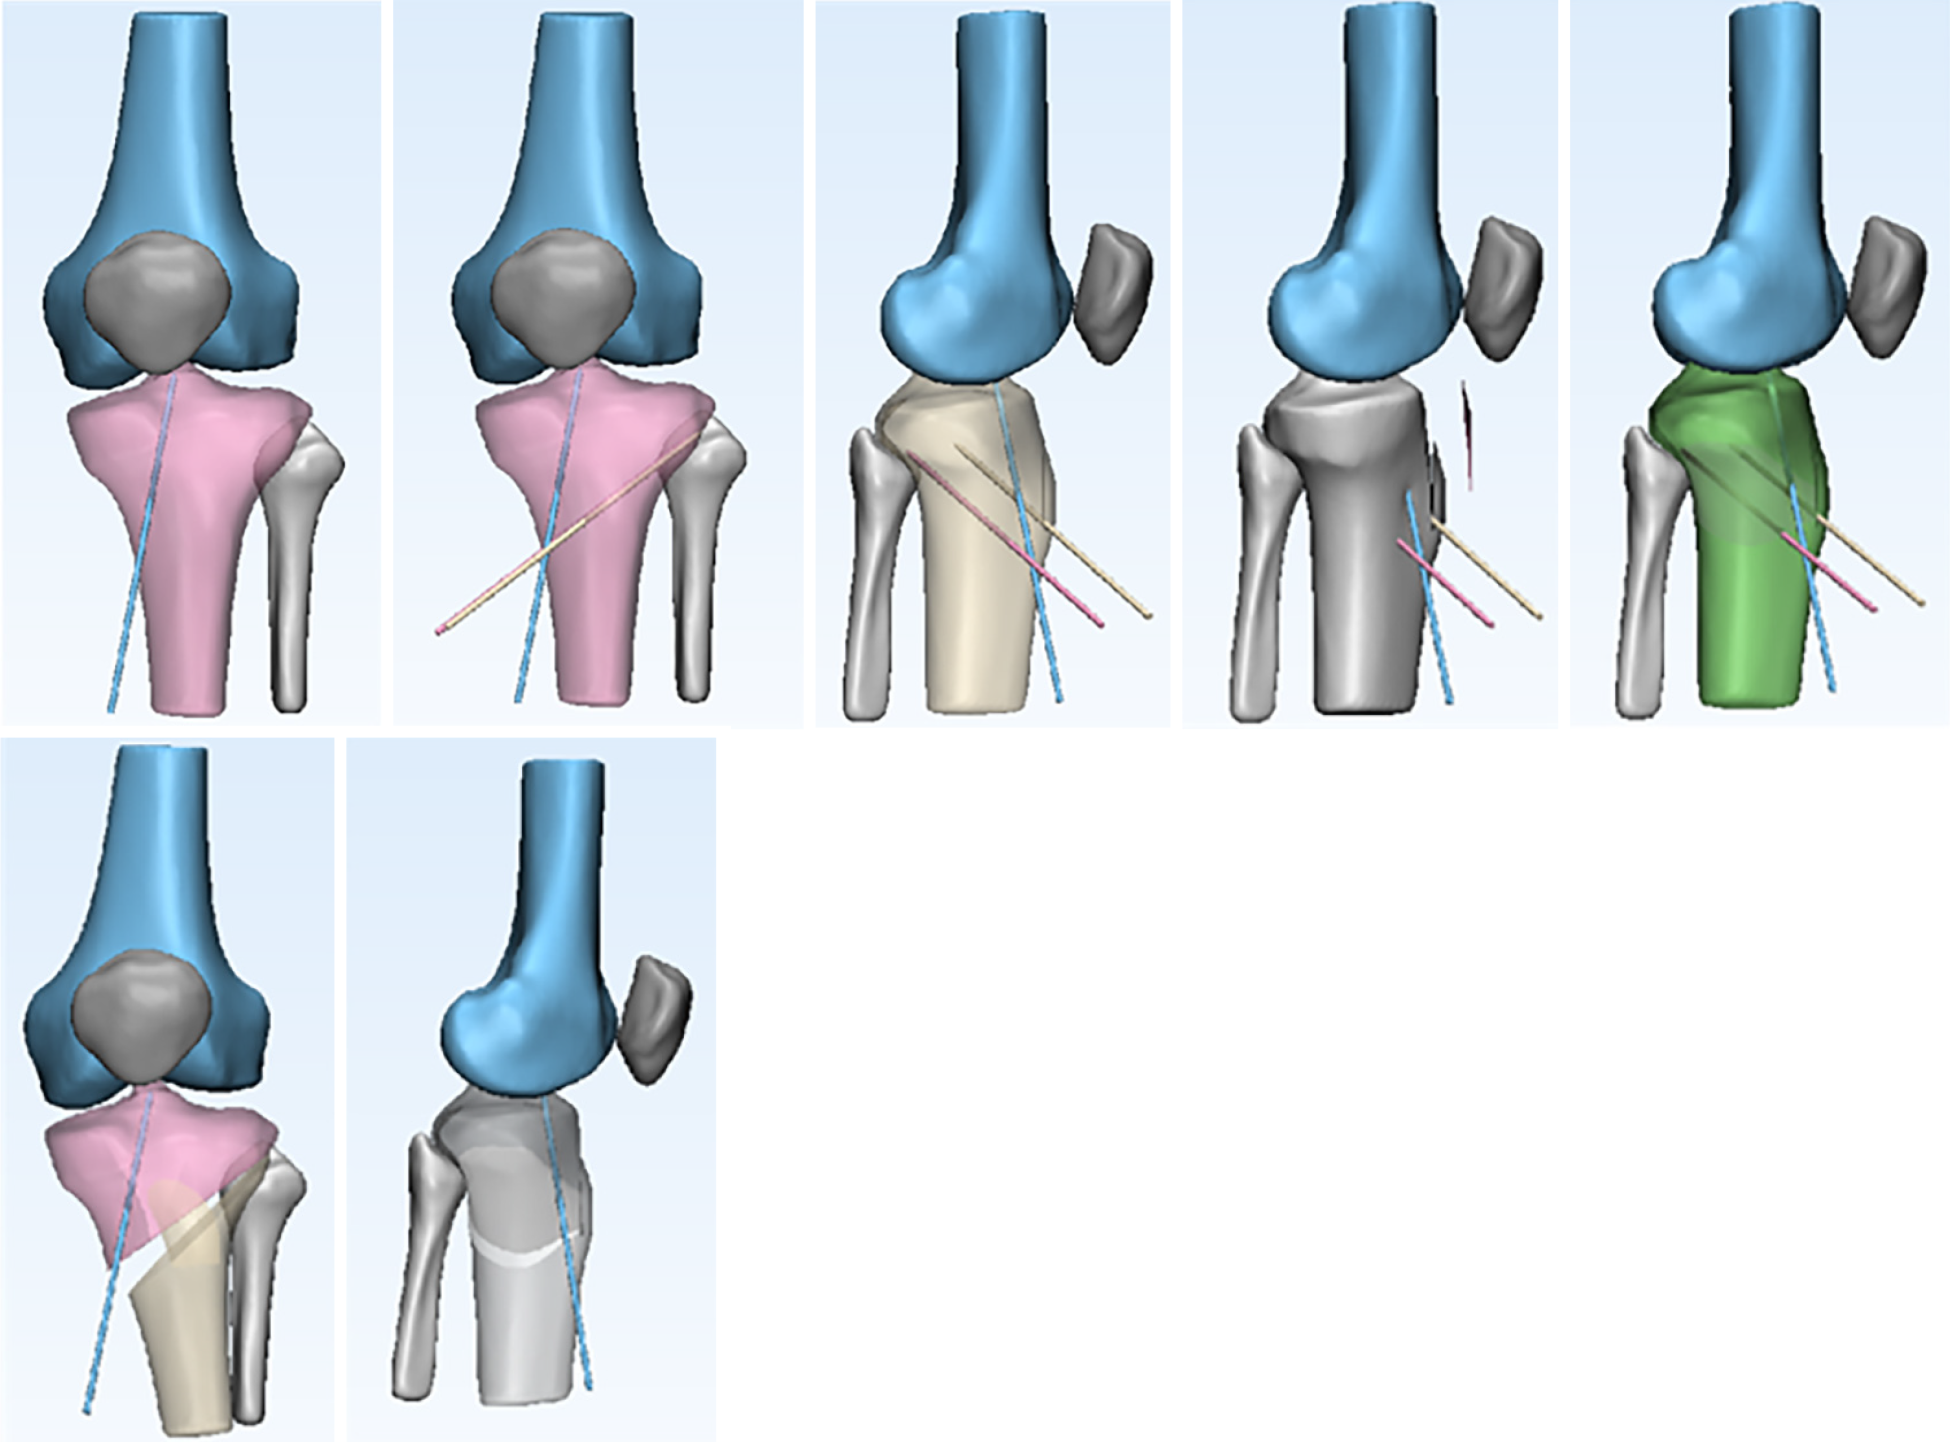
Figure 2 Detailed operation procedure.
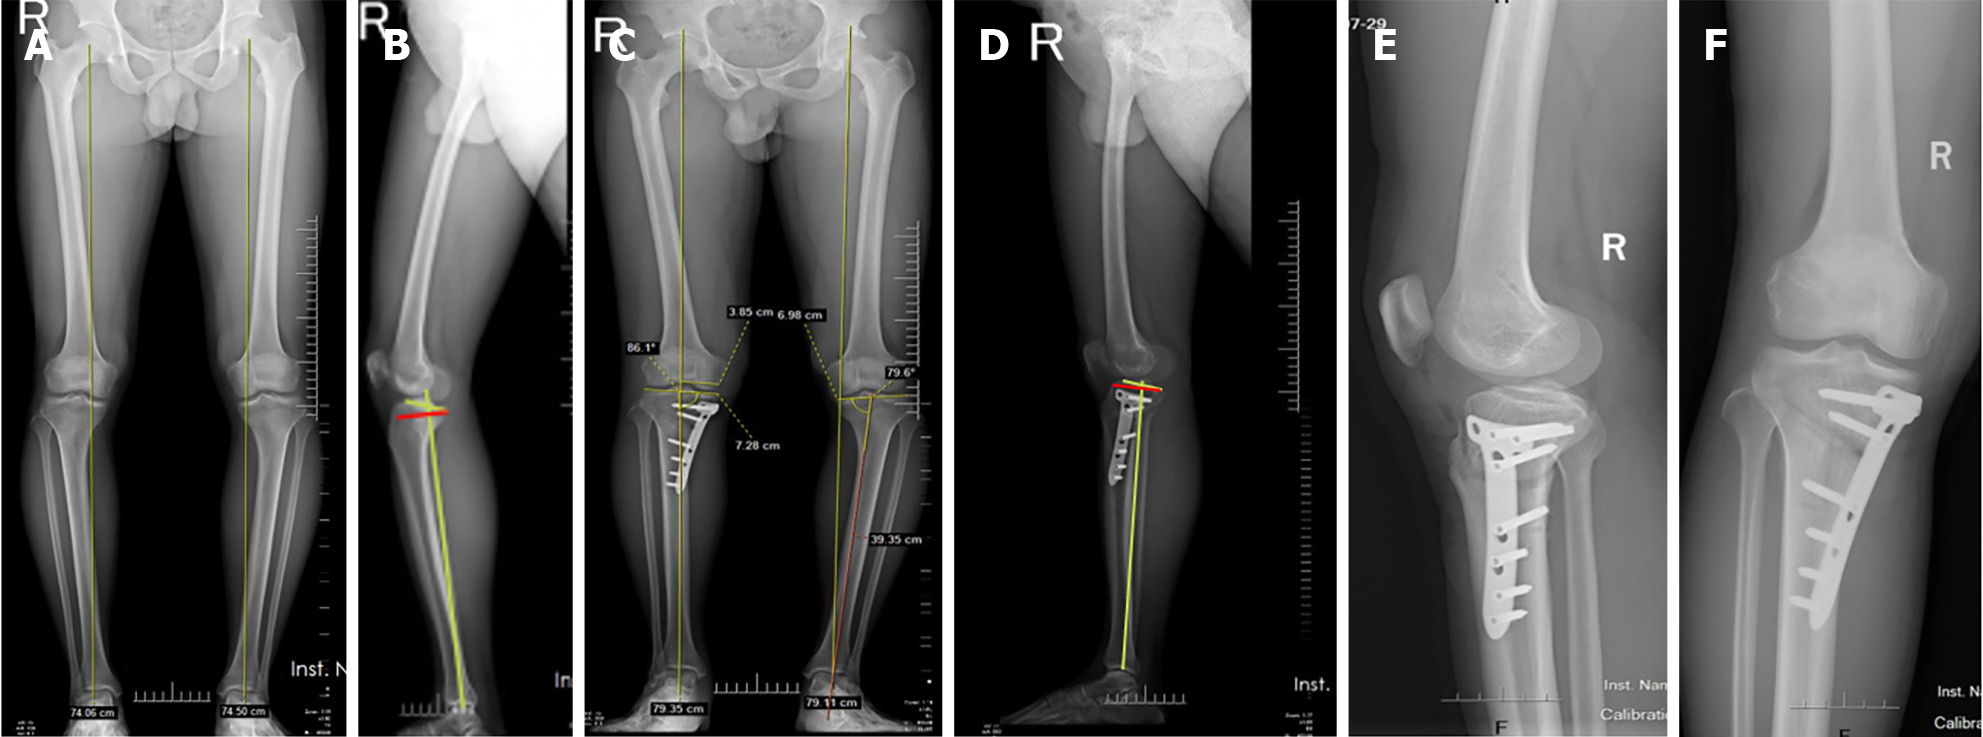
Figure 3 Knee imaging findings.
A: Radiograph showing left knee varus deformity, and the preoperative force line was 12%; B: Preoperative posterior tibial slope was 14 degrees; C: Radiograph showing the postoperative line of force position was 52%; D: Postoperative posterior tibial slope was 9 degrees; E and F: At last follow-up, X-ray indicated that the osteotomy area was well healed, with no nonunion, loss of correction, etc.
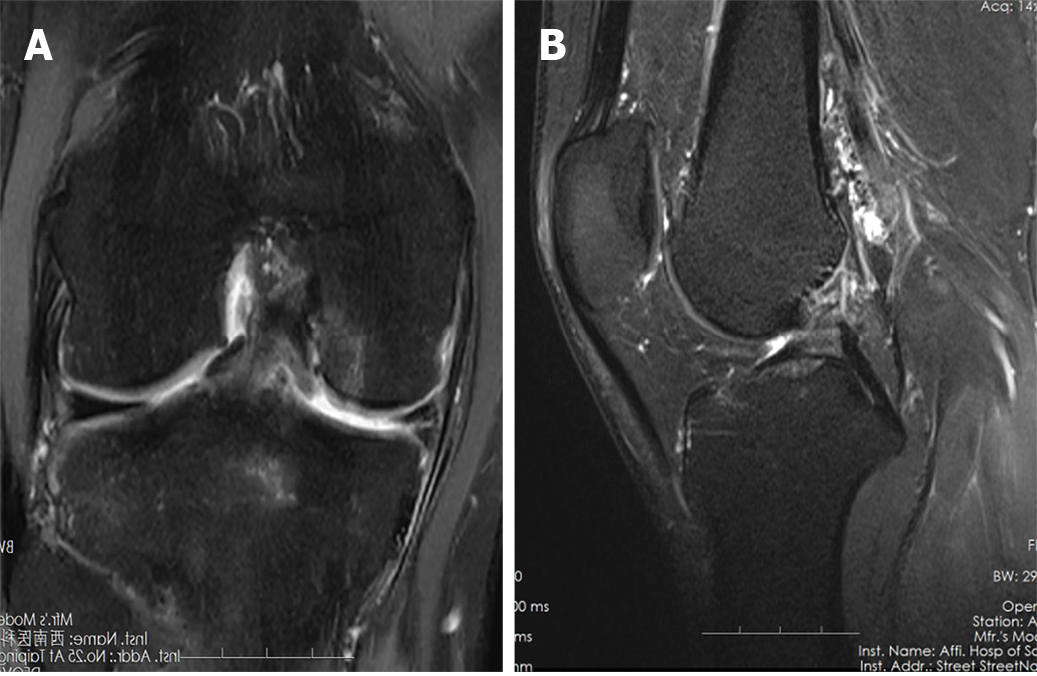
Figure 4 Magnetic resonance imaging findings.
A and B: Preoperative magnetic resonance imaging confirmed rupture of the anterior cruciate ligament and medial meniscus posterior horn tear.
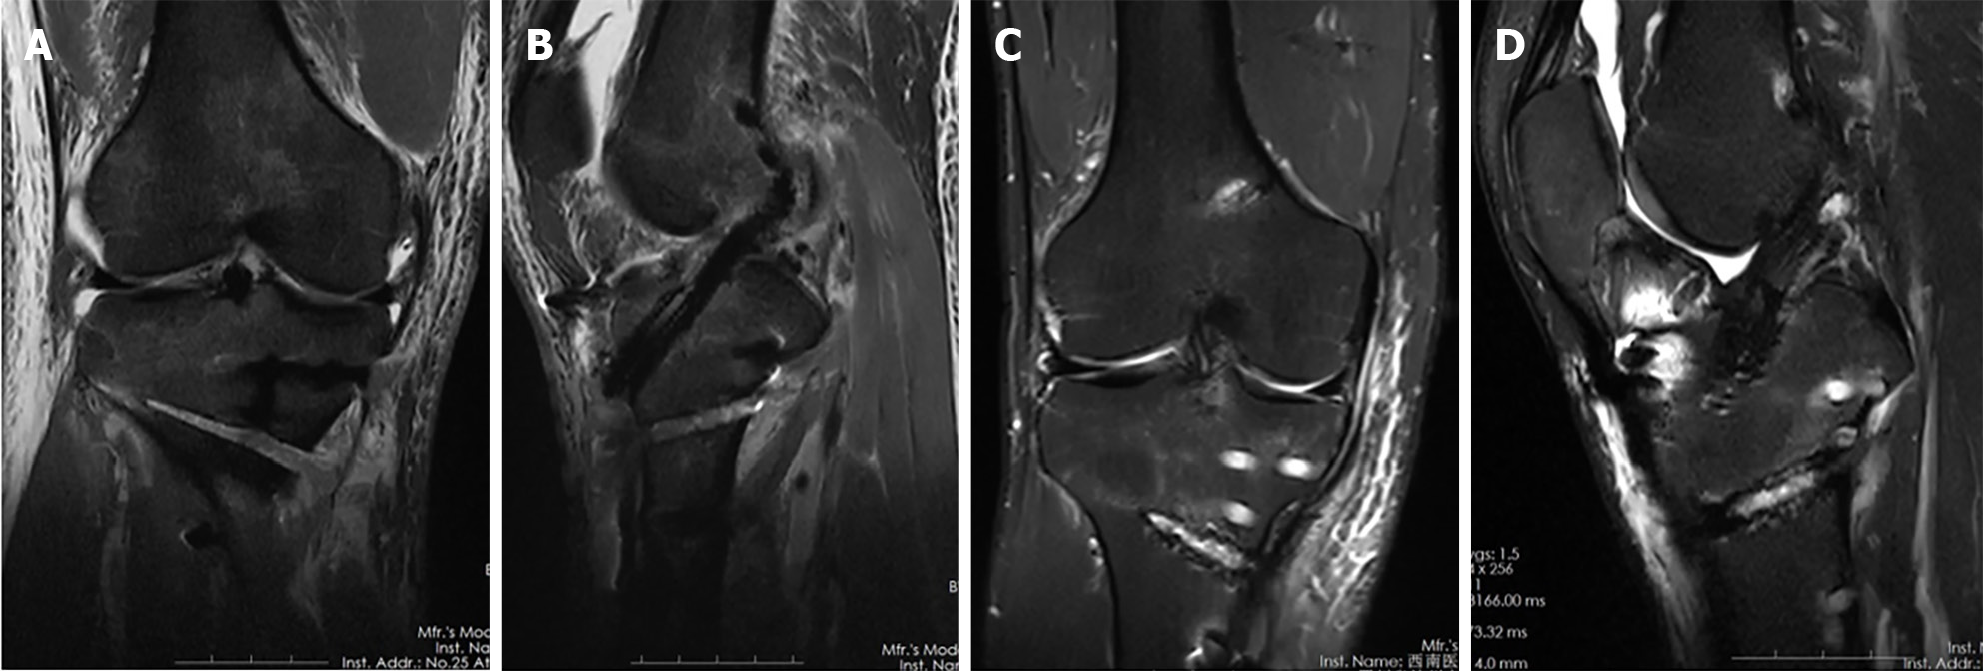
Figure 5 Postoperative images.
A and B: Three days after surgery, magnetic resonance imaging (MRI) showed ligament continuity recovery; C and D: At the last follow-up, MRI showed that the ligament was stable with no rupture or failure of the anterior cruciate ligament.
Figure 6 Preoperative and postoperative appearance.
A and B: Preoperative appearance suggested varus deformity of the knee; C-F: At the last follow-up, the knee varus deformity was corrected and knee function recovered well.
- Citation: Deng FY, Liu JC, Li Z. Osteotomy combined with anterior cruciate ligament reconstruction for anterior cruciate ligament injury and biplanar deformity. World J Clin Cases 2024; 12(22): 4897-4904
- URL: https://www.wjgnet.com/2307-8960/full/v12/i22/4897.htm
- DOI: https://dx.doi.org/10.12998/wjcc.v12.i22.4897


