Copyright
©The Author(s) 2024.
World J Clin Cases. Jul 26, 2024; 12(21): 4703-4716
Published online Jul 26, 2024. doi: 10.12998/wjcc.v12.i21.4703
Published online Jul 26, 2024. doi: 10.12998/wjcc.v12.i21.4703
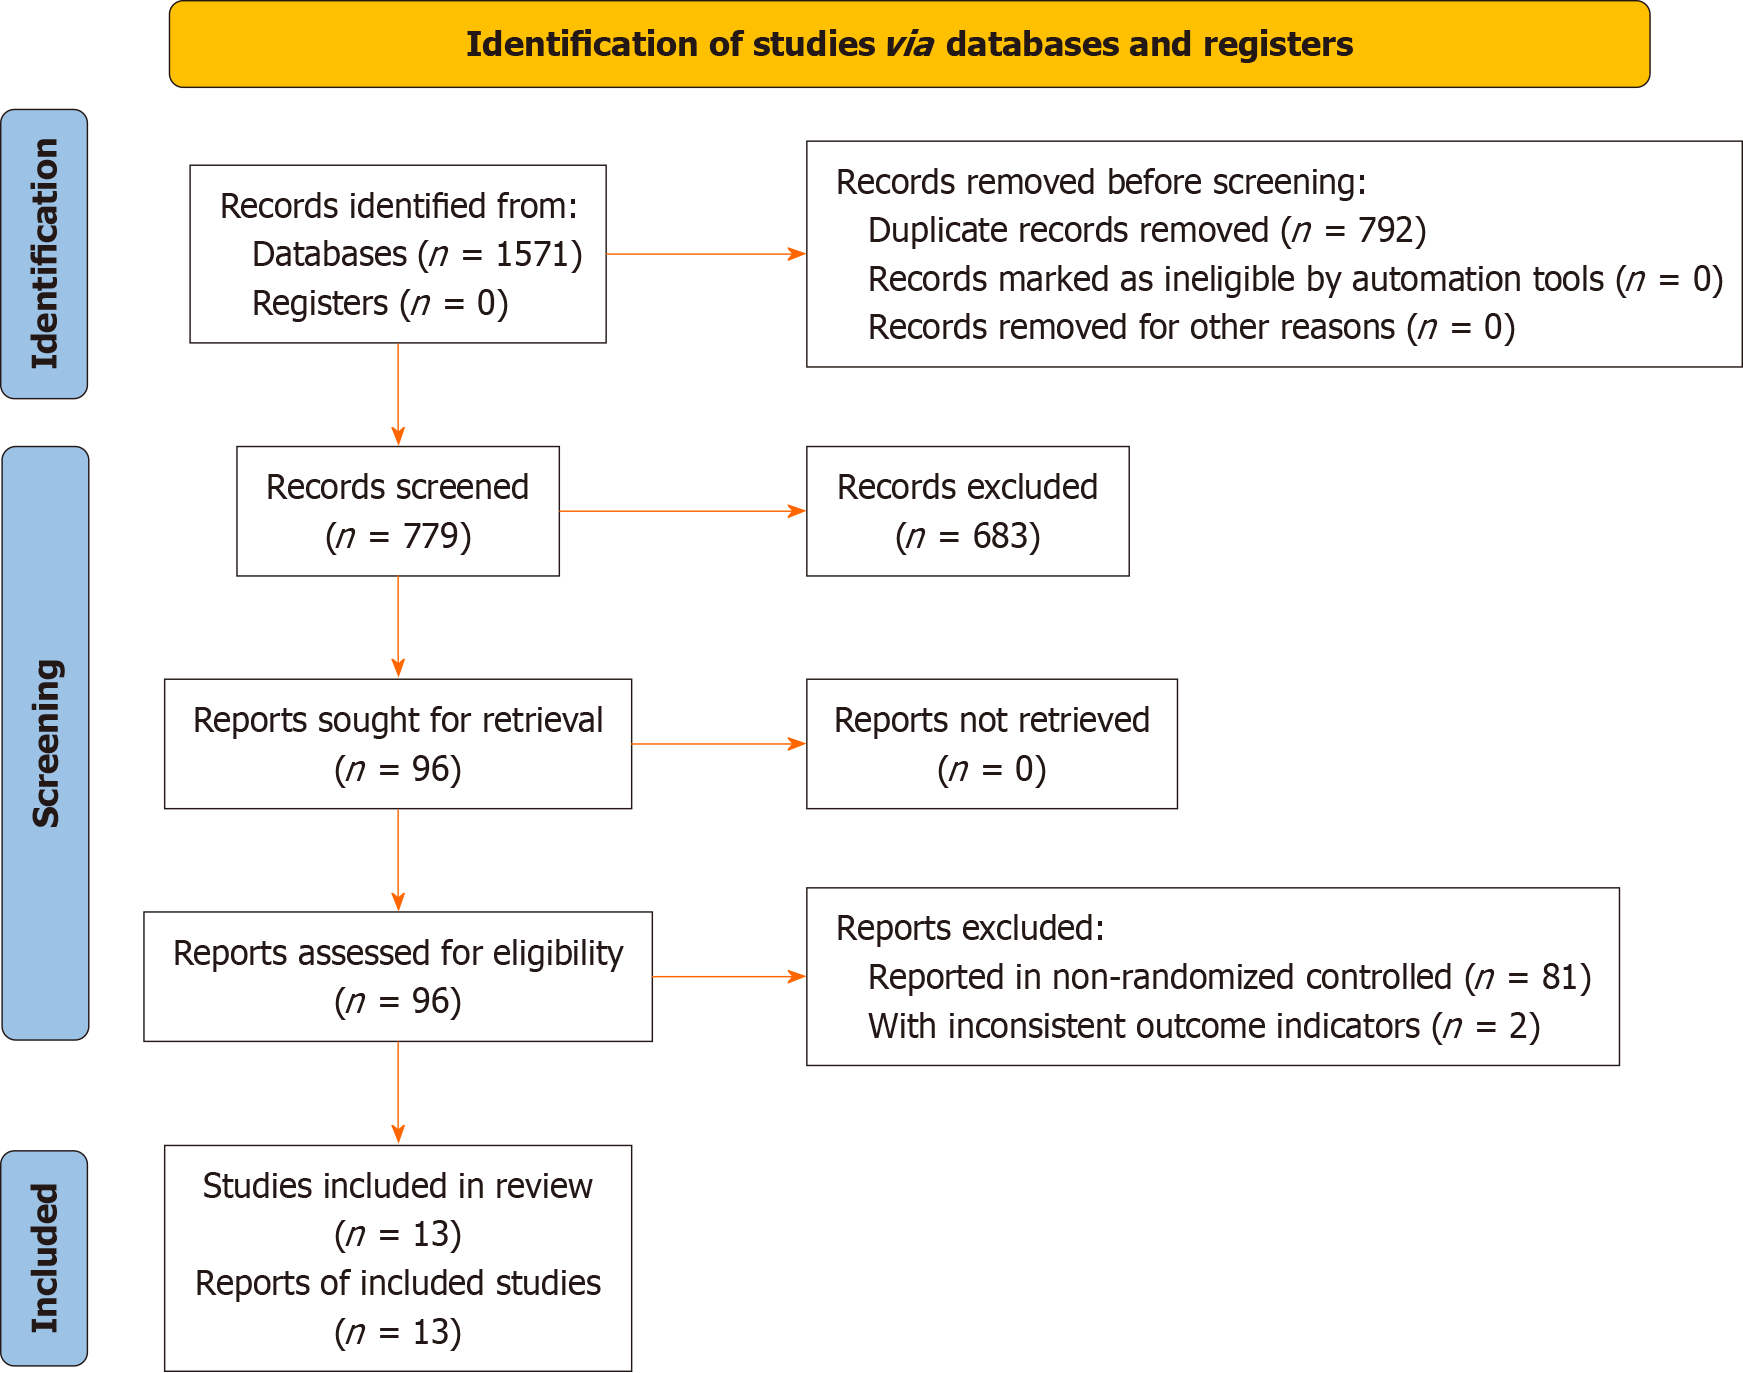
Figure 1 Literature screening flowchart.
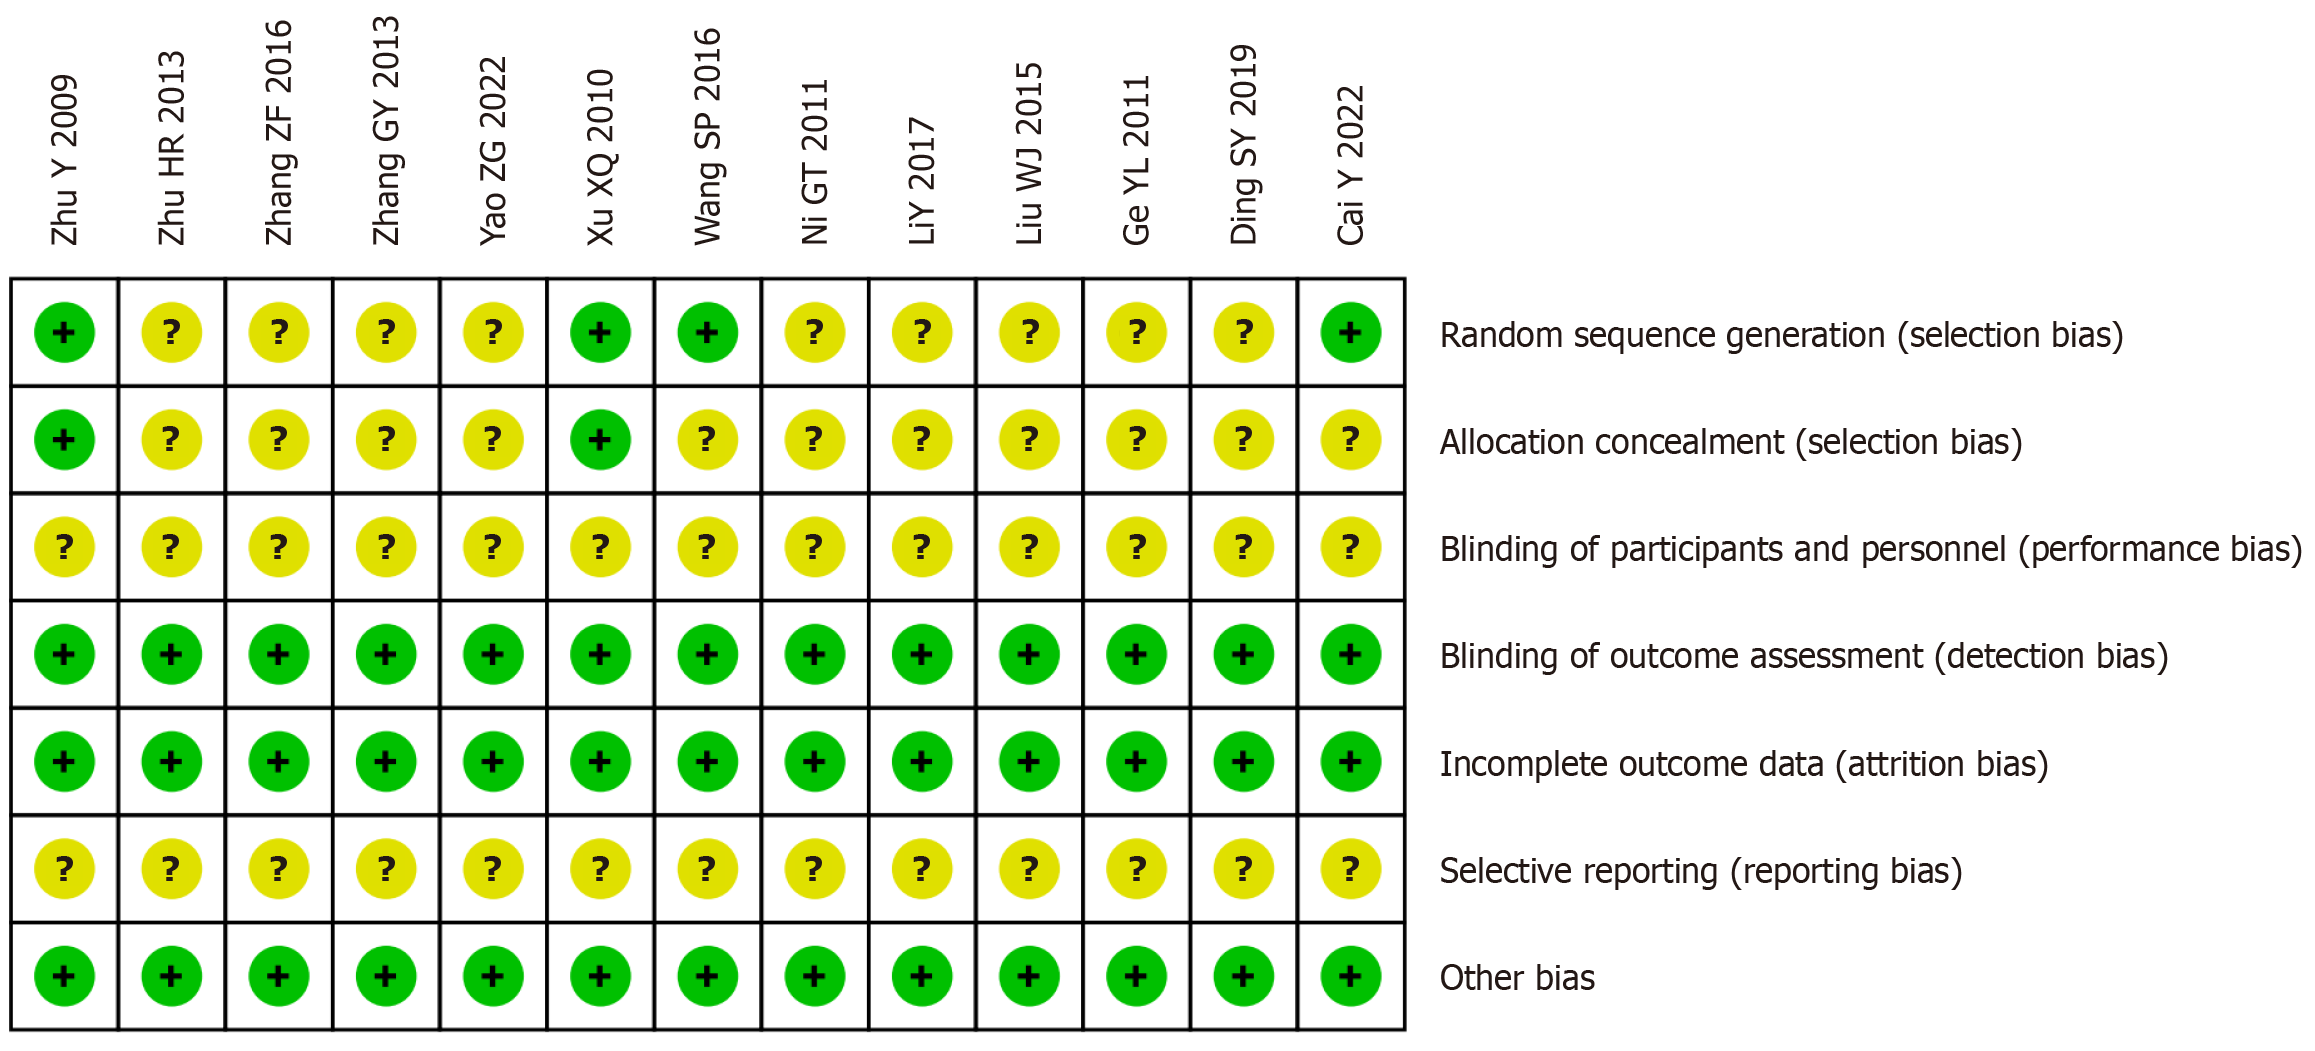
Figure 2 Risk of bias summary.
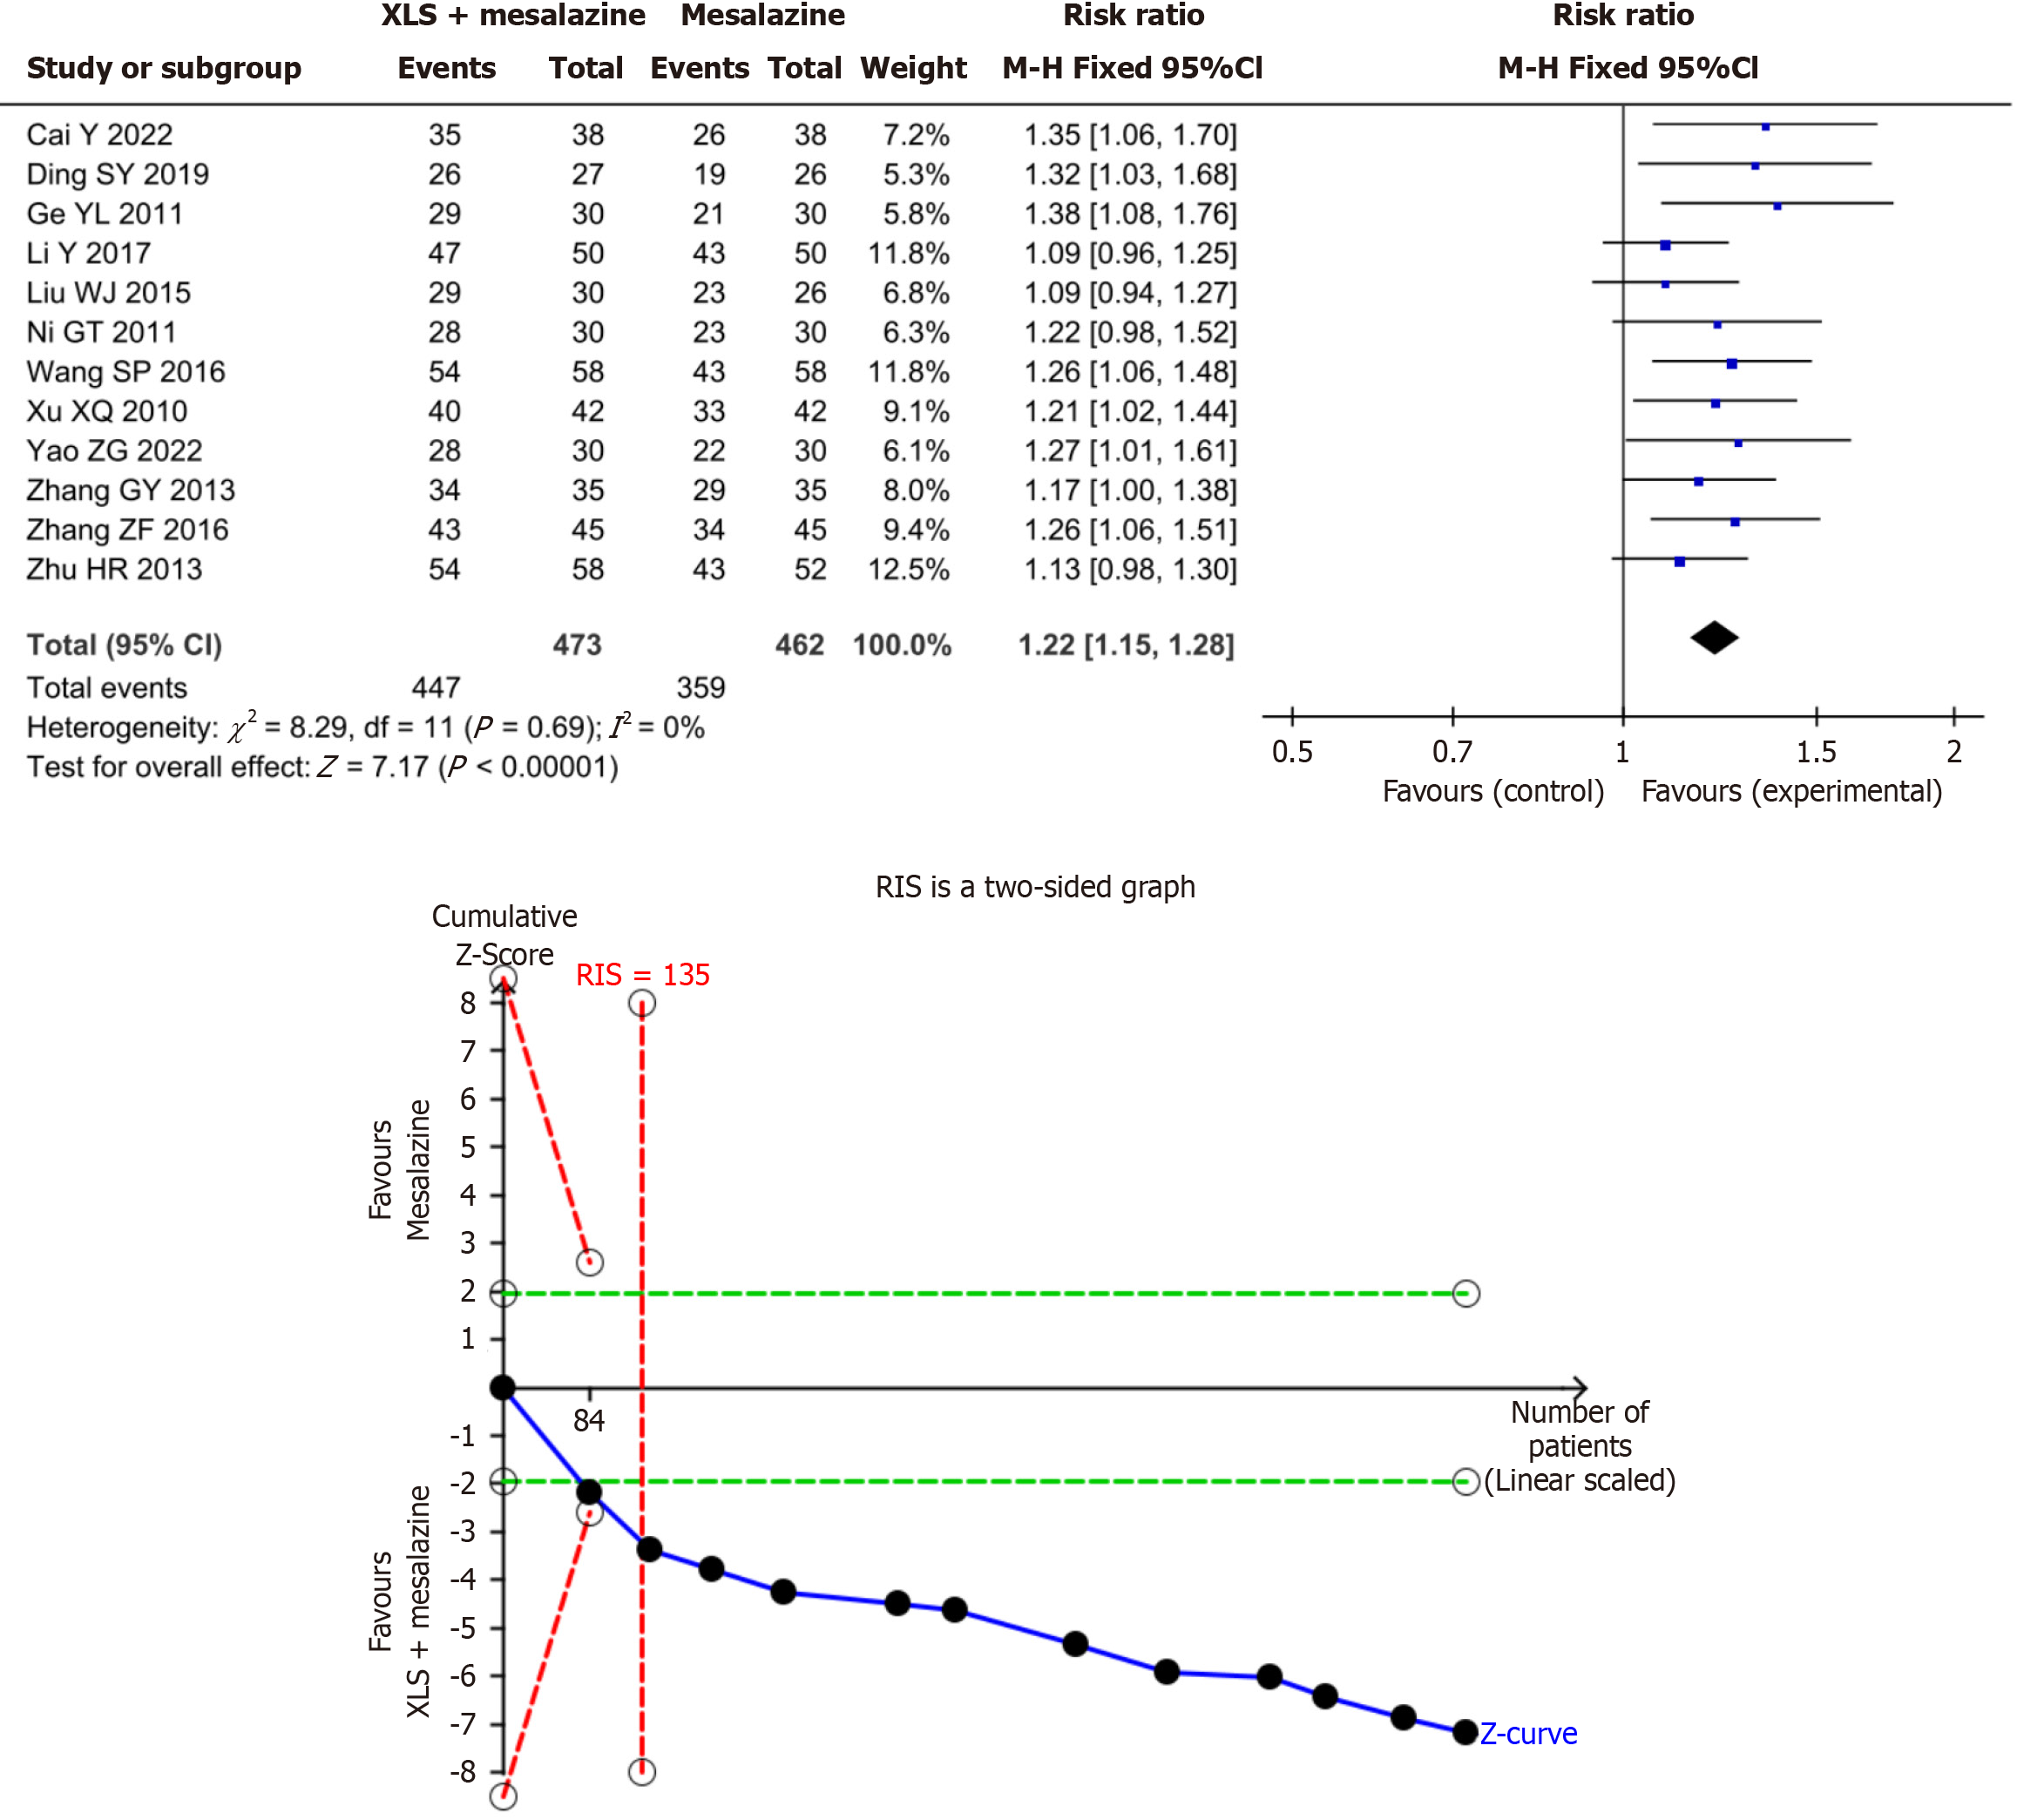
Figure 3 The results of meta-analysis and trial sequential analysis for clinical efficacy rate.
The Z-value curve crossed the boundary value in the second study, indicating that the meta-analysis results of clinical efficacy rate are conclusive. M-H: Mantel-Haenszel; RIS: Required information size.
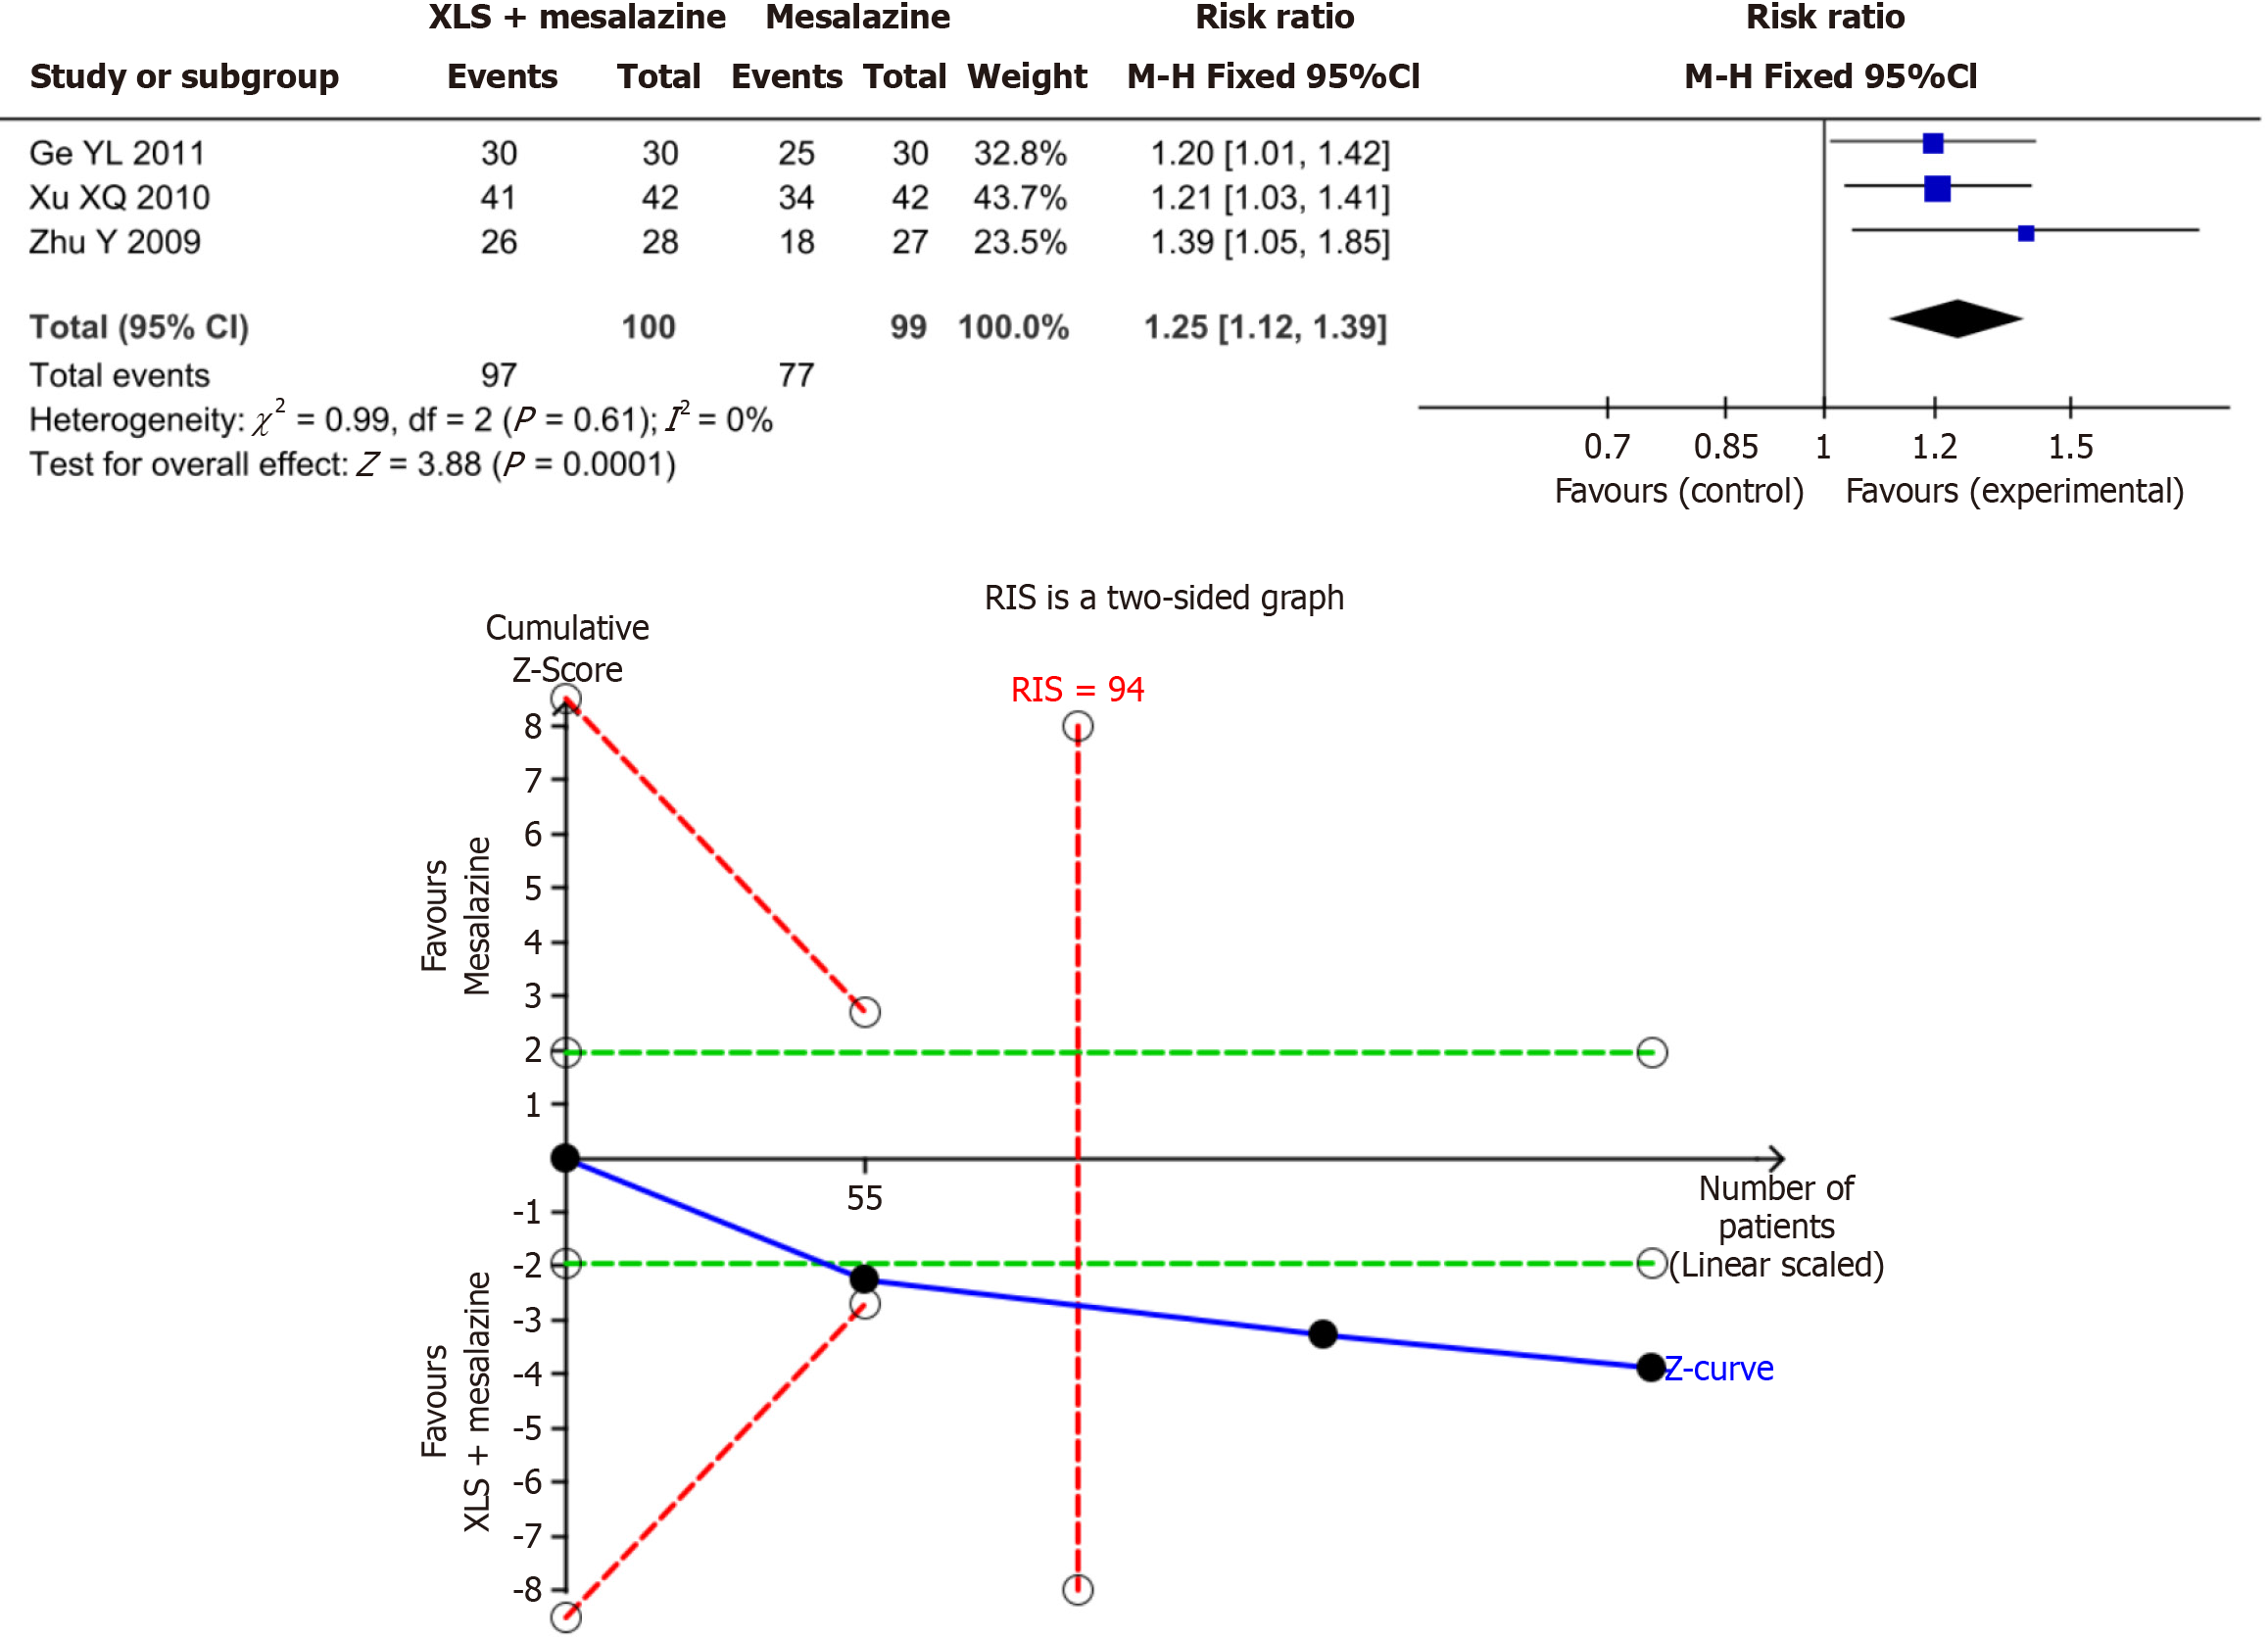
Figure 4 The results of meta-analysis and trial sequential analysis for mucosal improvement rate.
The Z-value curve crossed the boundary value in the second study, indicating that the meta-analysis results of mucosal improvement rate are conclusive. M-H: Mantel-Haenszel; RIS: Required information size.
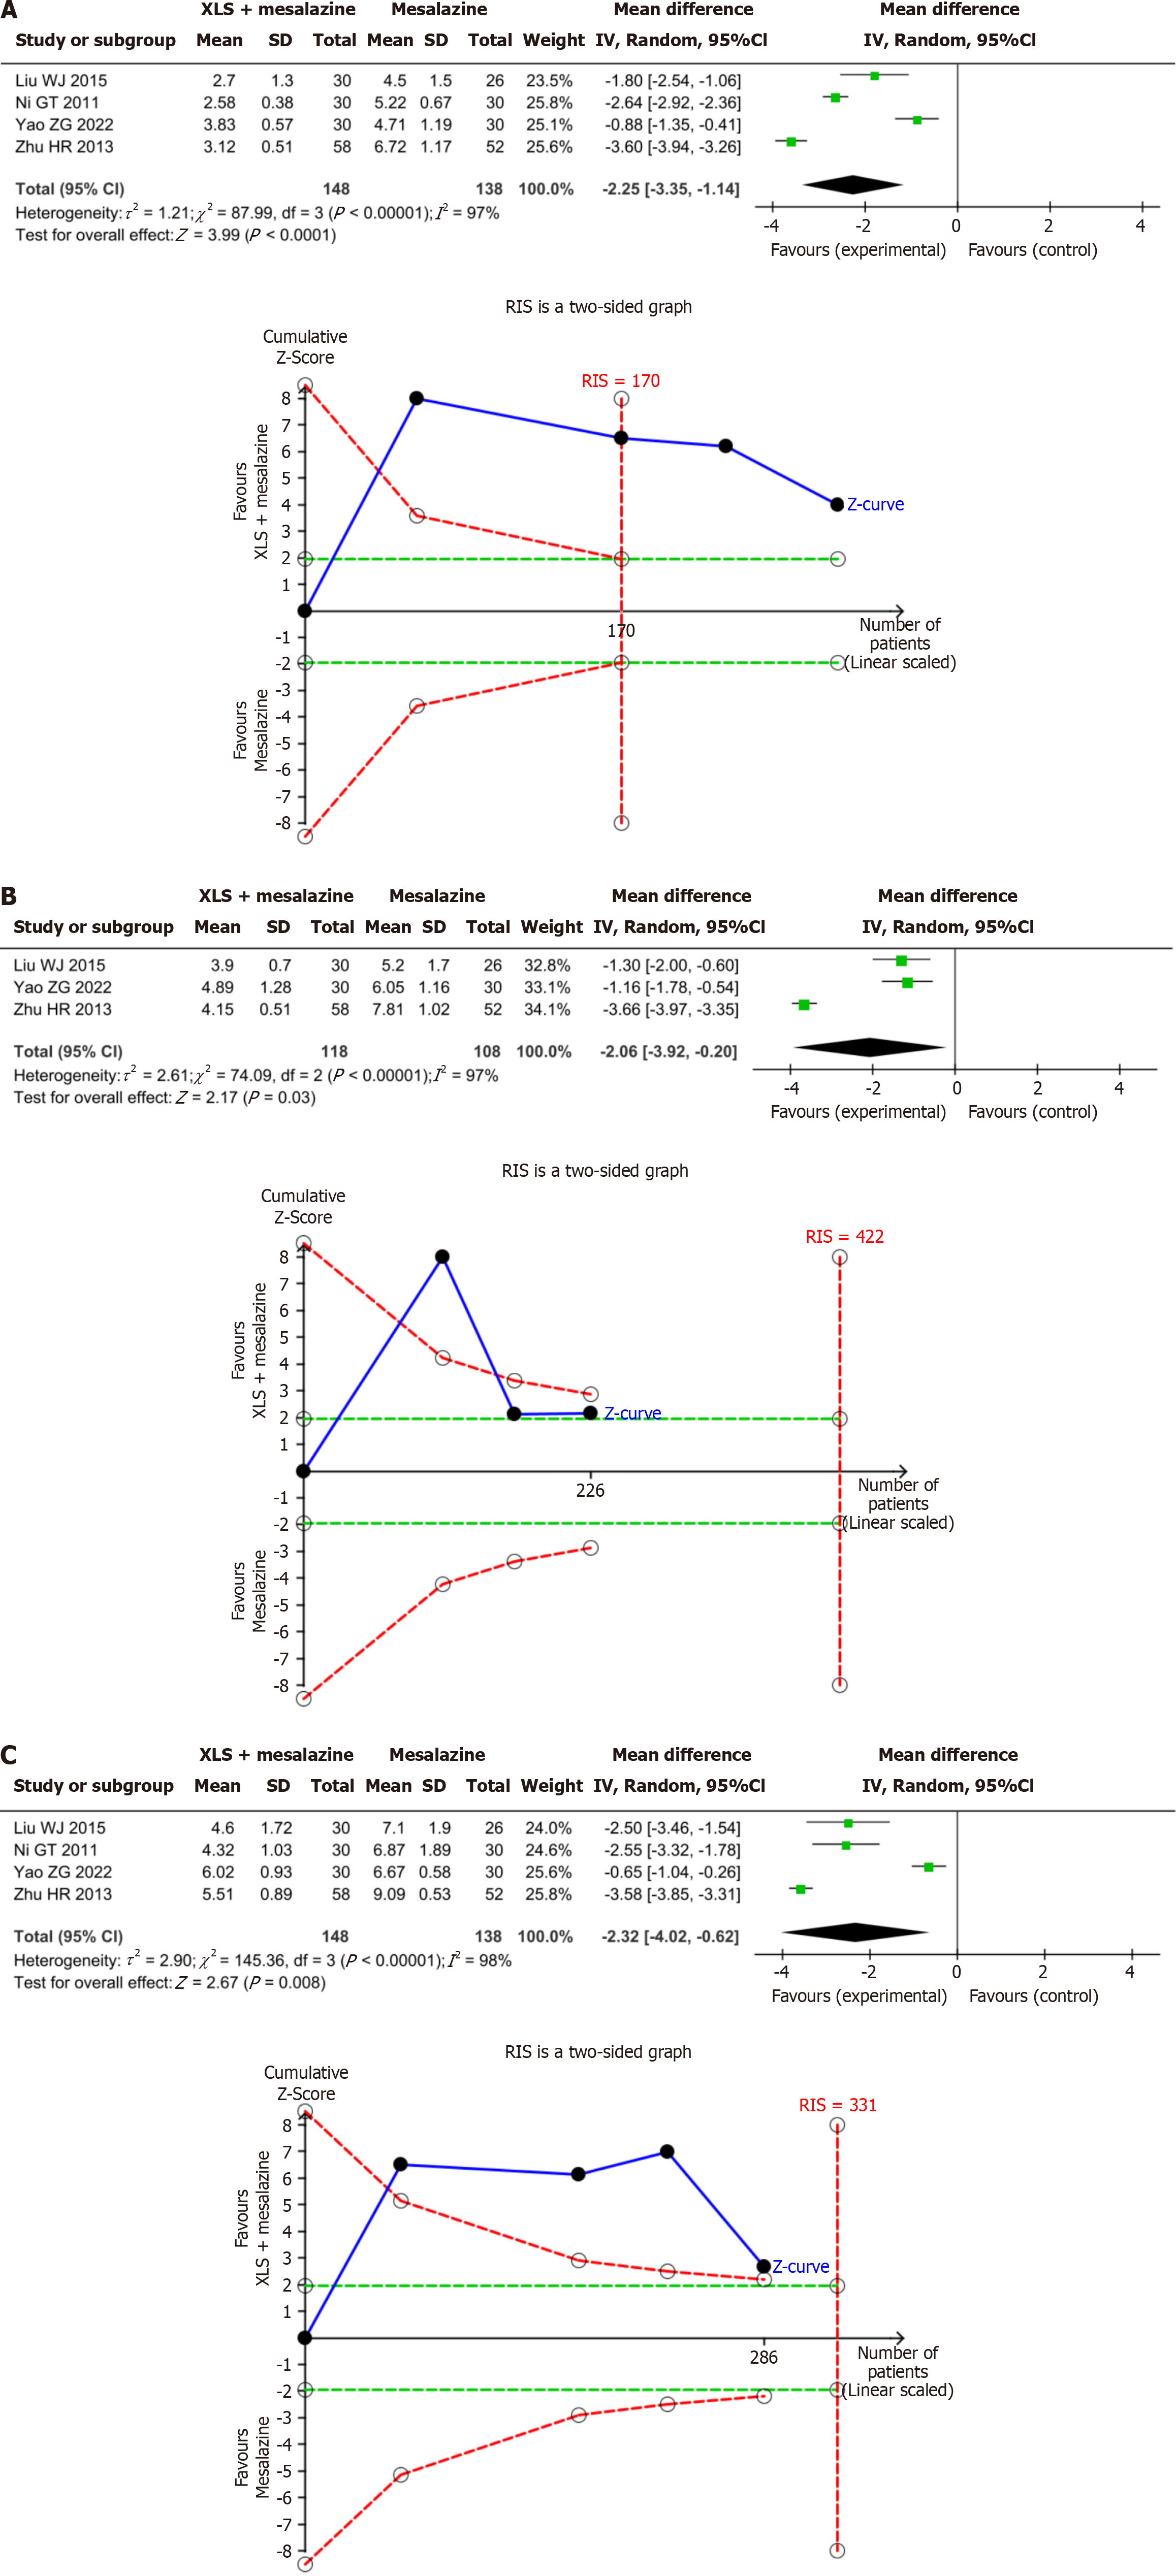
Figure 5 The results of meta-analysis and trial sequential analysis for duration of syndromes.
A: Duration of abdominal pain; B: Duration of diarrhea; C: Duration of hematochezia. The three Z-value curves all crossed the boundary value in the first study, indicating that the meta-analysis results of duration of abdominal pain, duration of diarrhea, and duration of hematochezia are conclusive. IV: Inverse variance; SD: Standard deviation; RIS: Required information size.
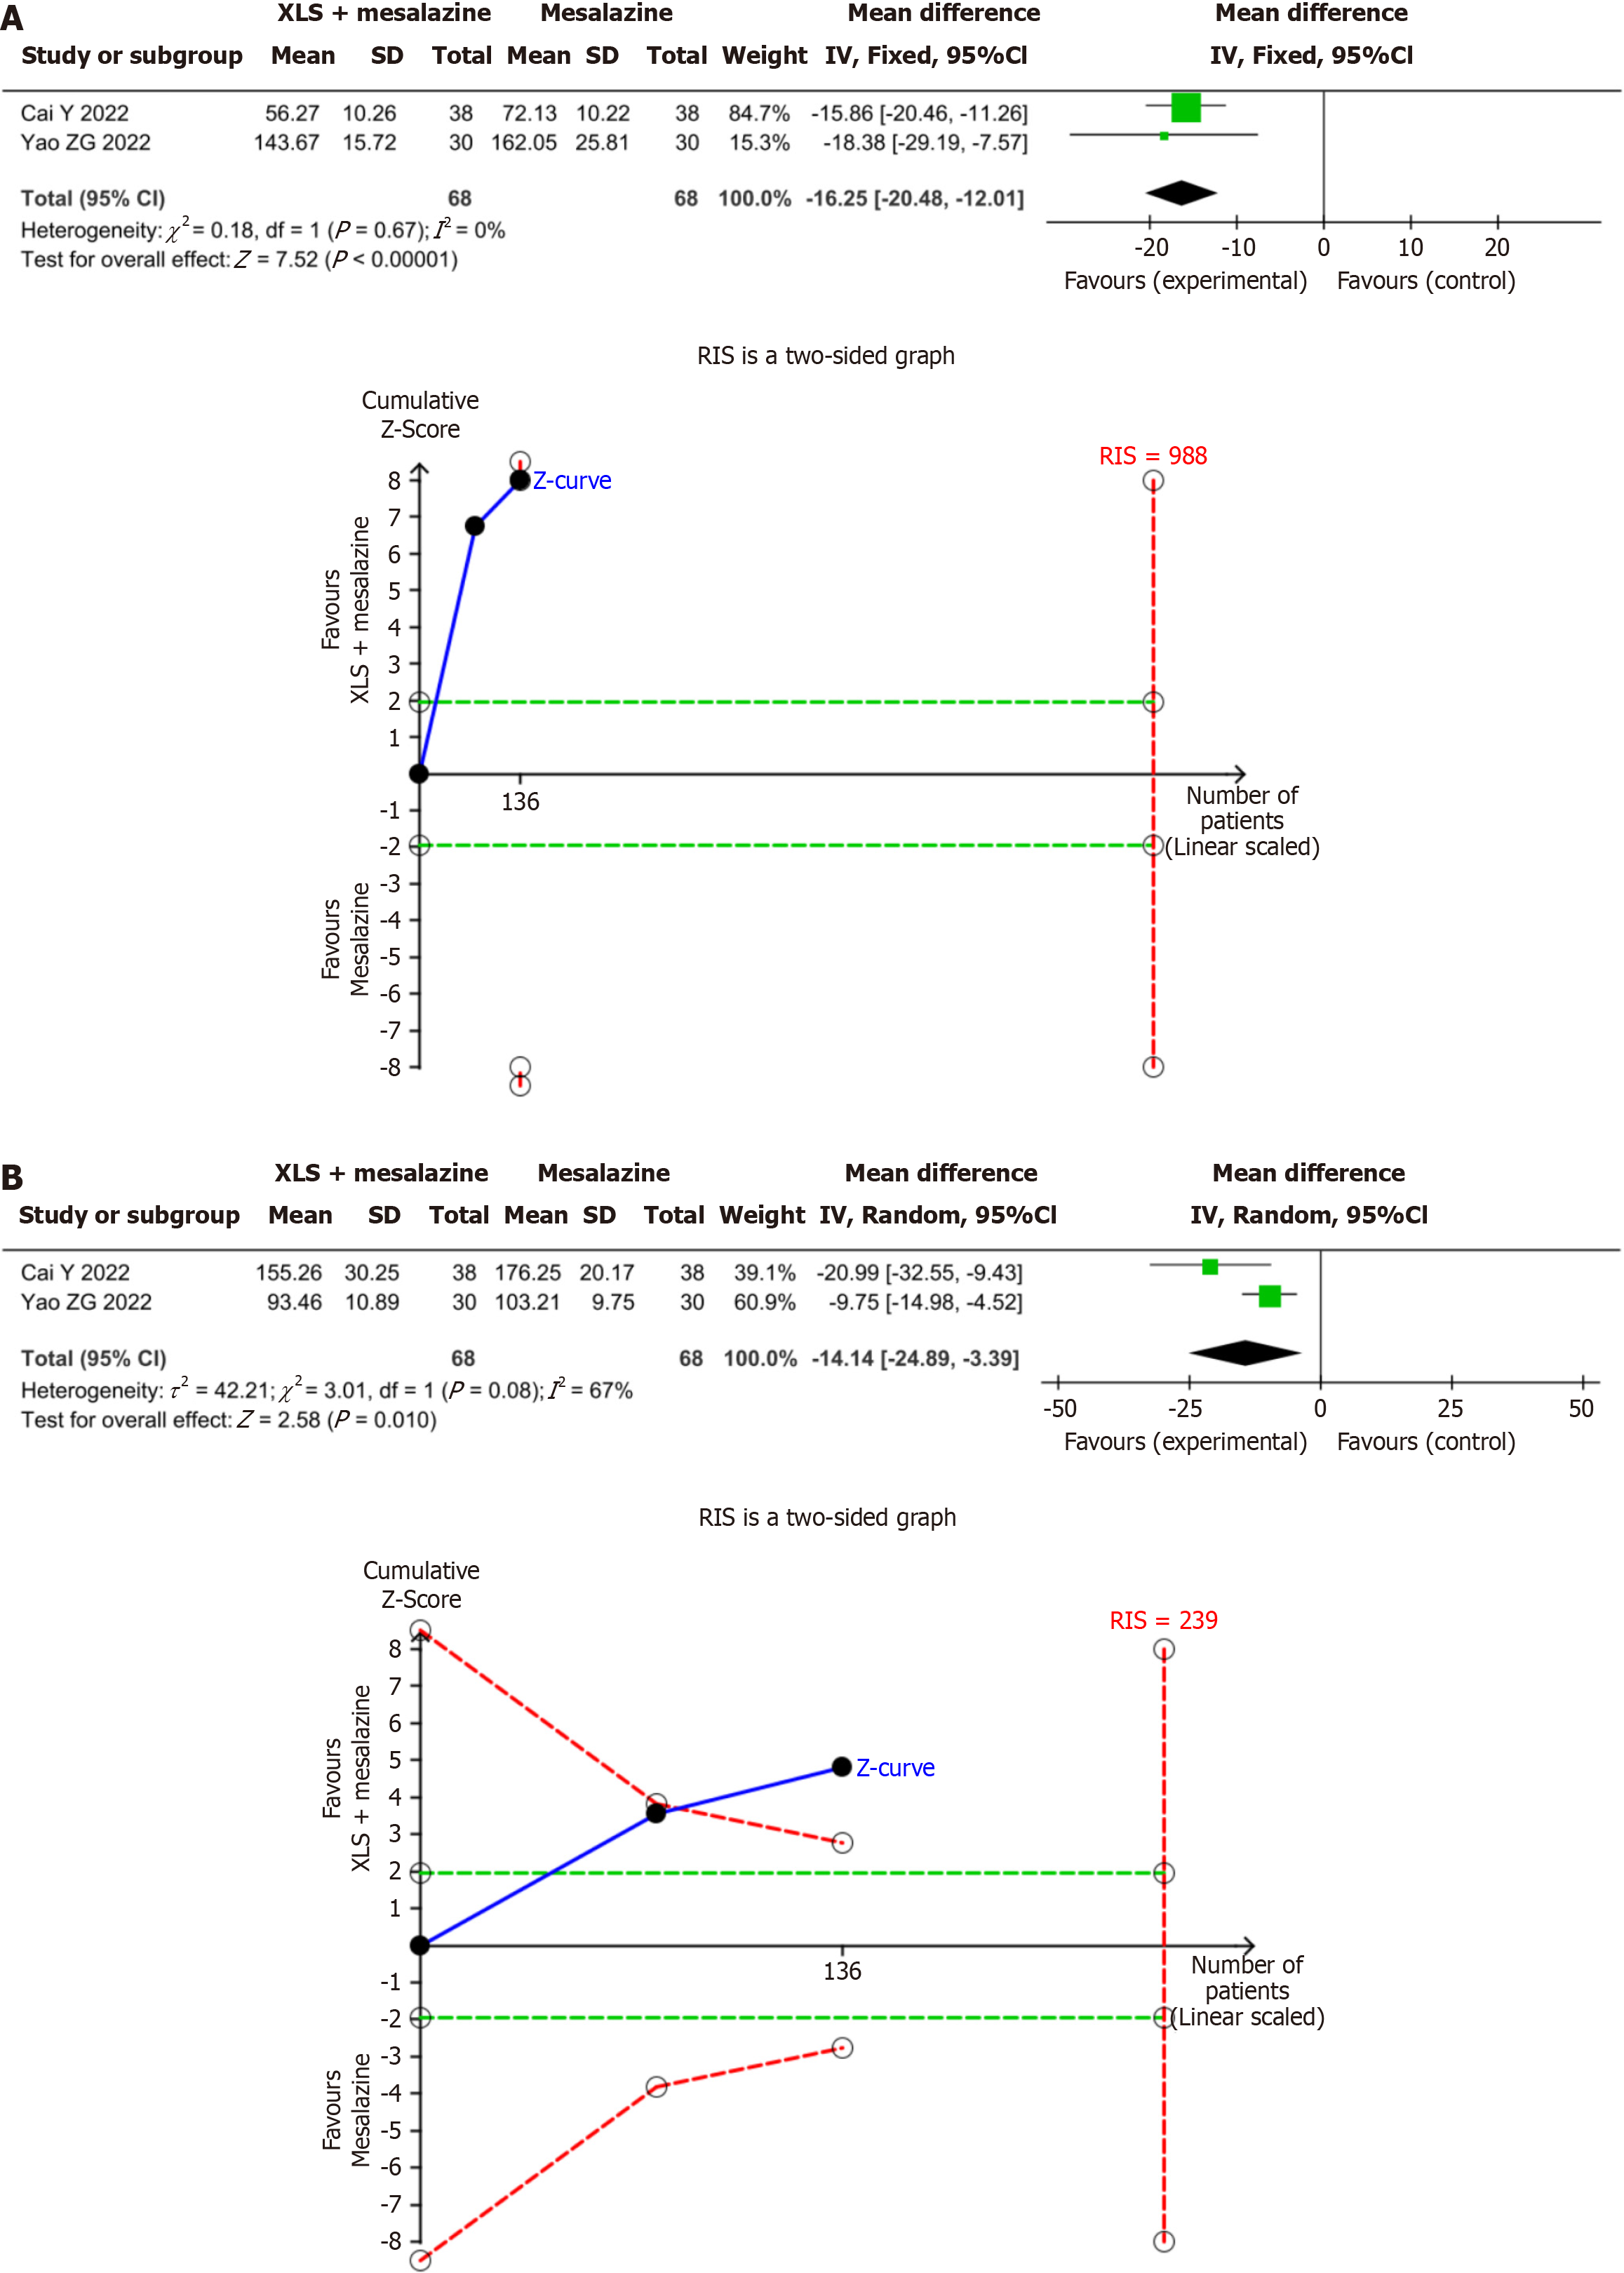
Figure 6 The results of meta-analysis and trial sequential analysis for inflammatory factors.
The two Z-value curves all crossed the boundary value in the second study, indicating that the meta-analysis results of tumor necrosis factor alpha (TNF-α), and interleukin (IL)-6 are conclusive. A: TNF-α; B: IL-6. IV: Inverse variance; SD: Standard deviation; RIS: Required information size.
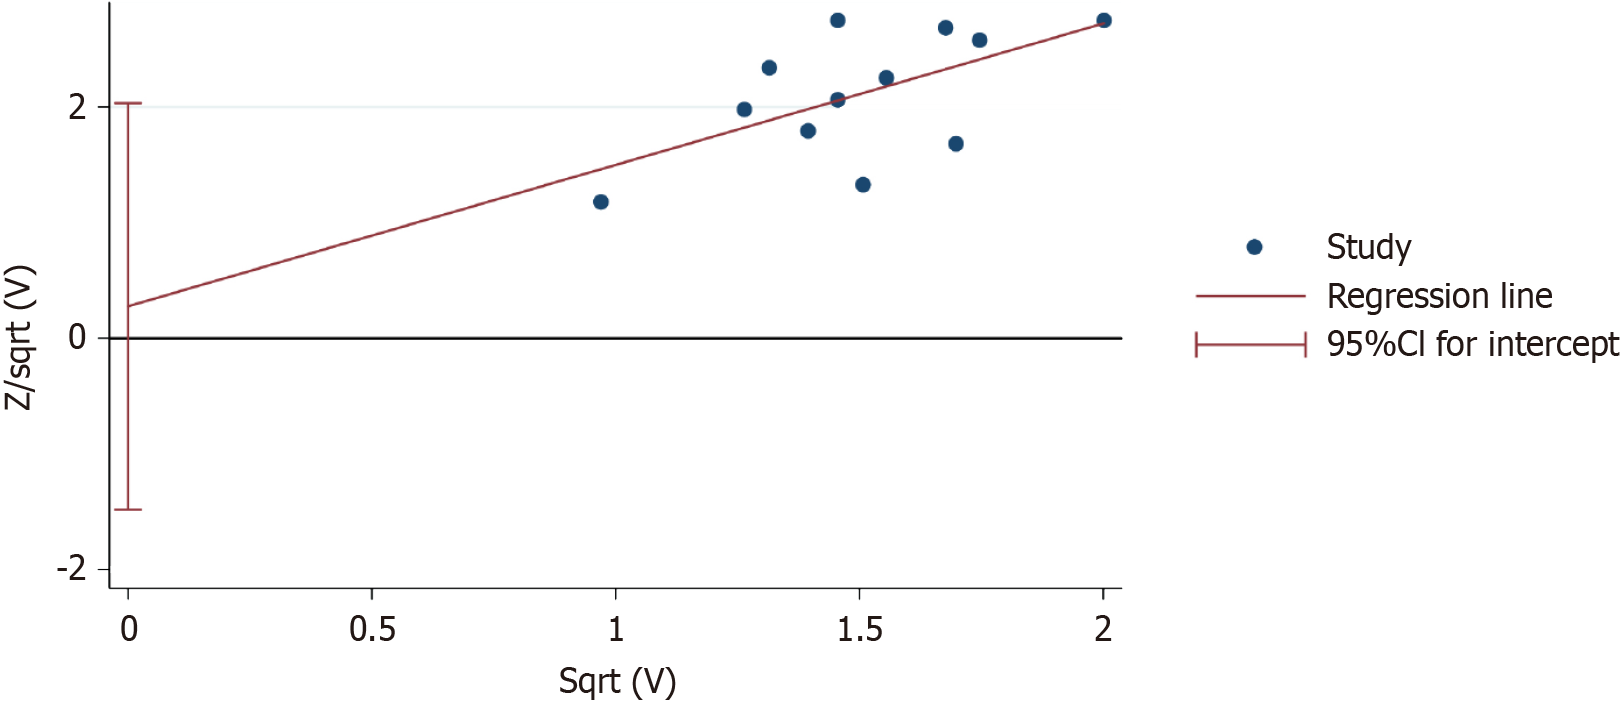
Figure 7 Publication bias assessment.
- Citation: Yang XY, Yu YF, Tong KK, Hu G, Yu R, Su LJ. Efficacy and safety of Xileisan combined with mesalazine for ulcerative colitis: A meta-analysis and trial sequential analysis. World J Clin Cases 2024; 12(21): 4703-4716
- URL: https://www.wjgnet.com/2307-8960/full/v12/i21/4703.htm
- DOI: https://dx.doi.org/10.12998/wjcc.v12.i21.4703


