Copyright
©The Author(s) 2024.
World J Clin Cases. Jul 26, 2024; 12(21): 4661-4672
Published online Jul 26, 2024. doi: 10.12998/wjcc.v12.i21.4661
Published online Jul 26, 2024. doi: 10.12998/wjcc.v12.i21.4661
Figure 1 Flowchart of participant selection.
NHANES: National Health and Nutrition Examination Survey; HF: Heart failure; PHQ-9: Patient Health Questionnaire-9.
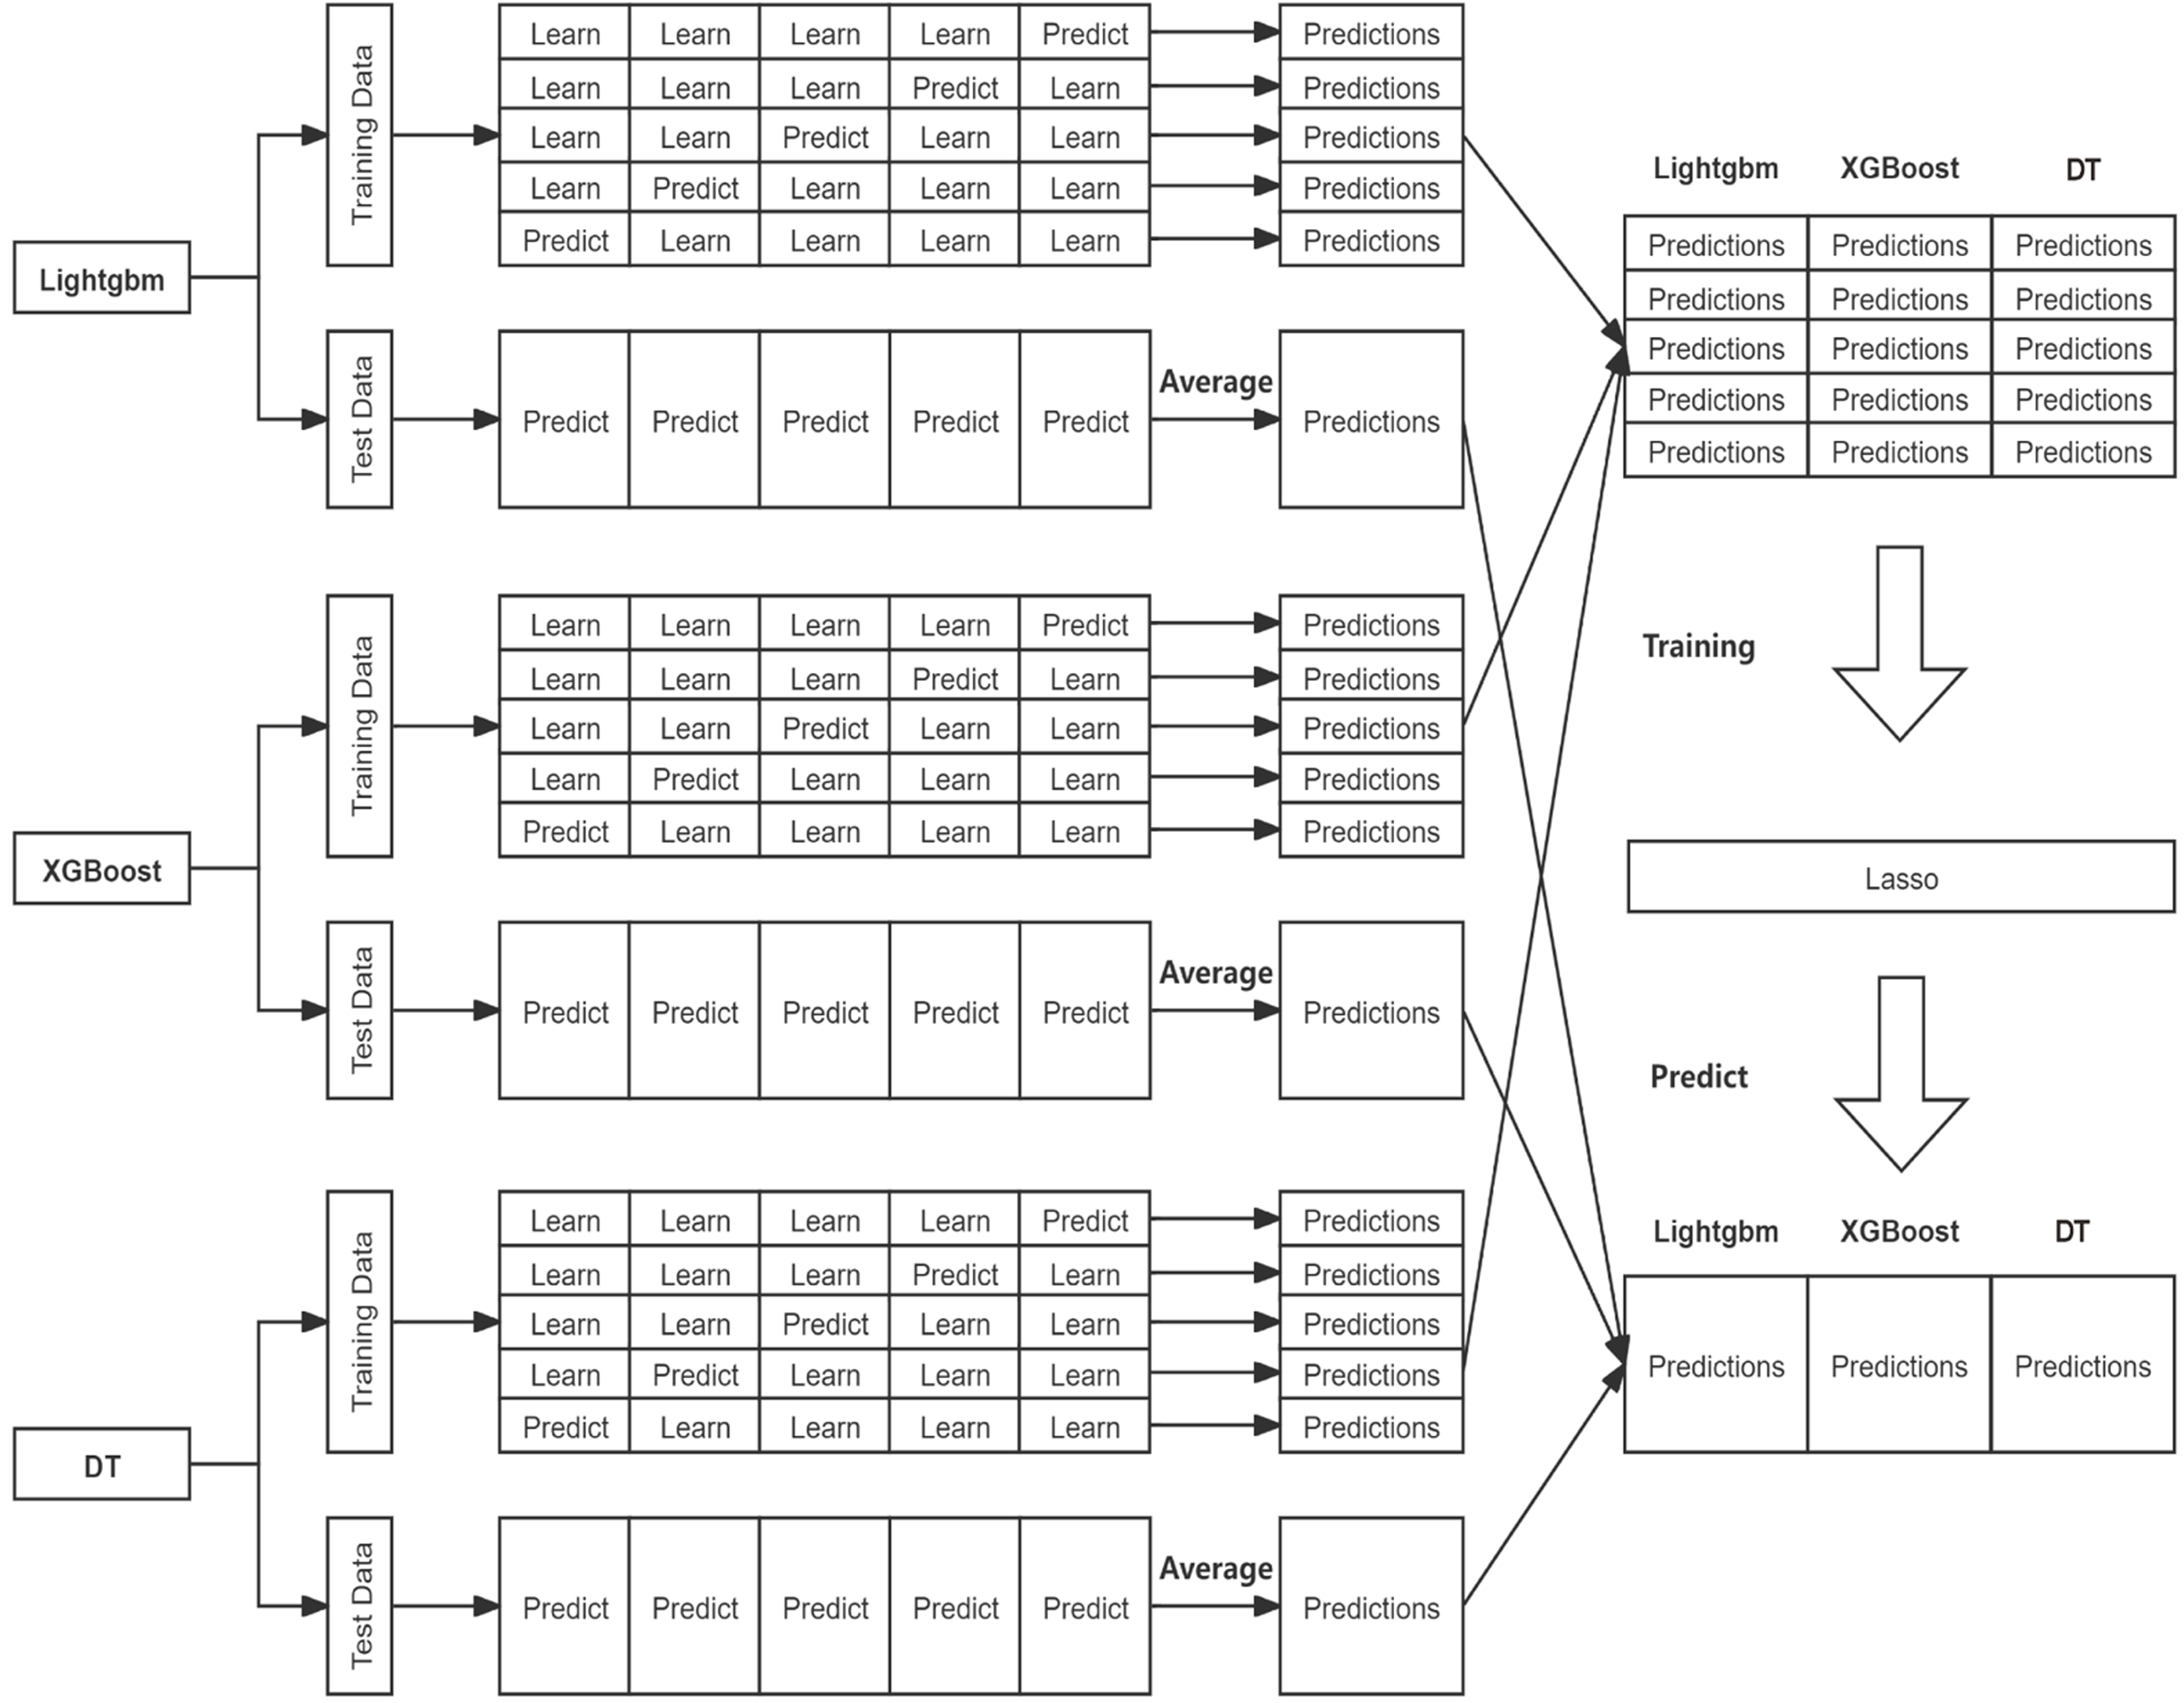
Figure 2 Stacking model framework structure diagram.
DT: Decision tree.
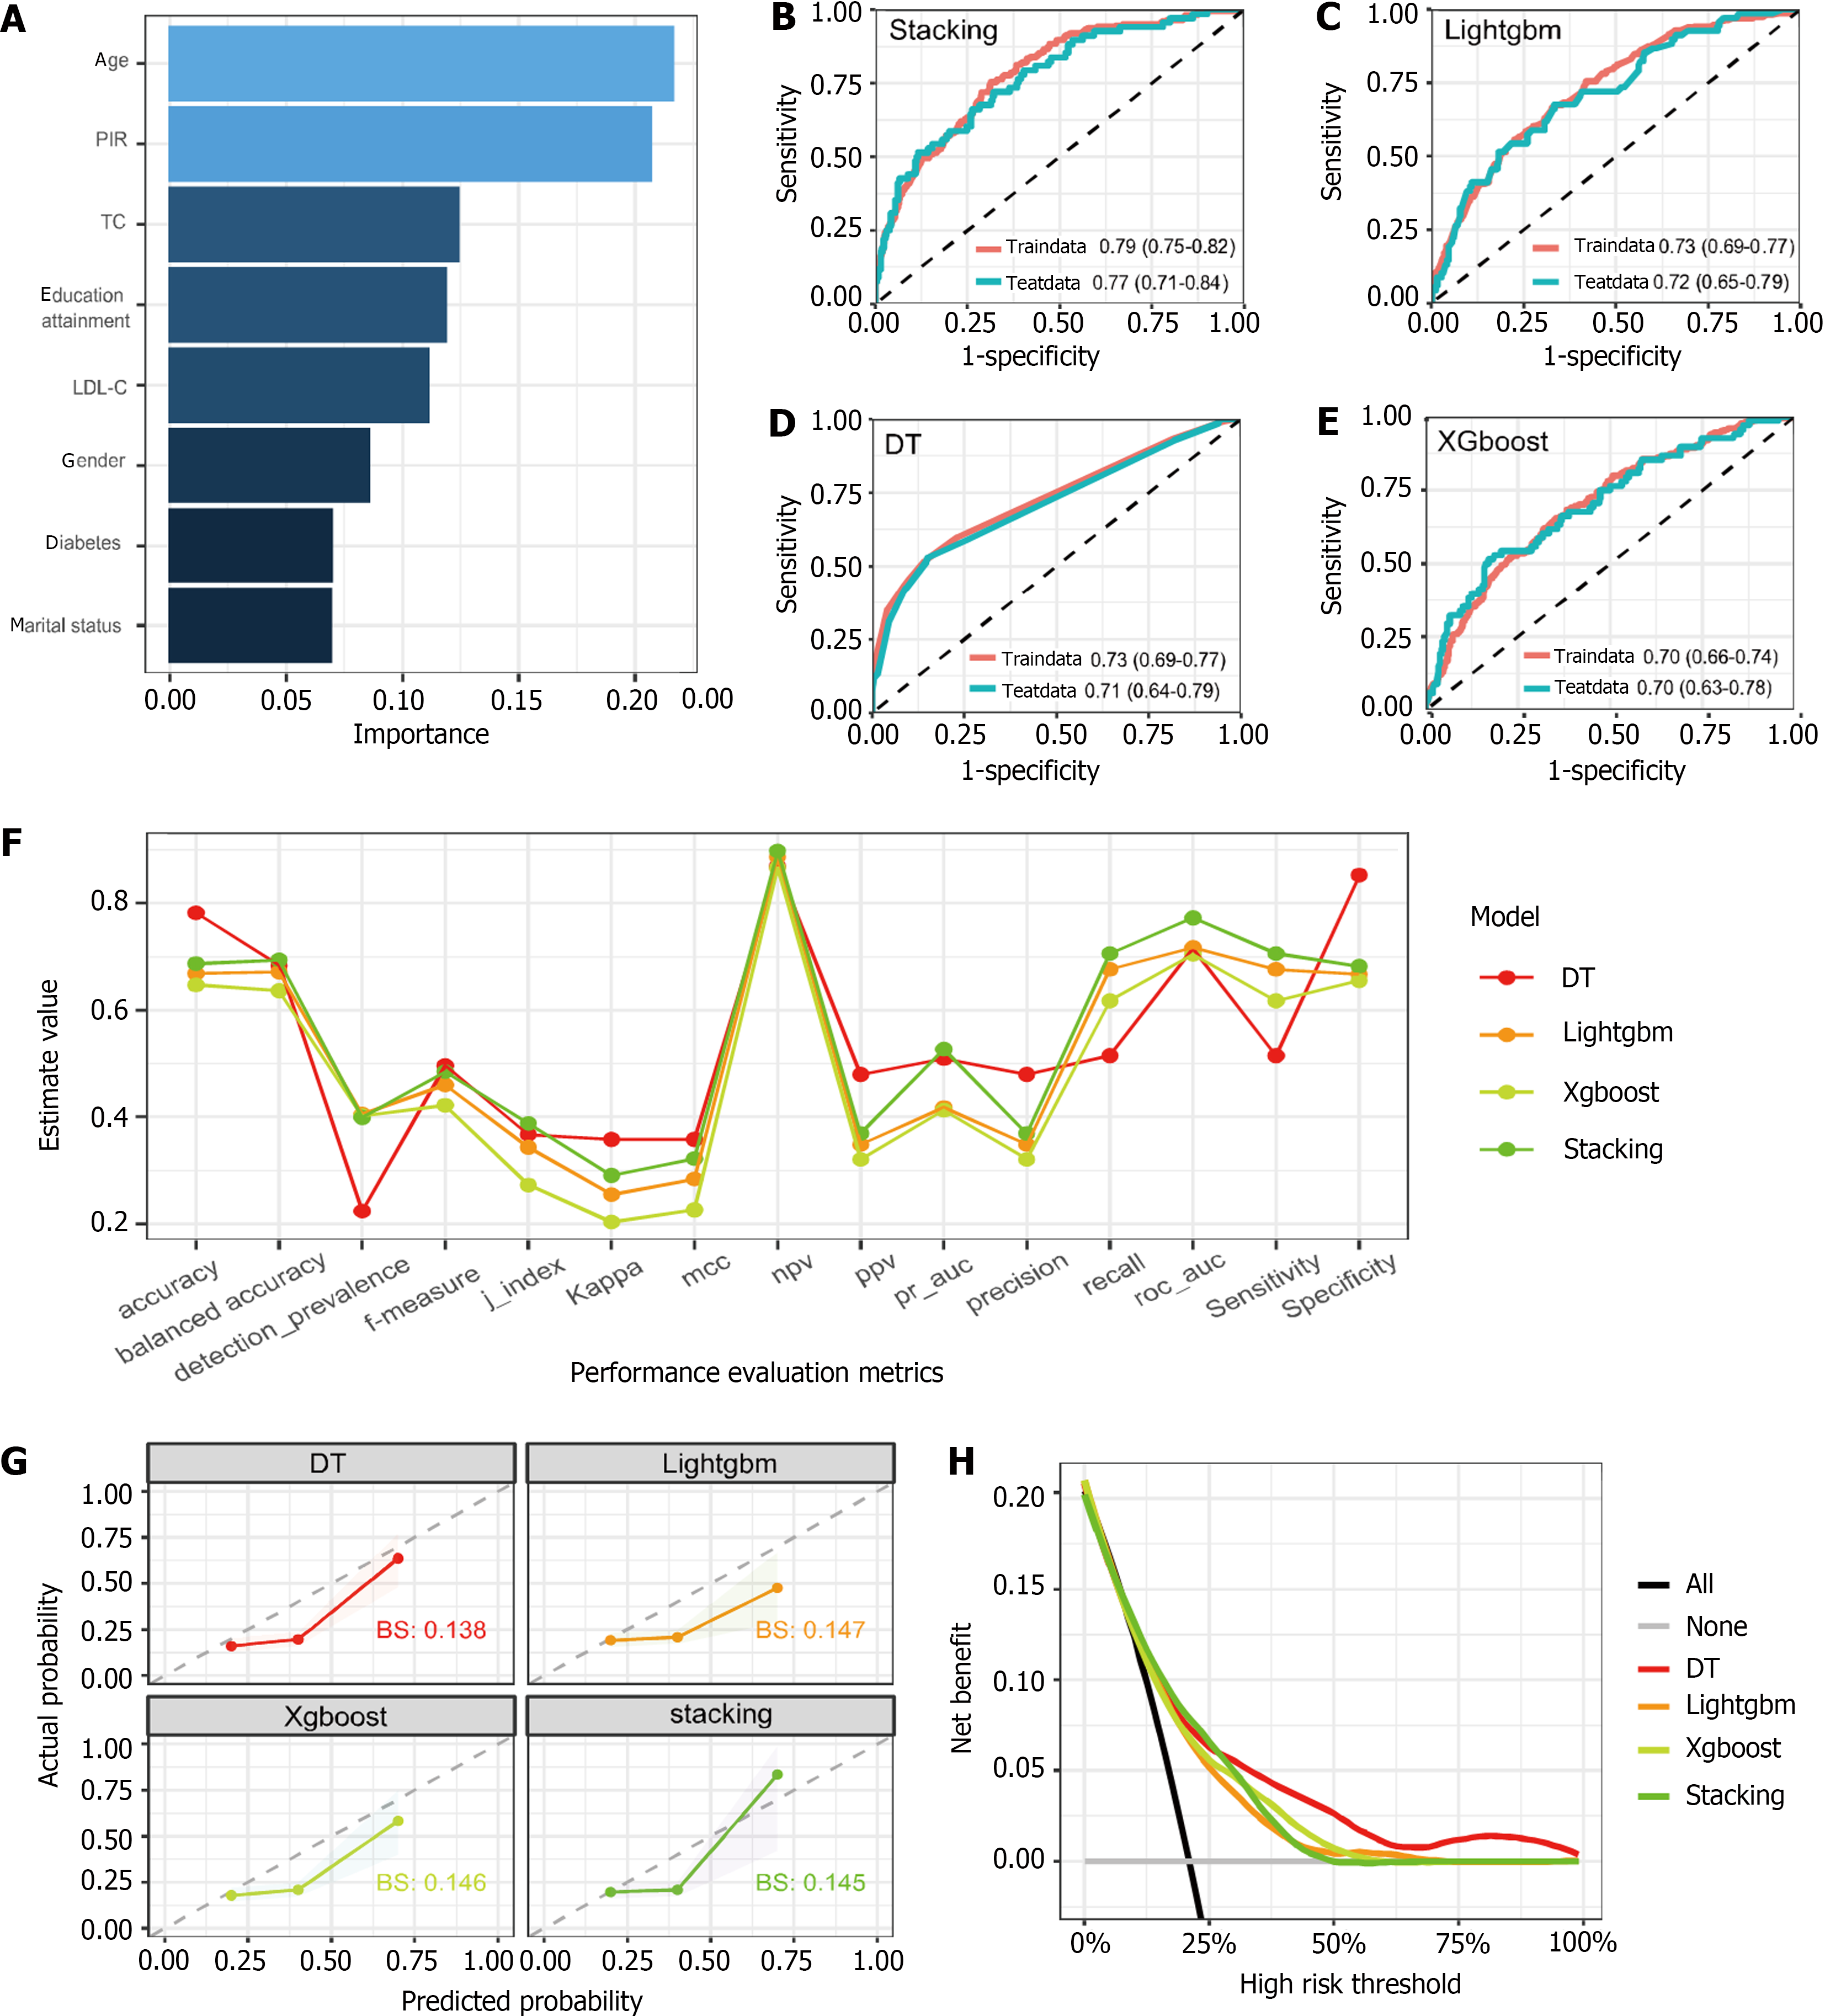
Figure 3 Feature screening and model performance evaluation.
A: Rankings of feature importance; B-E: Receiver operating characteristic curves of the four models for predicting depression among heart failure patients in the training dataset and test dataset; F: Performance evaluation of the four models in the test dataset; G: Calibration curves of the four models in the test dataset; H: The clinical utility of the four models was evaluated via decision curves in the test dataset. PIR: Poverty income ratio; TC: Total cholesterol; LDL-C: Low-density lipoprotein cholesterol; DT: Decision tree.
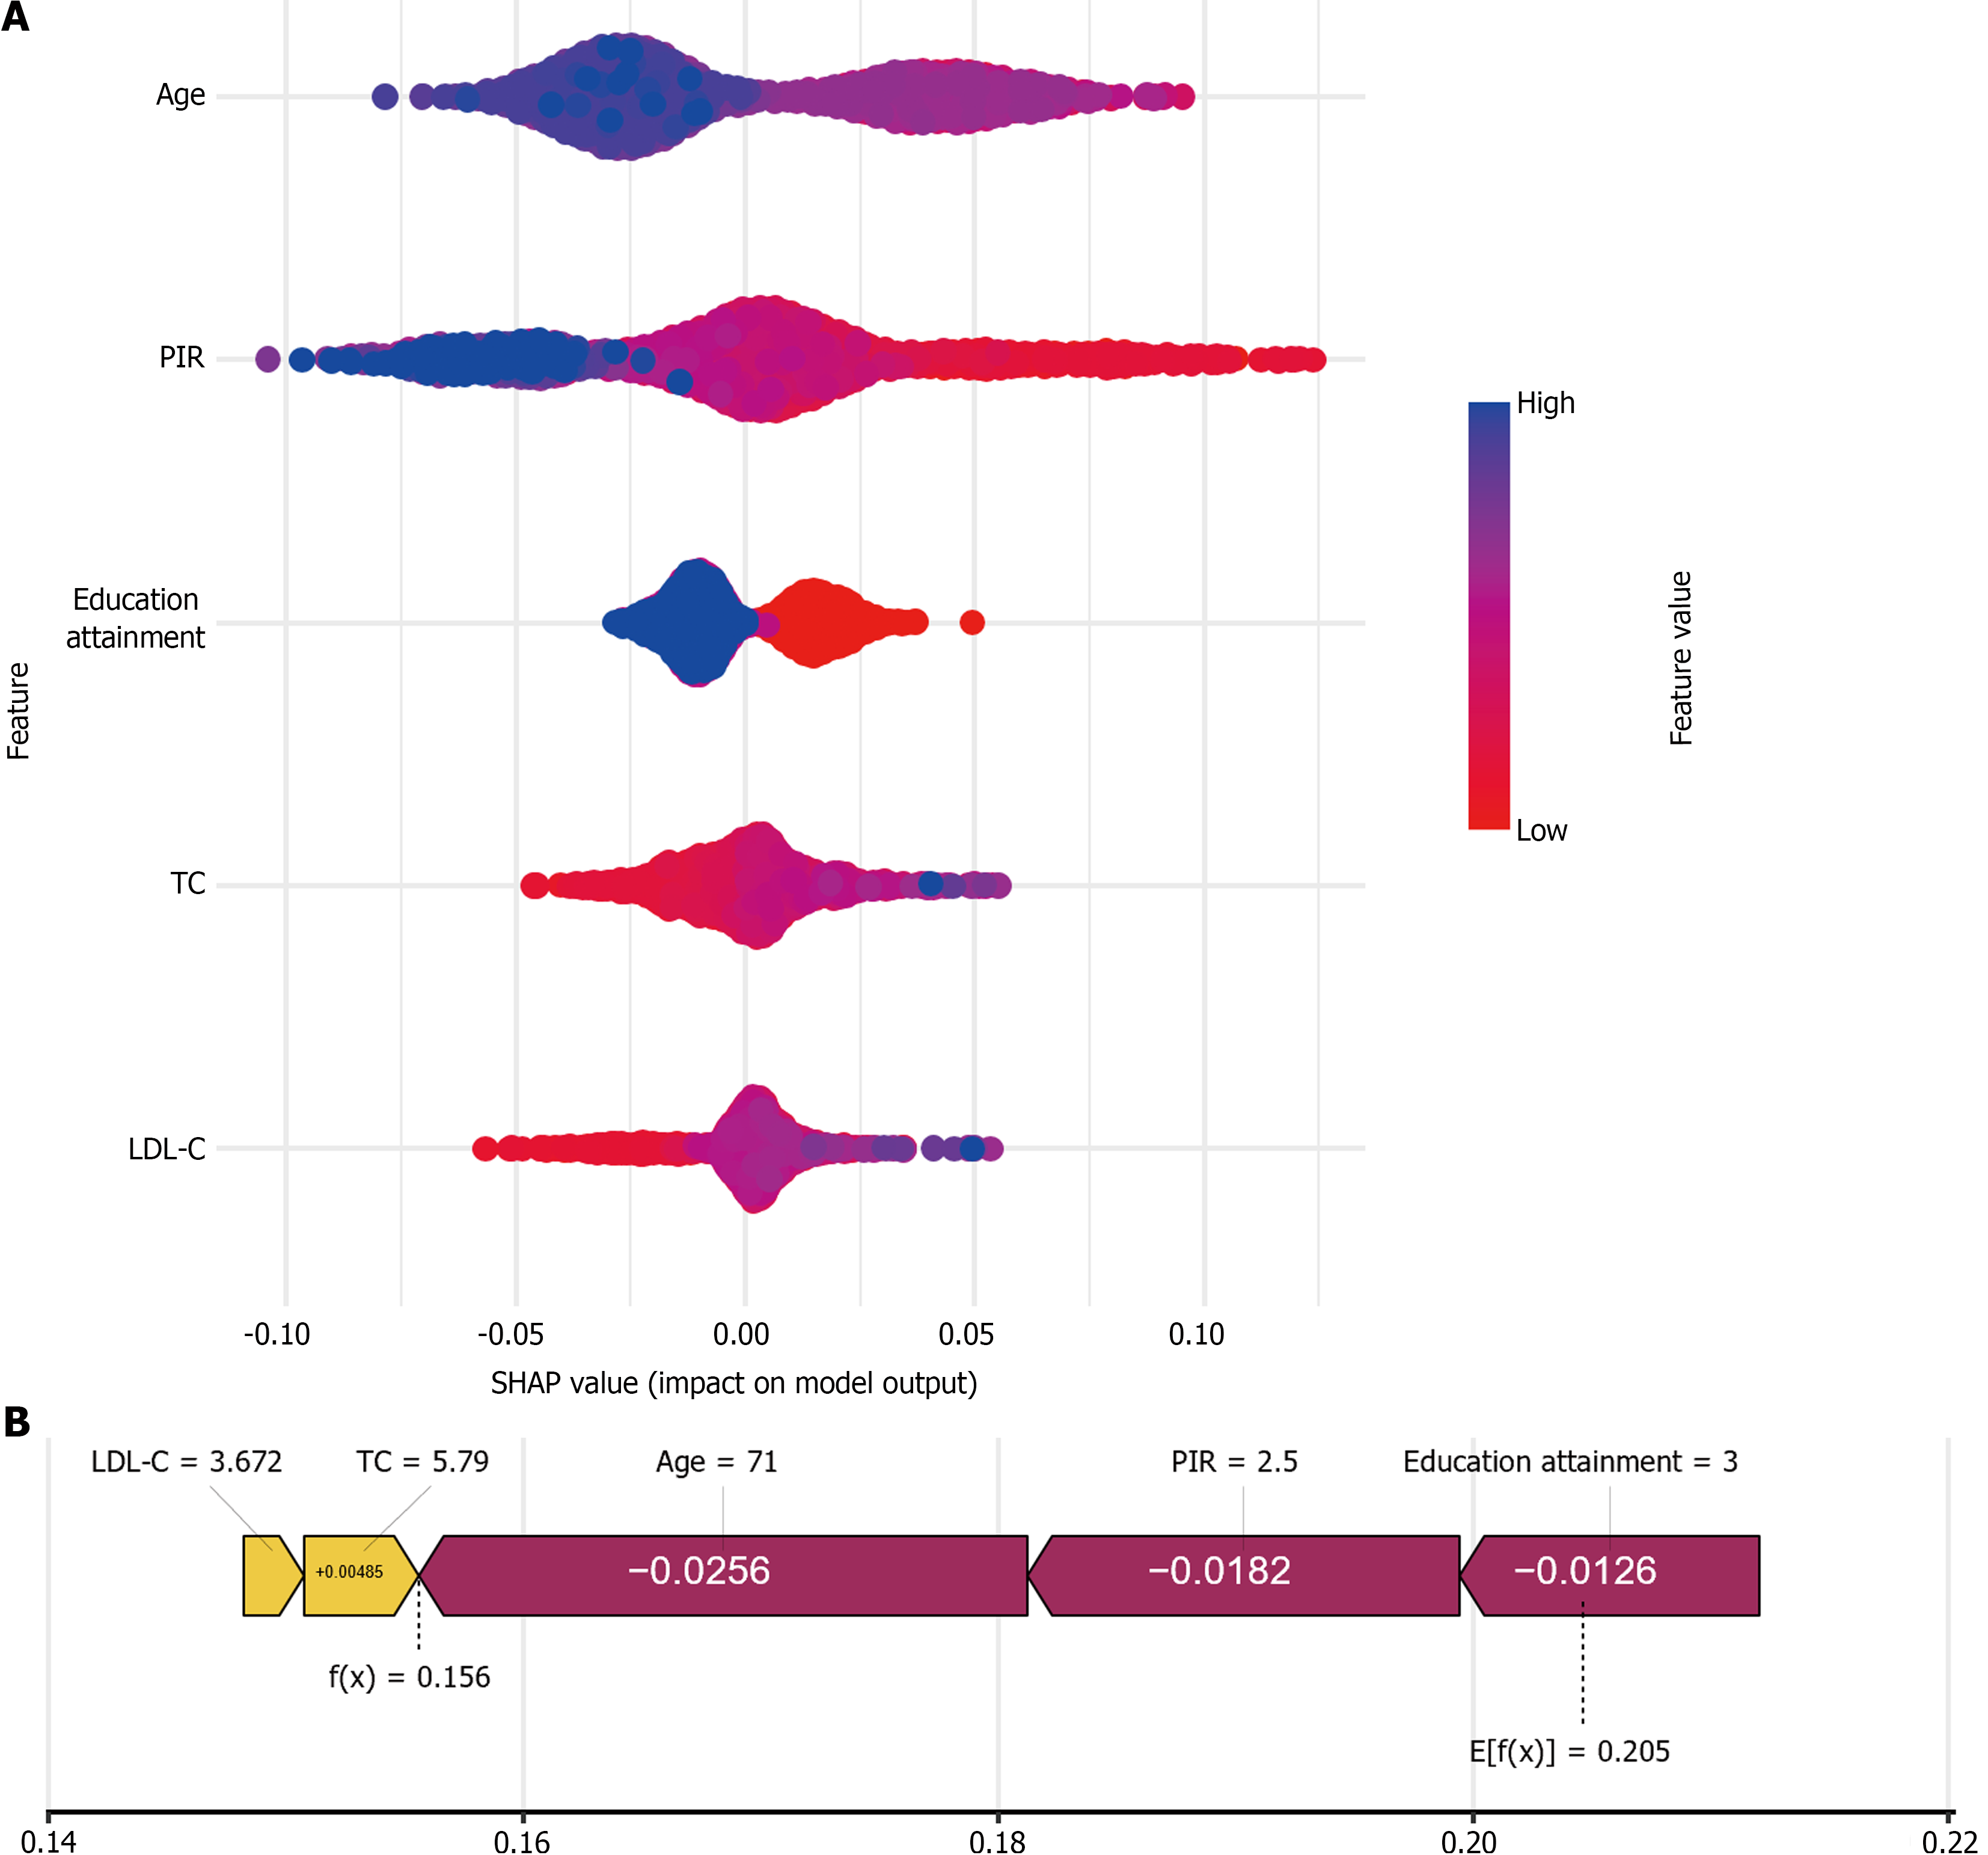
Figure 4 Visualization of feature importance.
A: The SHapley additive exPlanations (SHAP) summary plot; B: SHAP force plot. PIR: Poverty income ratio; TC: Total cholesterol; LDL-C: Low-density lipoprotein cholesterol; SHAP: SHapley additive explanation.
- Citation: Jiang H, Hu R, Wang YJ, Xie X. Predicting depression in patients with heart failure based on a stacking model. World J Clin Cases 2024; 12(21): 4661-4672
- URL: https://www.wjgnet.com/2307-8960/full/v12/i21/4661.htm
- DOI: https://dx.doi.org/10.12998/wjcc.v12.i21.4661


