Copyright
©The Author(s) 2024.
World J Clin Cases. Jul 26, 2024; 12(21): 4508-4517
Published online Jul 26, 2024. doi: 10.12998/wjcc.v12.i21.4508
Published online Jul 26, 2024. doi: 10.12998/wjcc.v12.i21.4508
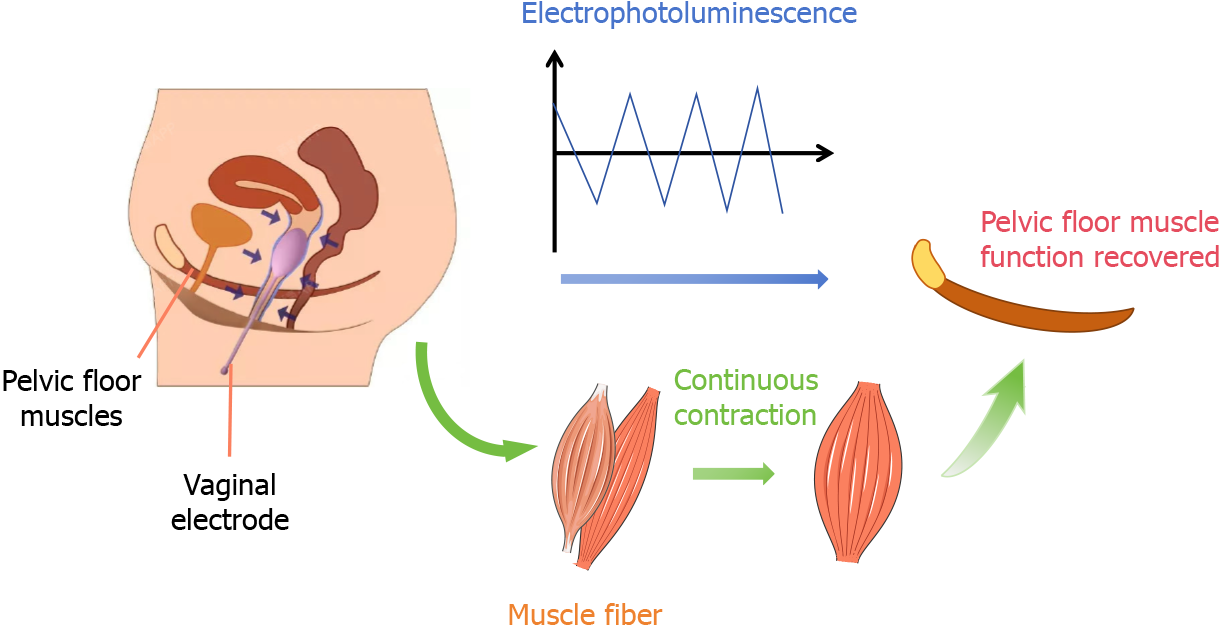
Figure 1 Schematic diagram of bioelectrical stimulation therapy for patients.
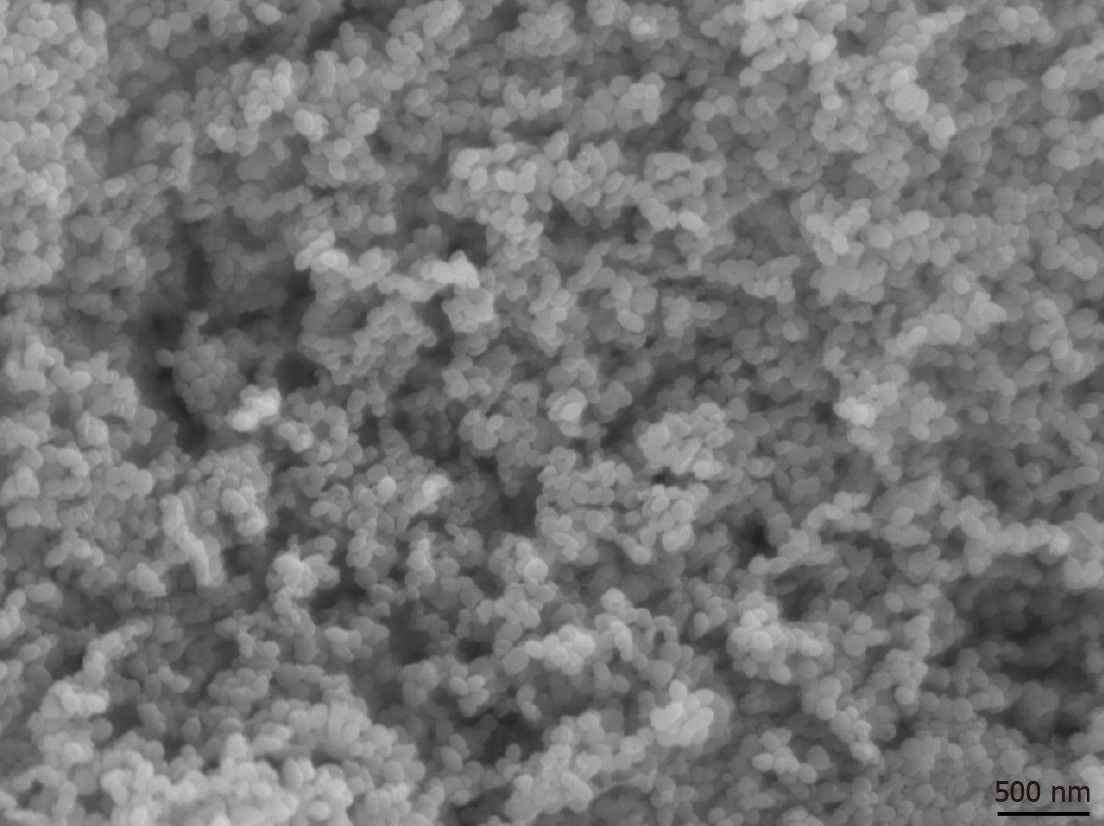
Figure 2 Scanning electron microscopy of colloidal silver nanoparticles.
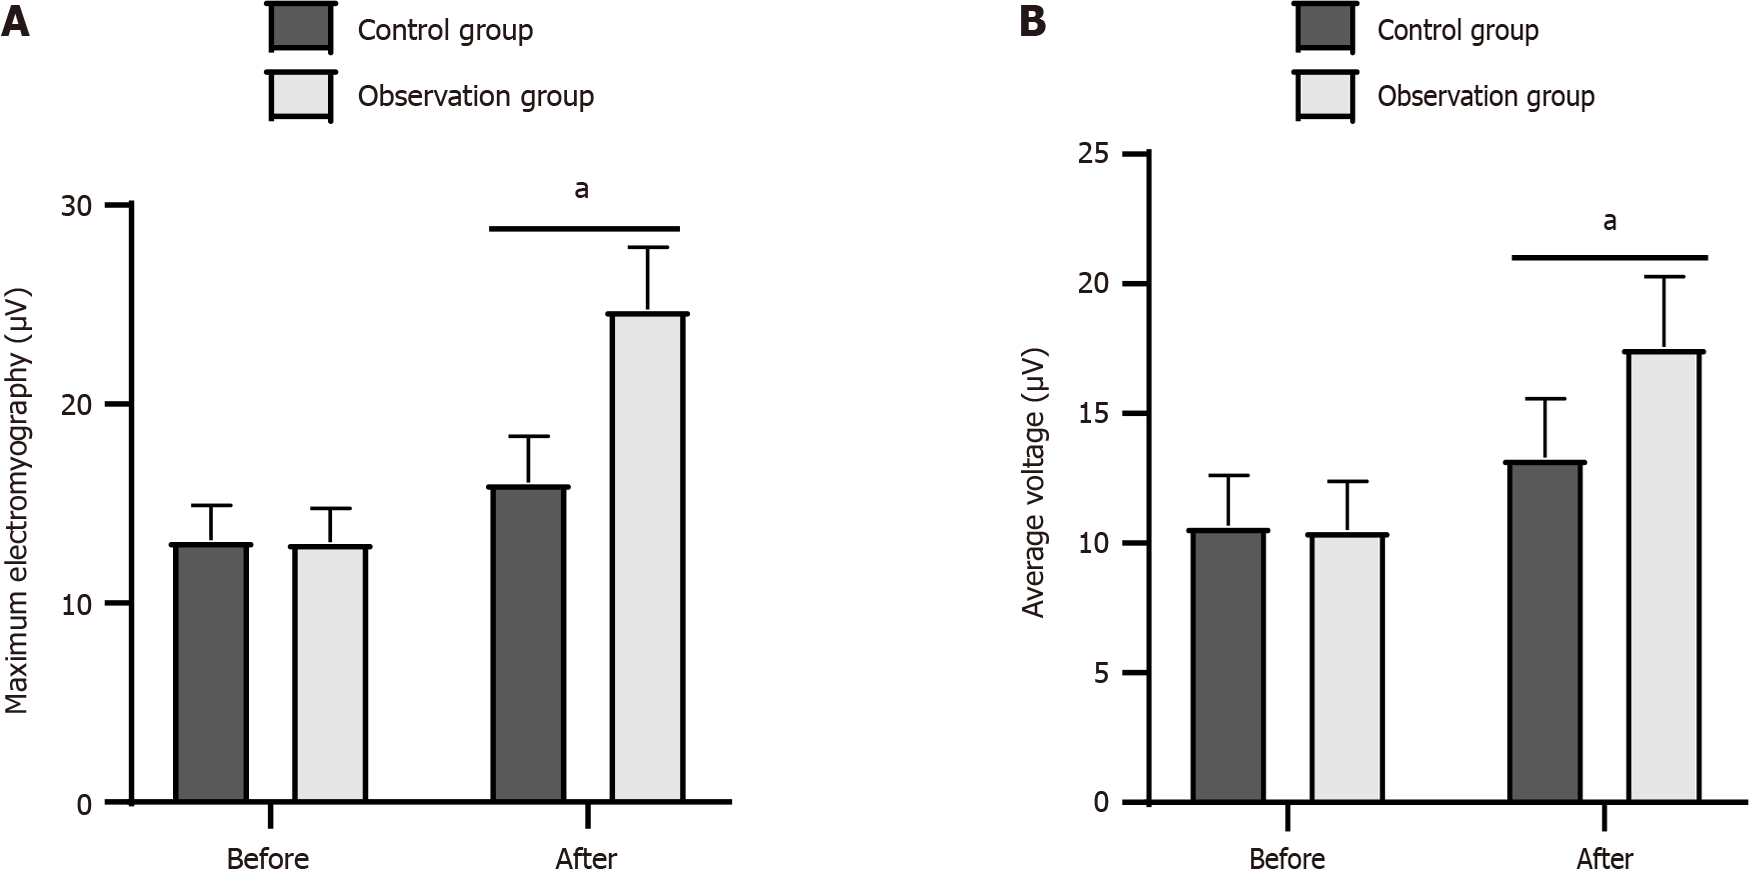
Figure 3 Pelvic floor muscle voltage in two groups.
A: Maximum electromyography analysis; B: Average muscle voltage analysis. aP < 0.05 compared with control group.
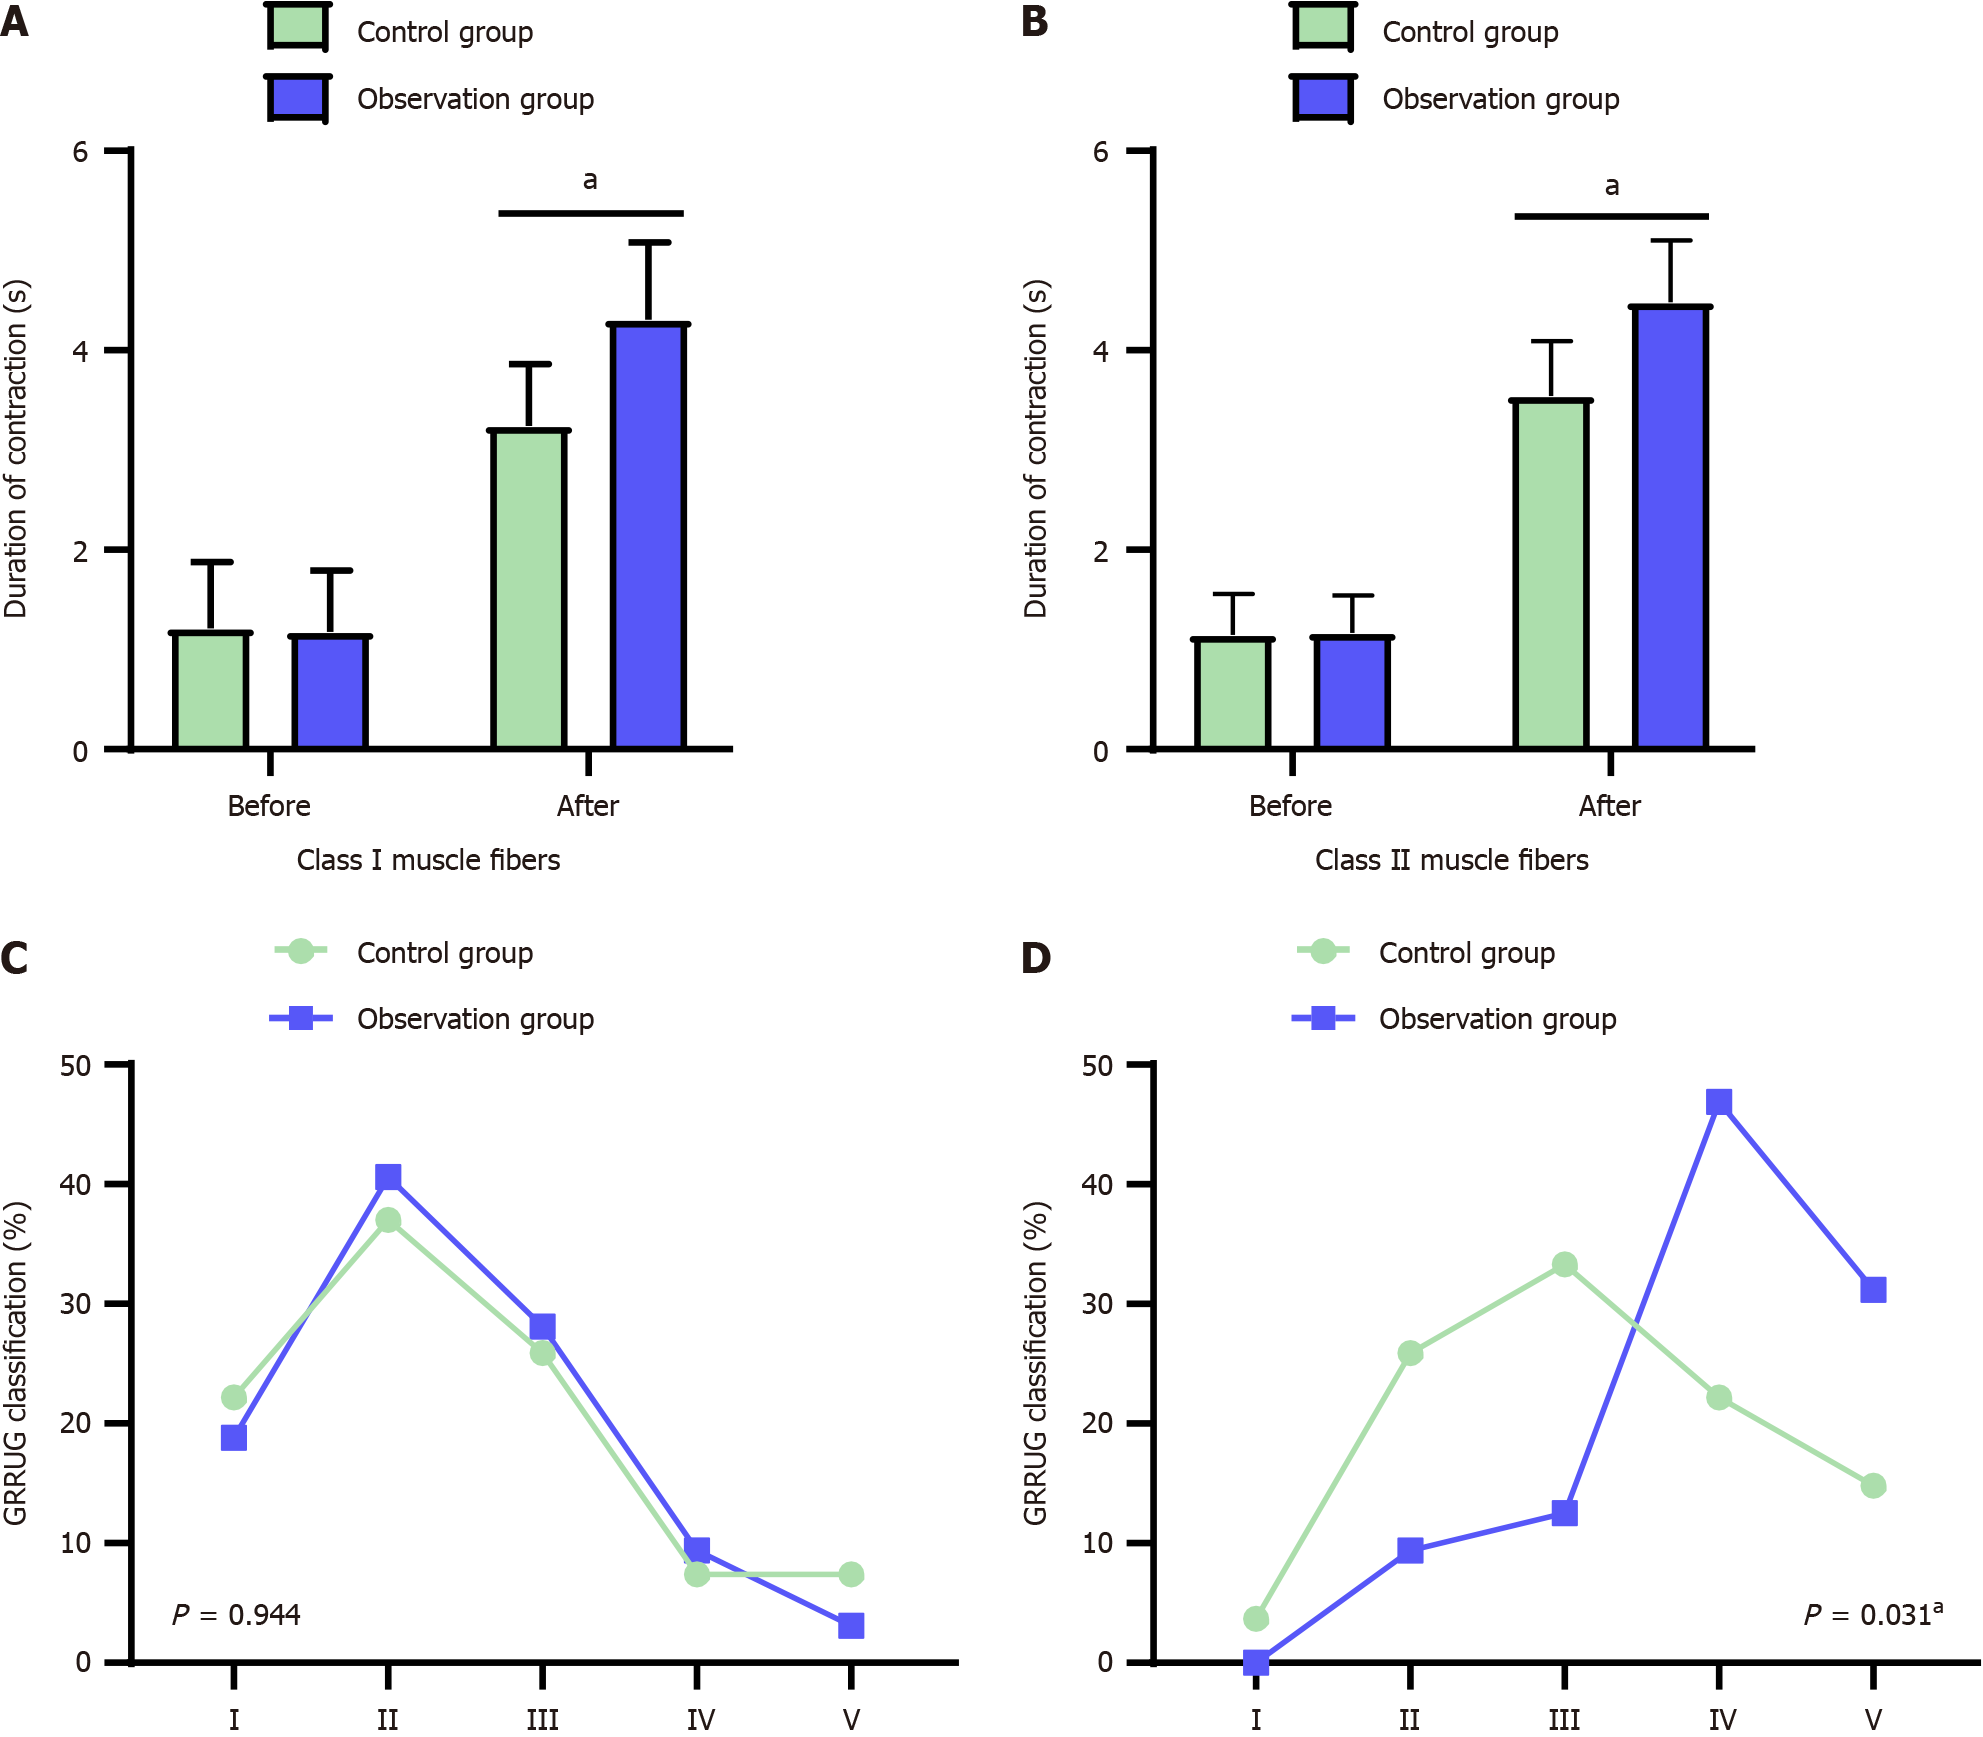
Figure 4 Pelvic floor muscle strength between the two groups.
A: Contraction time of class I muscle fibers before and after treatment; B: Contraction time of class II muscle fibers before and after treatment; C: Pelvic floor muscle strength classification between the two groups before treatment; D: Pelvic floor muscle strength classification between the two groups after treatment. aP < 0.05 compared with the control group.
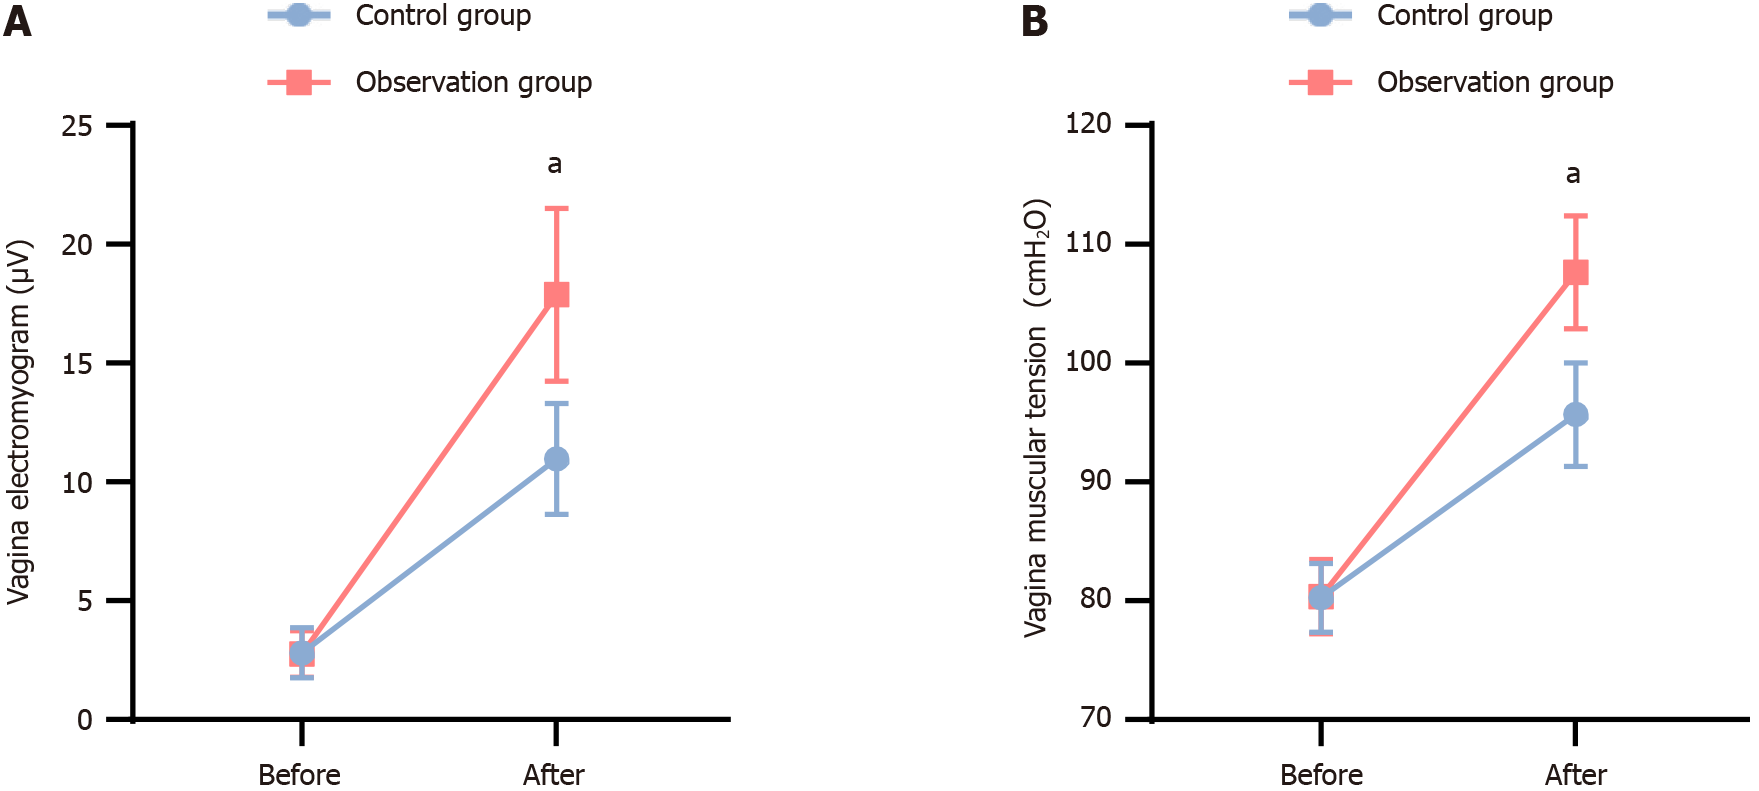
Figure 5 Vaginal electromyogram and vaginal muscle tension between the two groups.
A: Comparison of vaginal electromyograms before and after treatment; B: Vaginal muscle tension before and after treatment. aP < 0.05 compared with the control group.
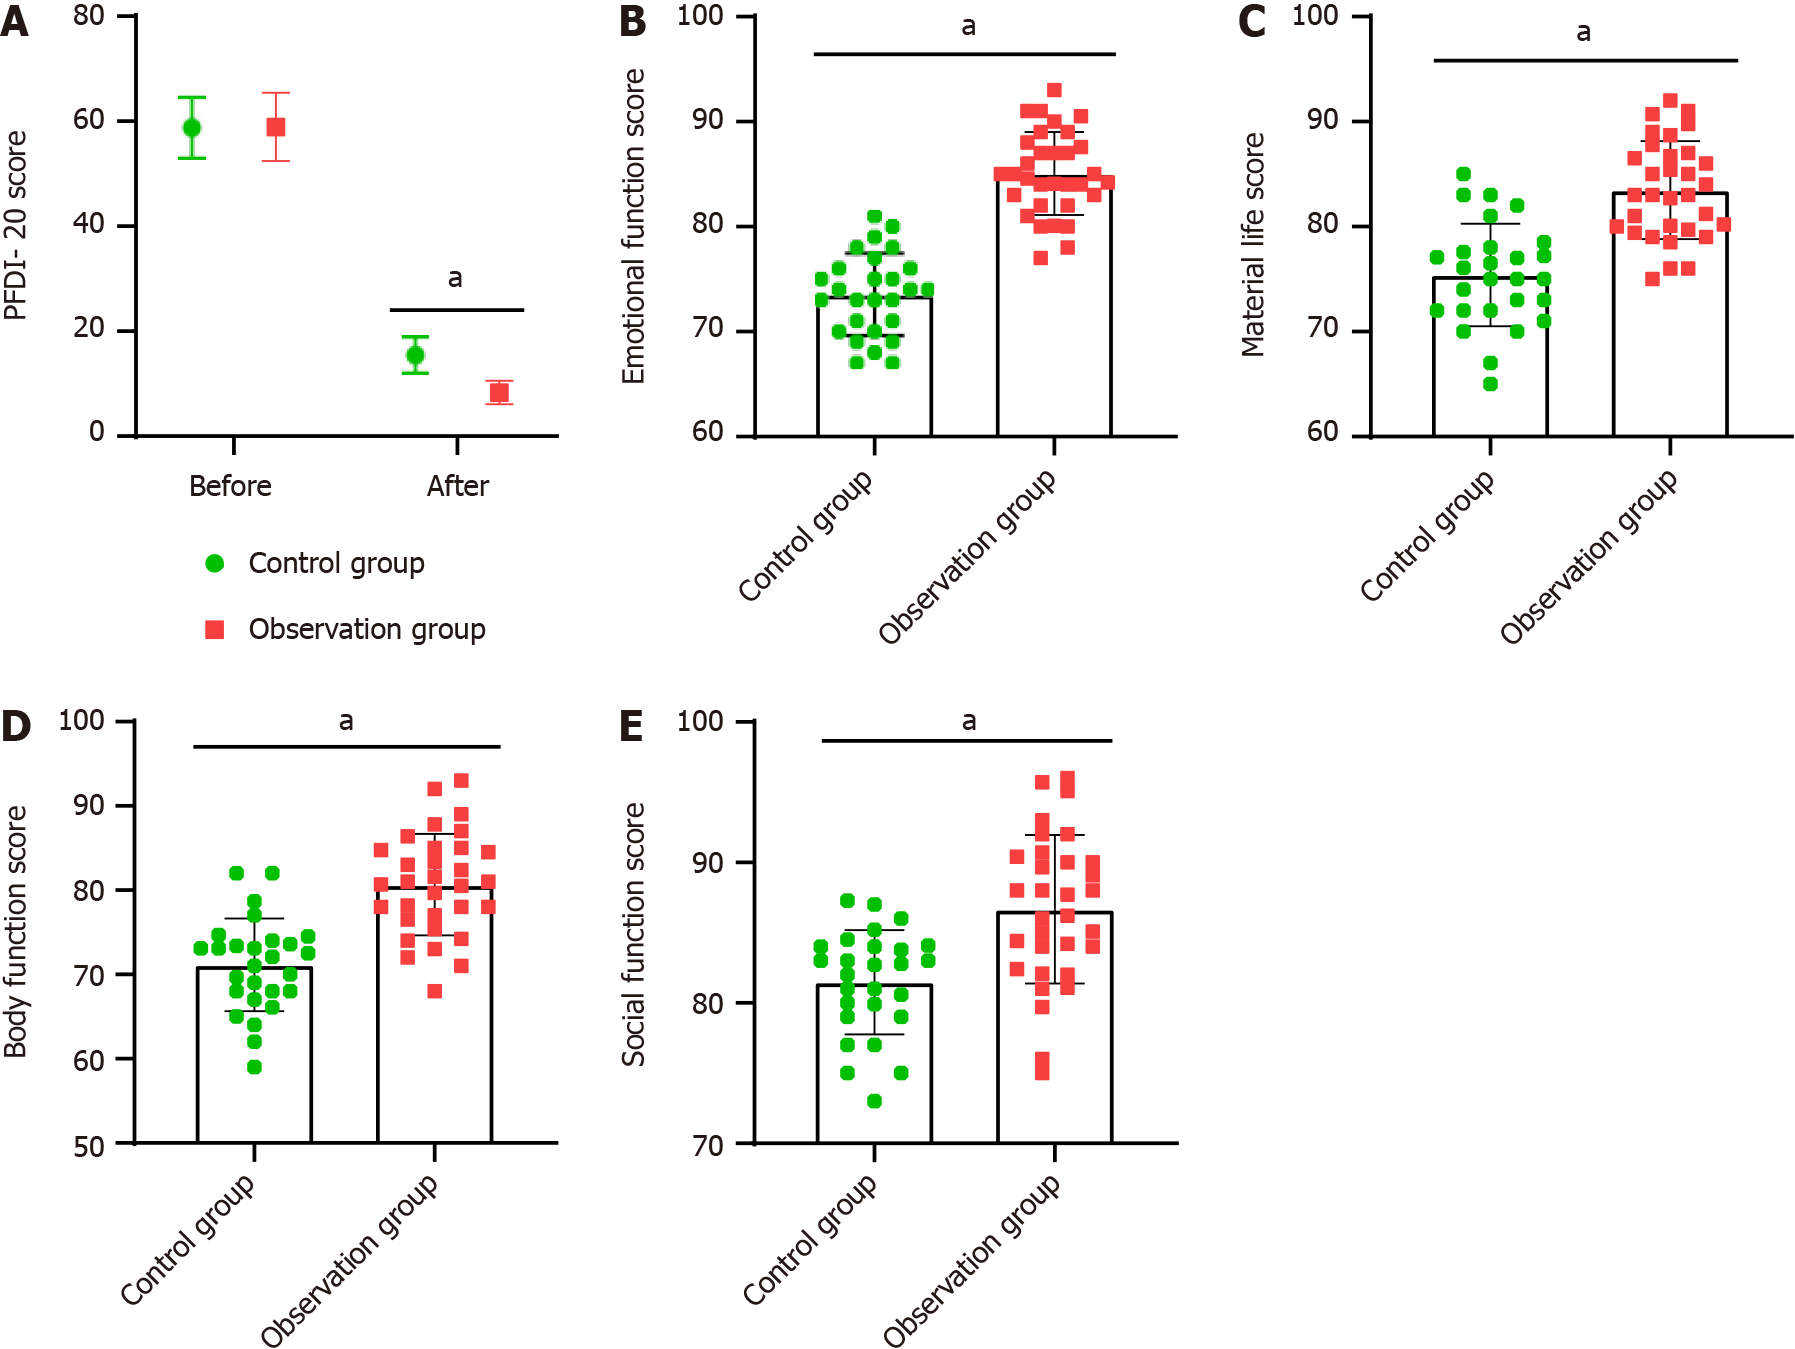
Figure 6 Pelvic floor function and quality of life between the two groups.
A: PFDI-20 scores before and after treatment; B: Emotional function after treatment; C: Physical function after treatment; D: Social functioning after treatment; E: Material life after treatment. aP < 0.05 compared with control group.
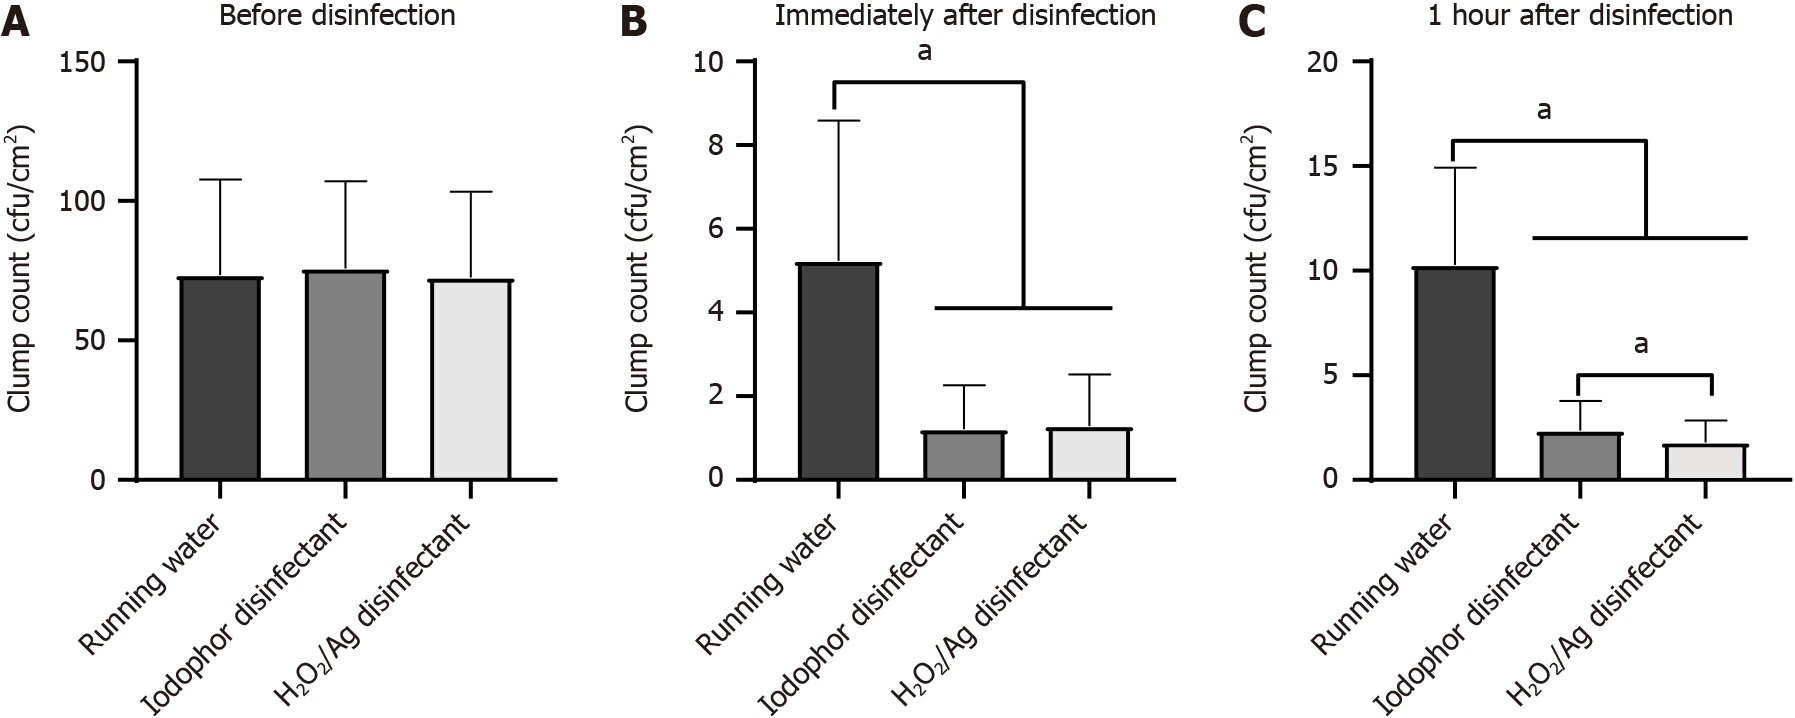
Figure 7 Number of colonies on the surface of the vaginal electrode before and after disinfection.
A: Number of colonies before disinfection; B: Number of colonies detected immediately after disinfection; C: Number of colonies 1 hour after disinfection. aP < 0.05, compared with the tap water group.
- Citation: Zhou W, Guo H. Curative effect of hydrogen peroxide combined with silver ion disinfection on pelvic floor dysfunction. World J Clin Cases 2024; 12(21): 4508-4517
- URL: https://www.wjgnet.com/2307-8960/full/v12/i21/4508.htm
- DOI: https://dx.doi.org/10.12998/wjcc.v12.i21.4508


