Copyright
©The Author(s) 2024.
World J Clin Cases. Jul 16, 2024; 12(20): 4301-4316
Published online Jul 16, 2024. doi: 10.12998/wjcc.v12.i20.4301
Published online Jul 16, 2024. doi: 10.12998/wjcc.v12.i20.4301
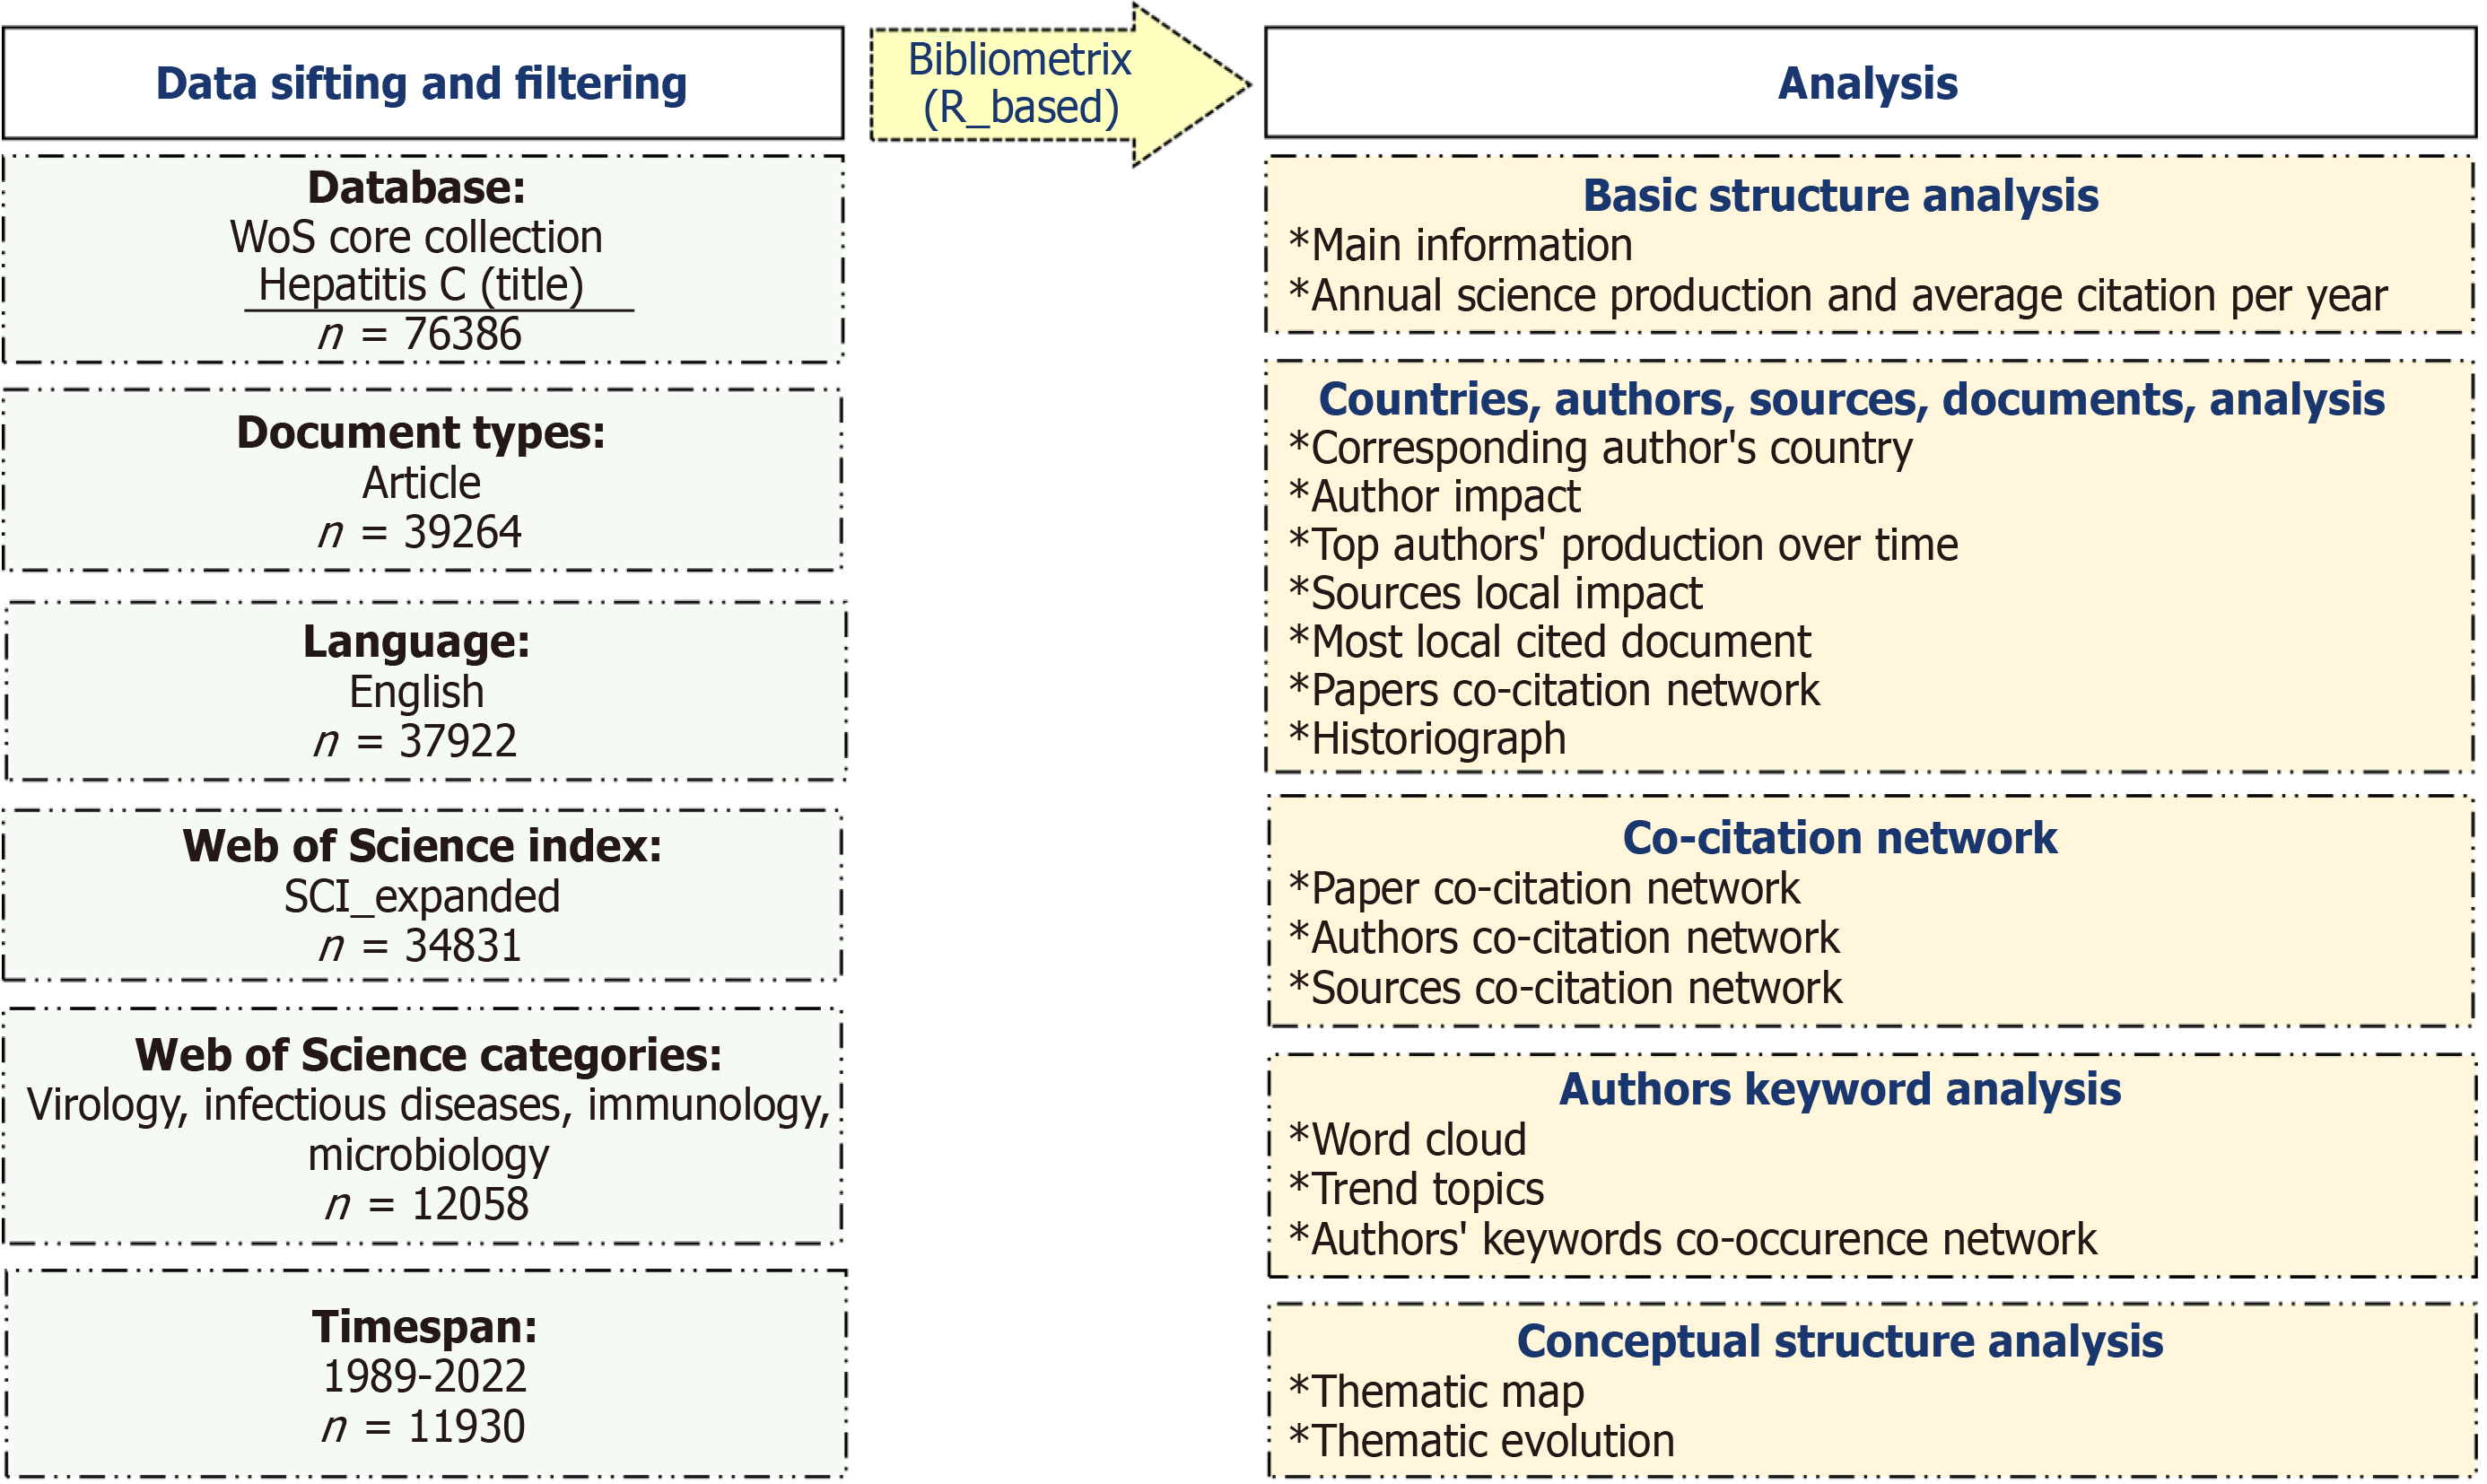
Figure 1 Workflow of science mapping.
Figure 2 Main information.
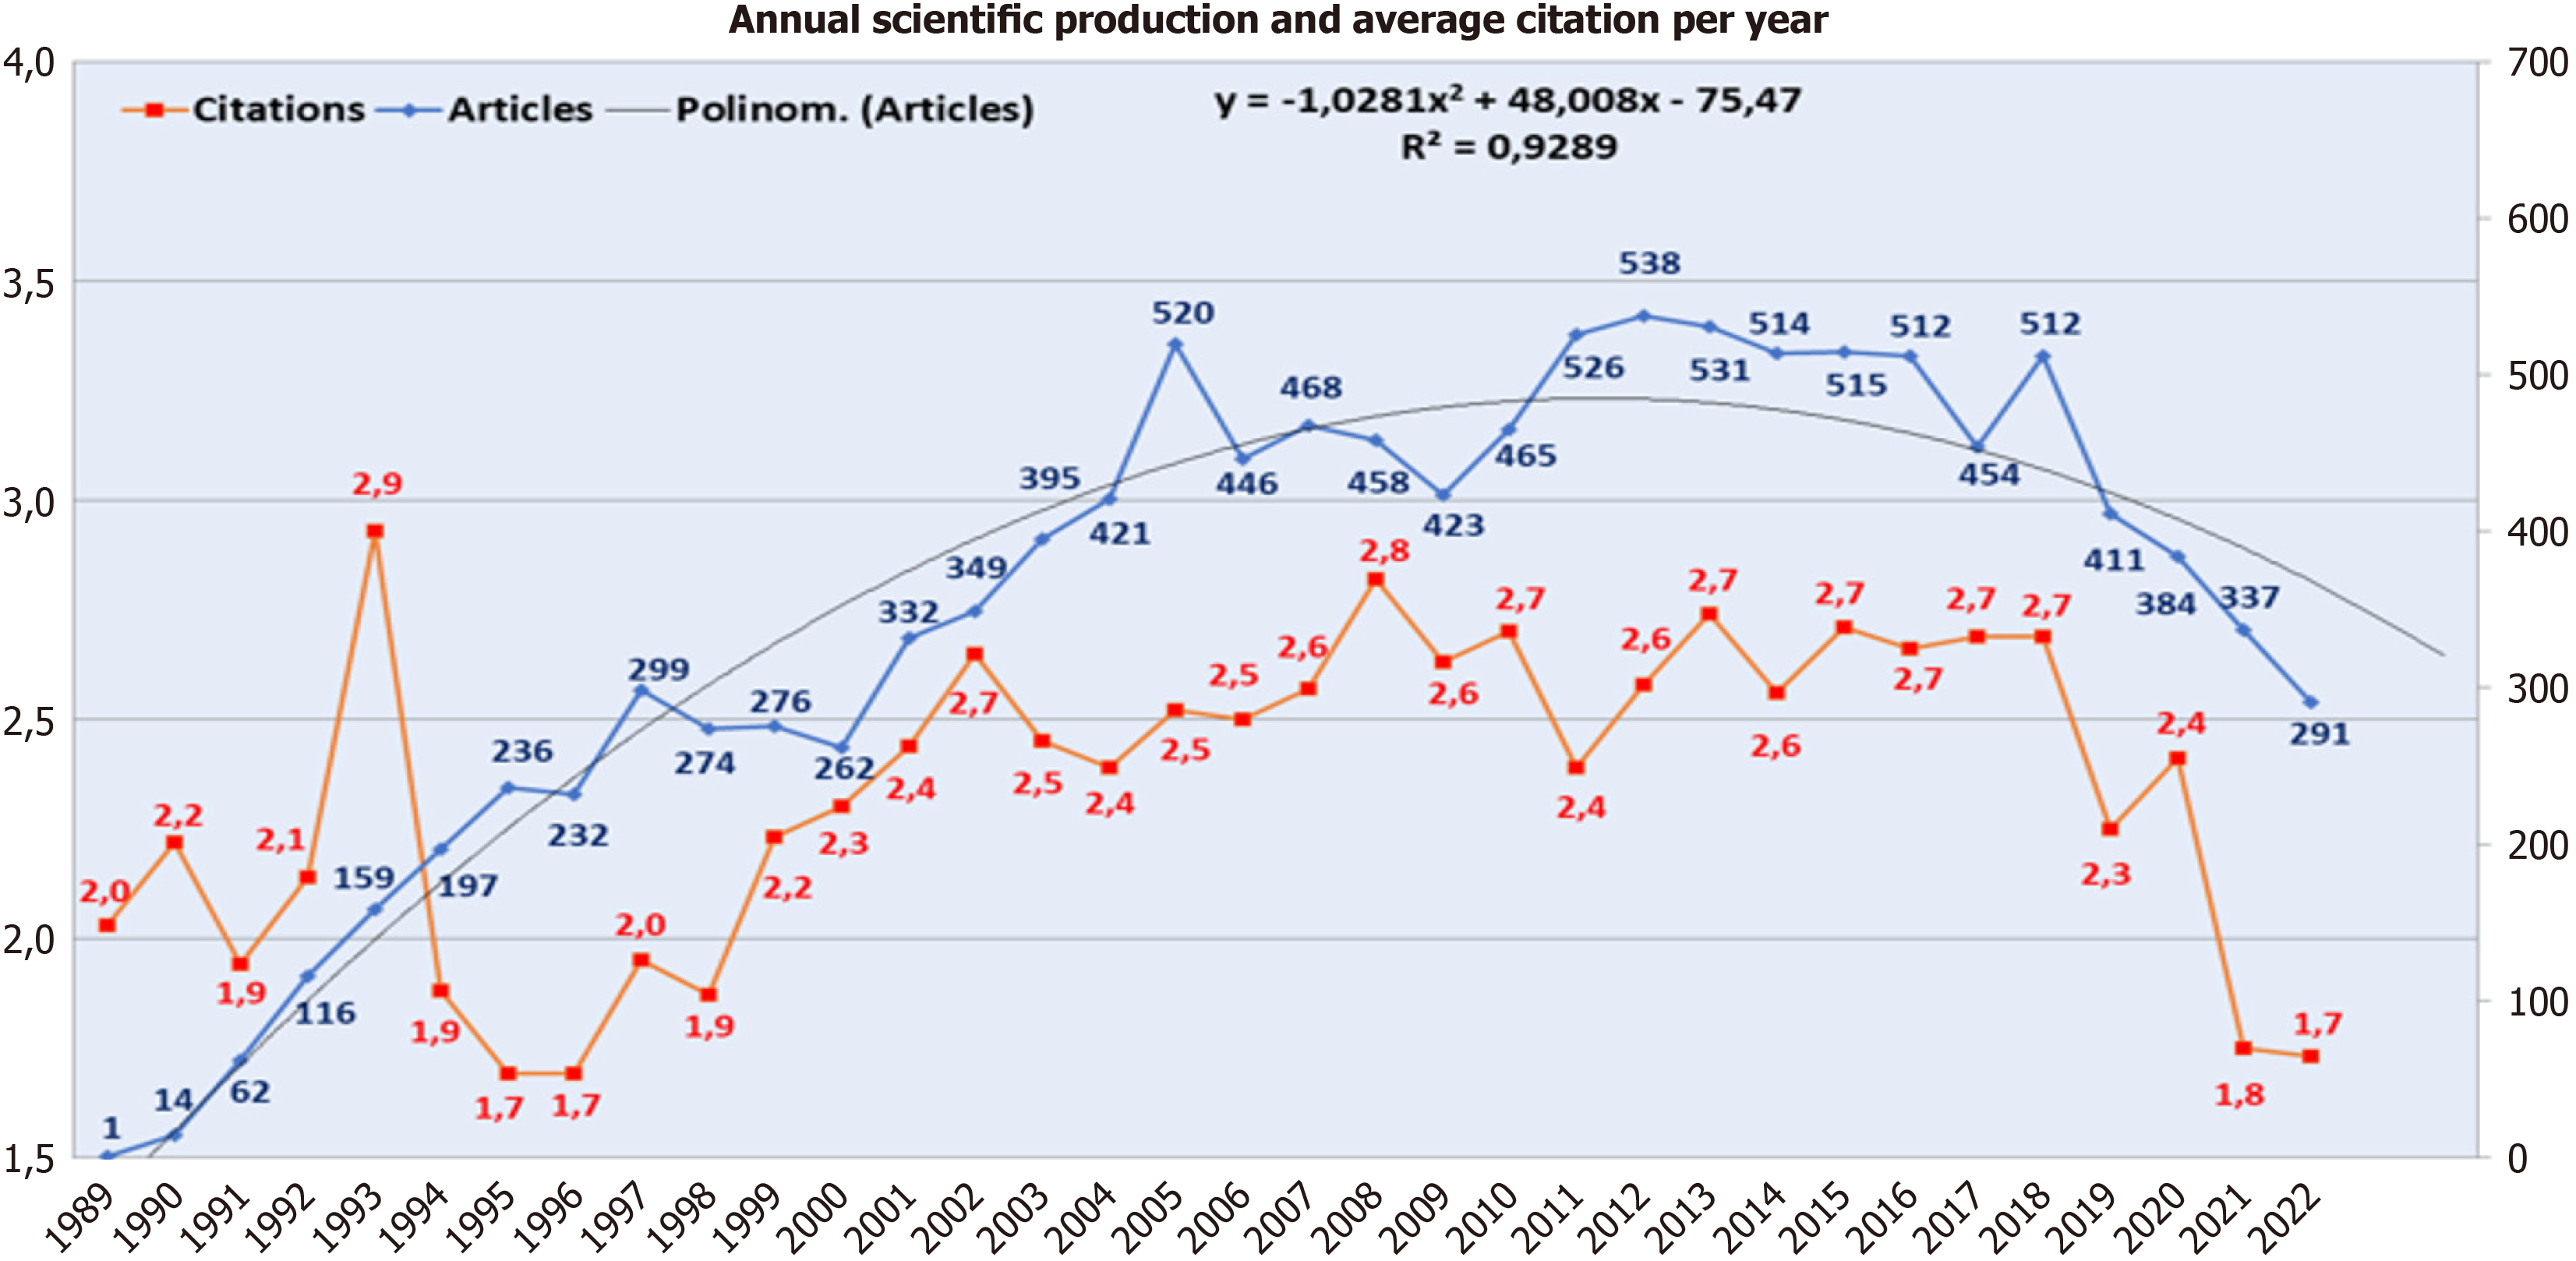
Figure 3 Annual scientific production and average citation per year.
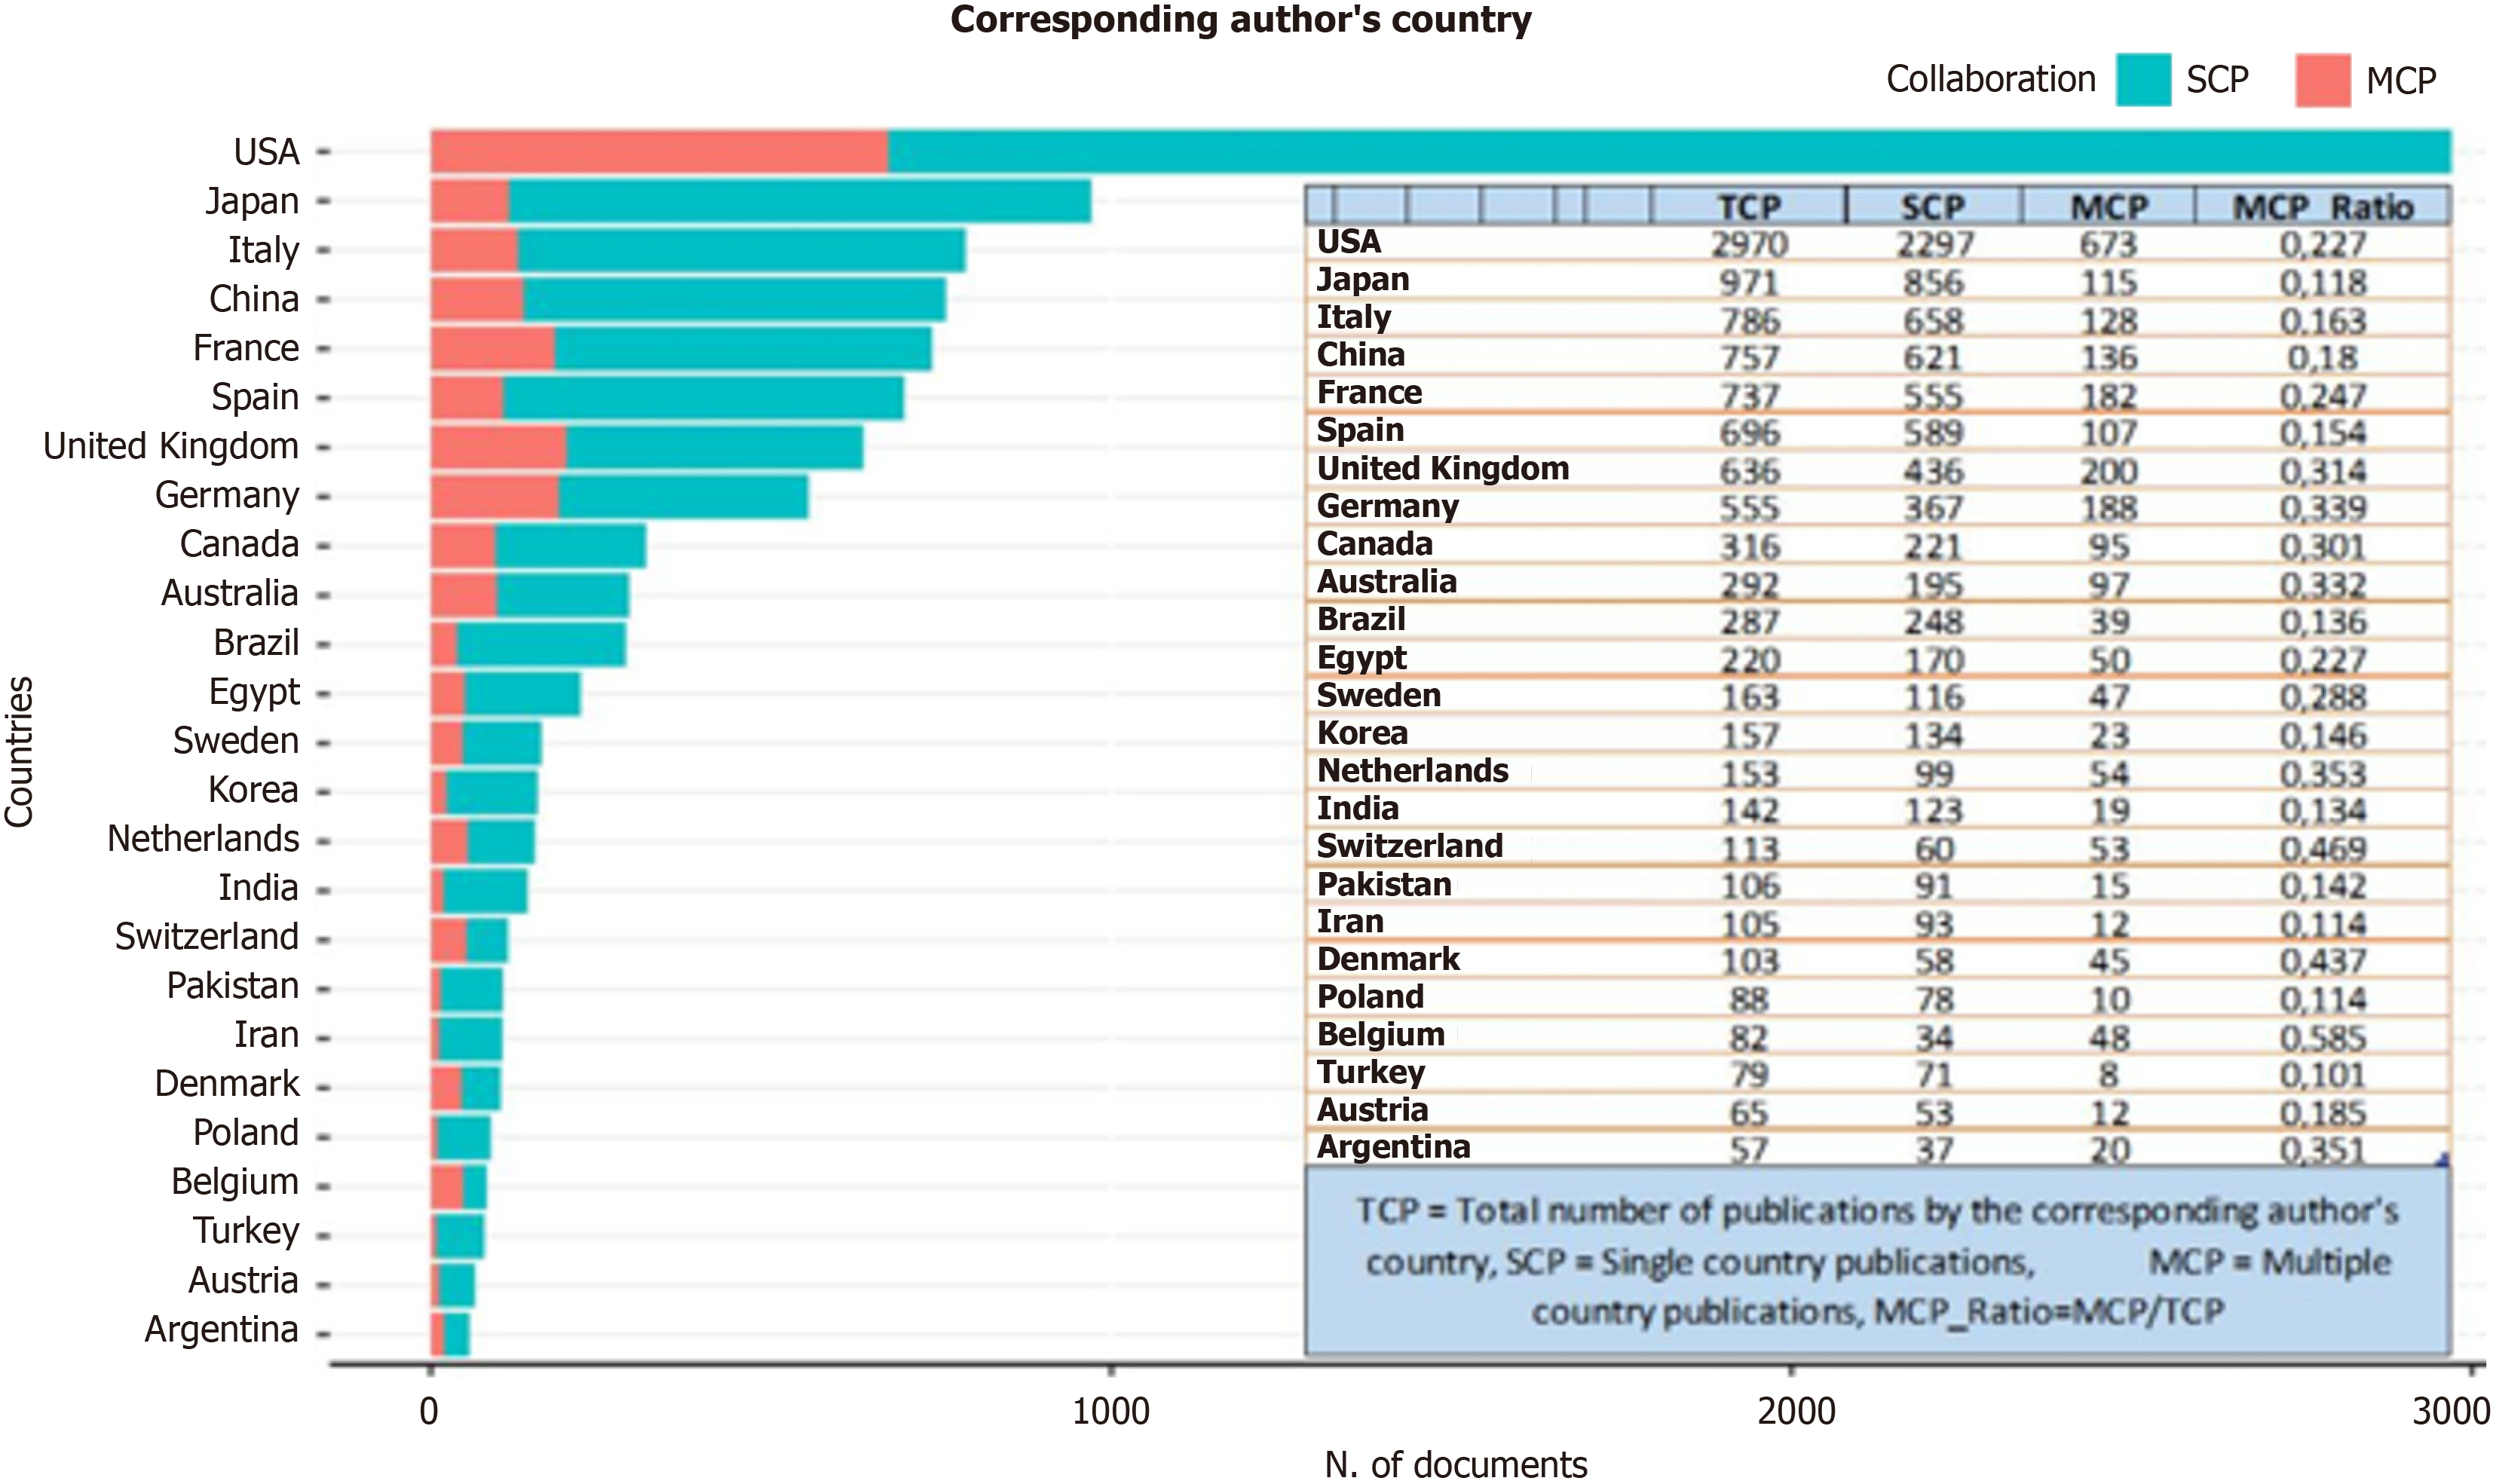
Figure 4 Corresponding author’s country.
SCP: Single-country publications; MCP: Multiple-country publications.
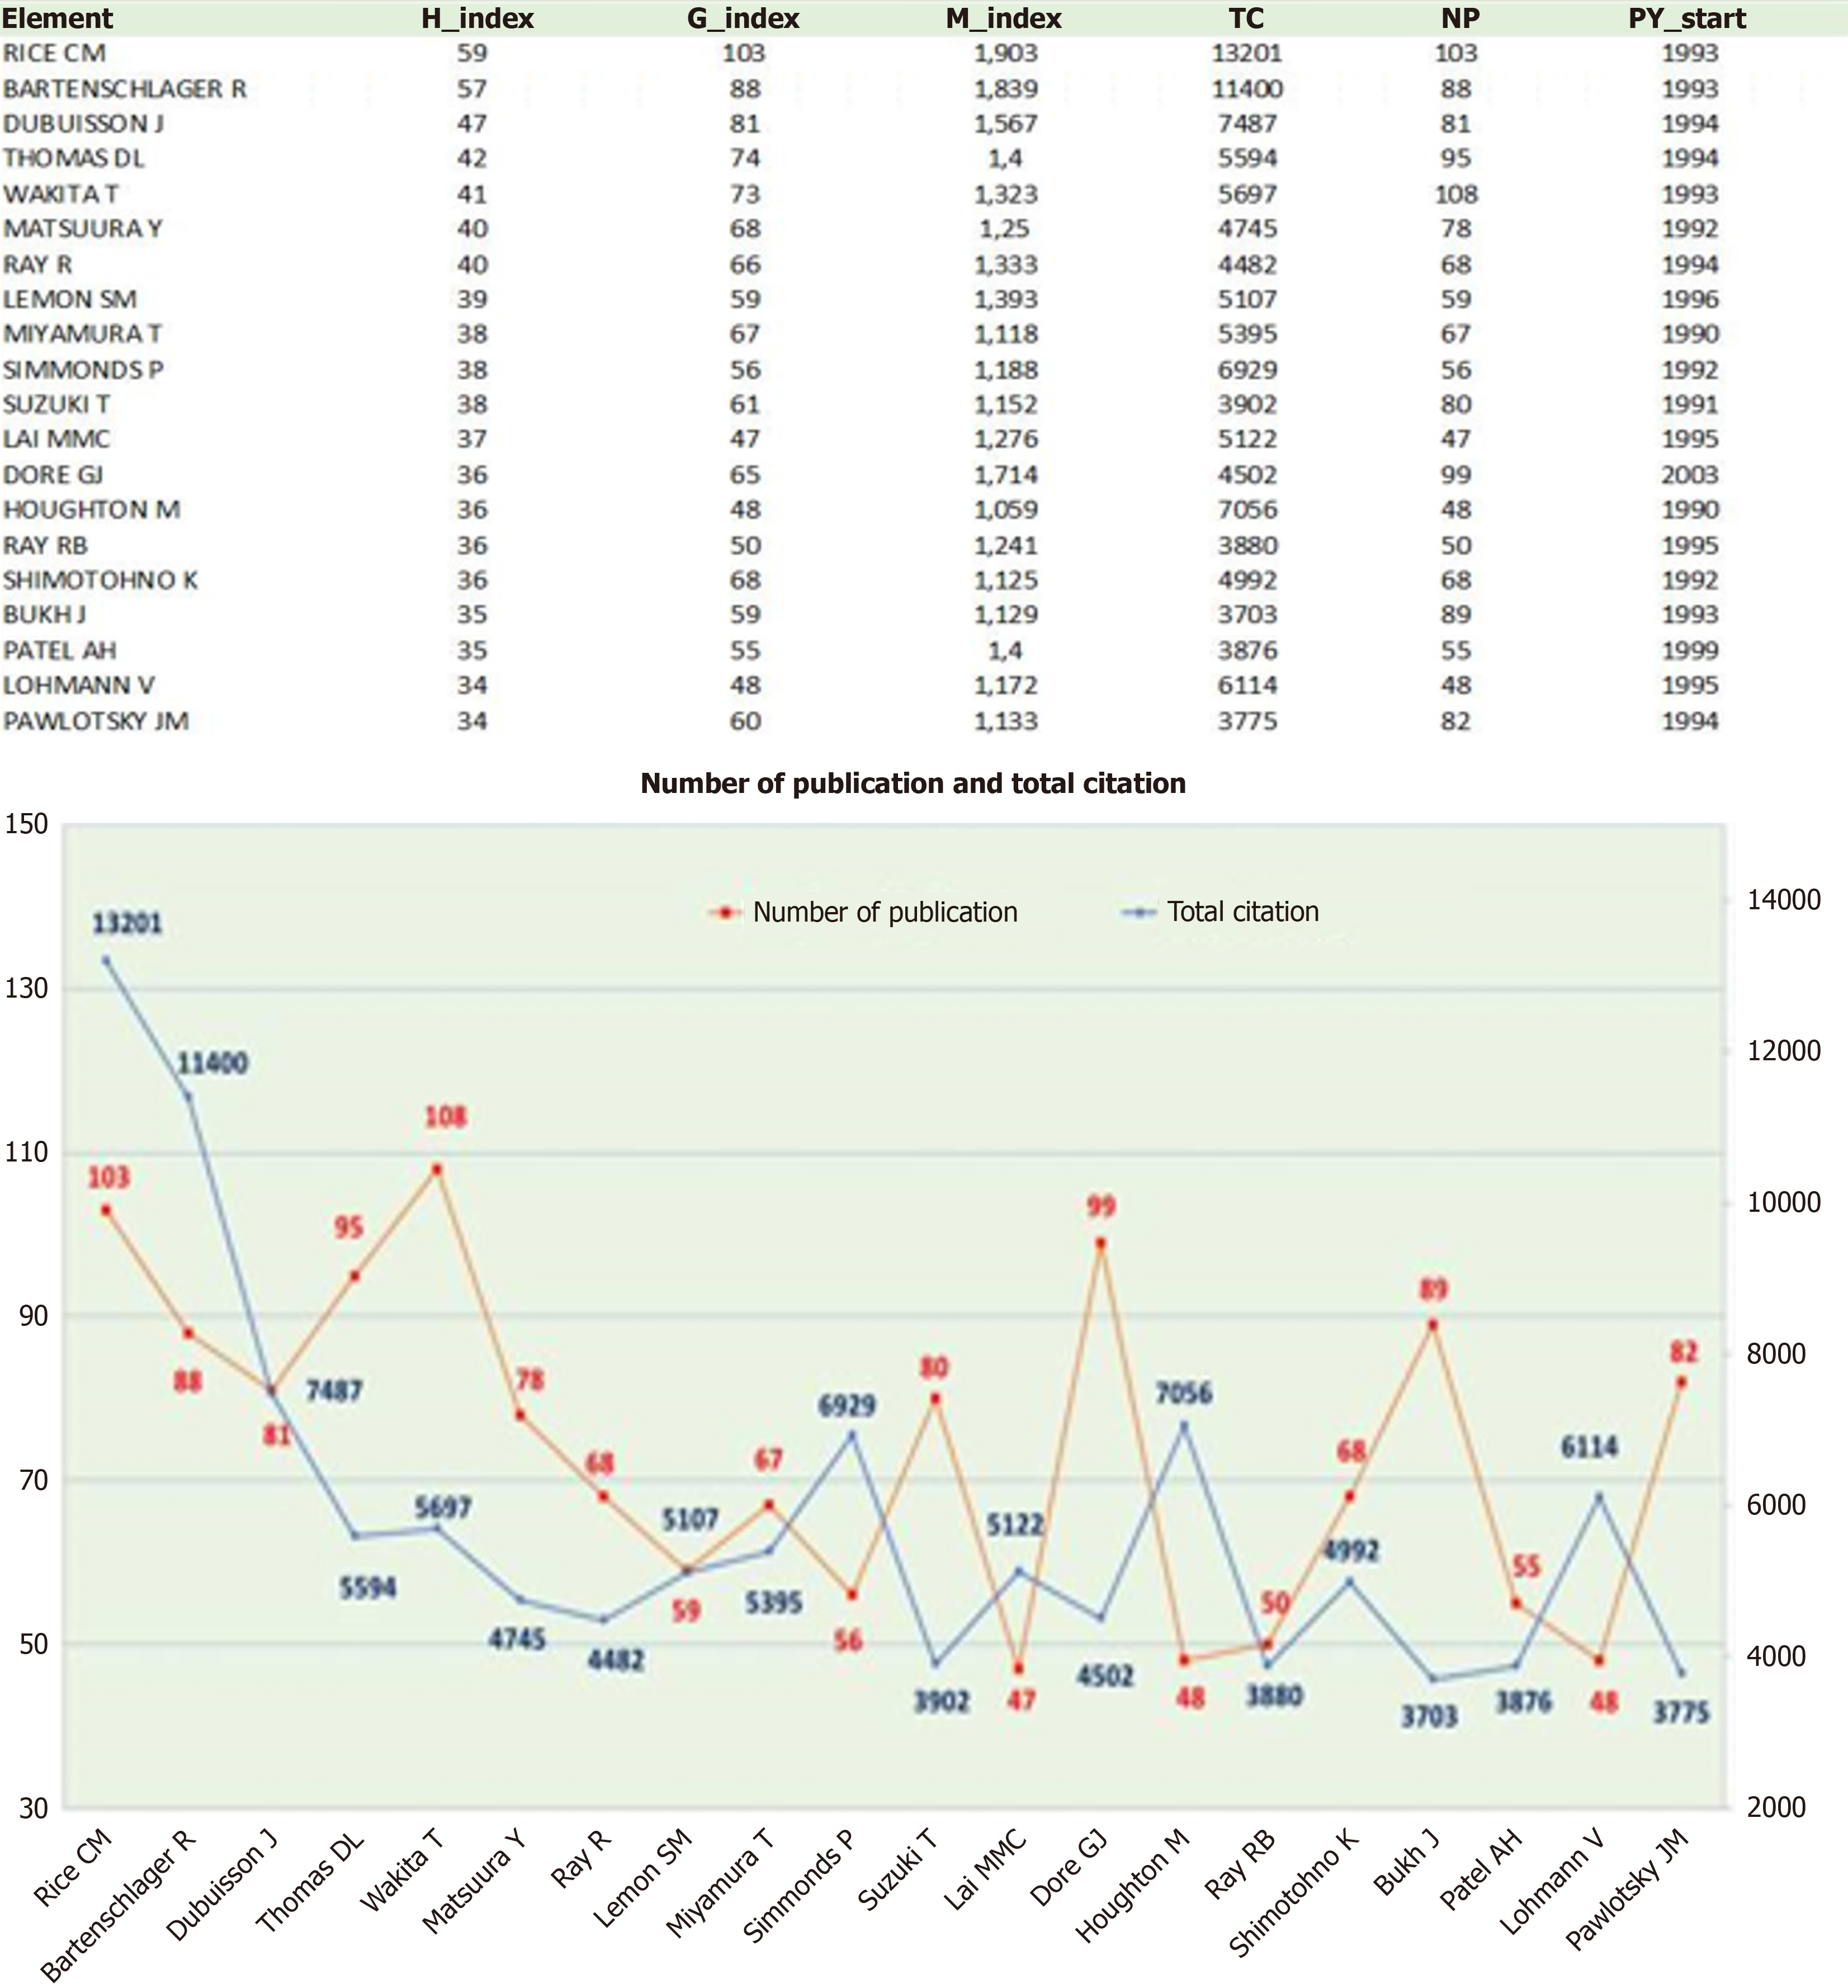
Figure 5 Author impact.
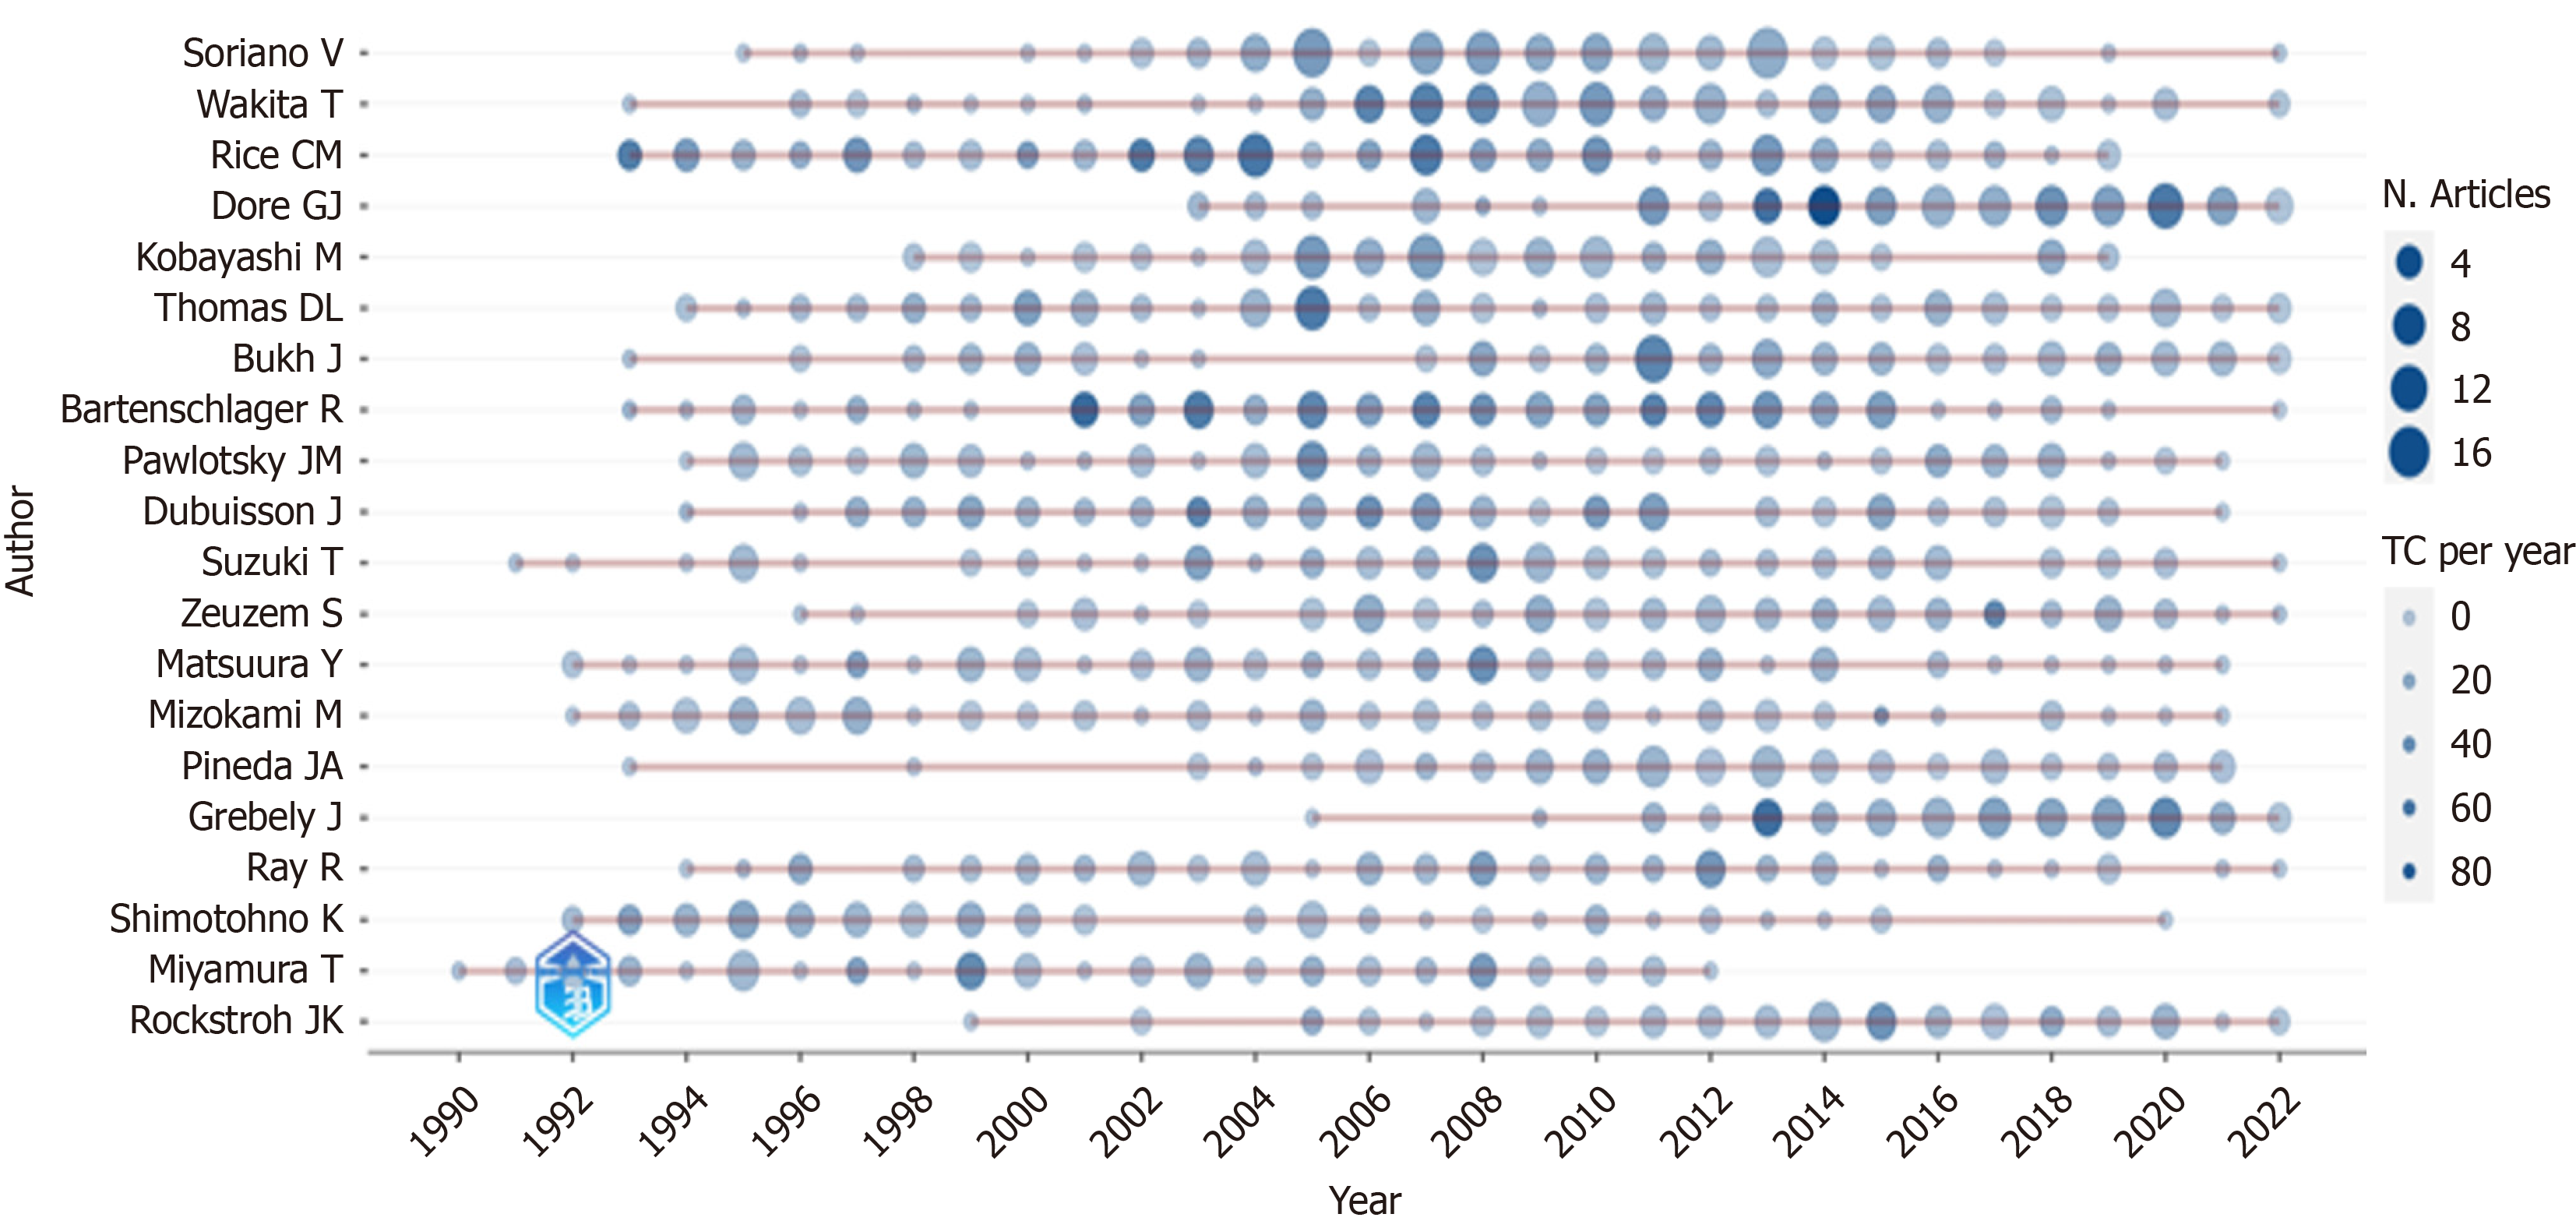
Figure 6 Top-authors’ production over time.
TC: Total citation.
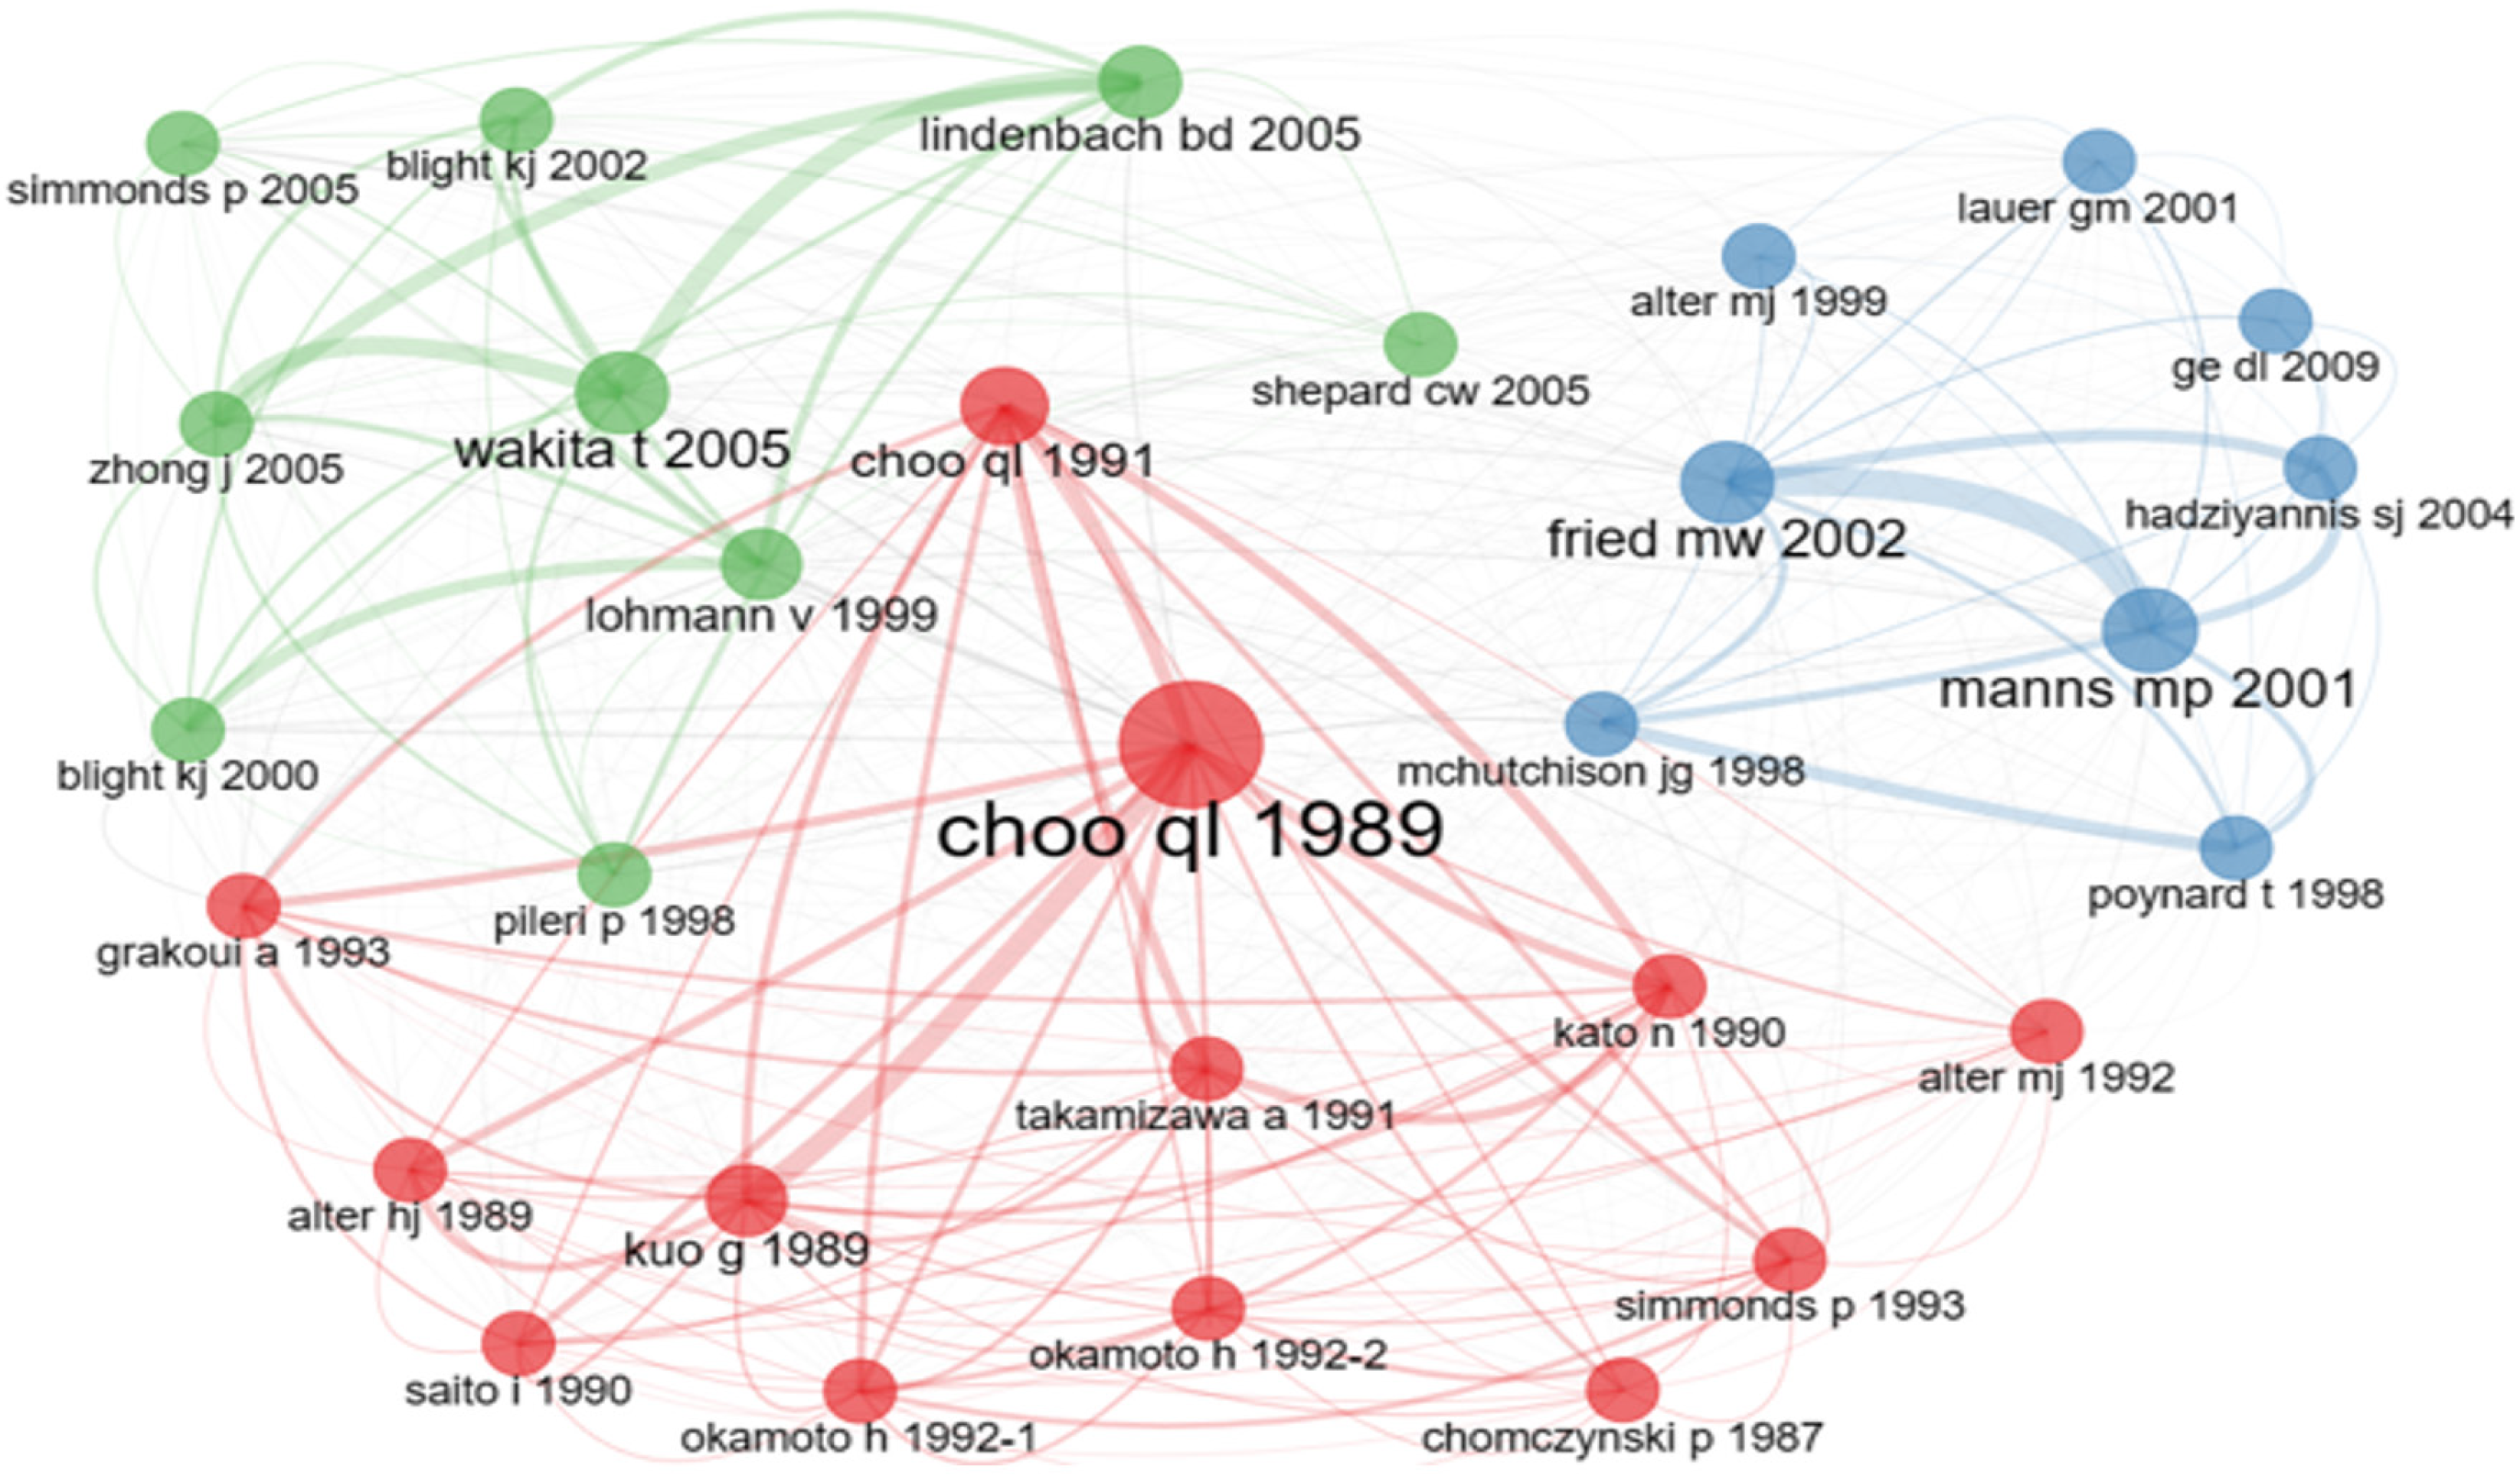
Figure 7 Papers co-citation network.
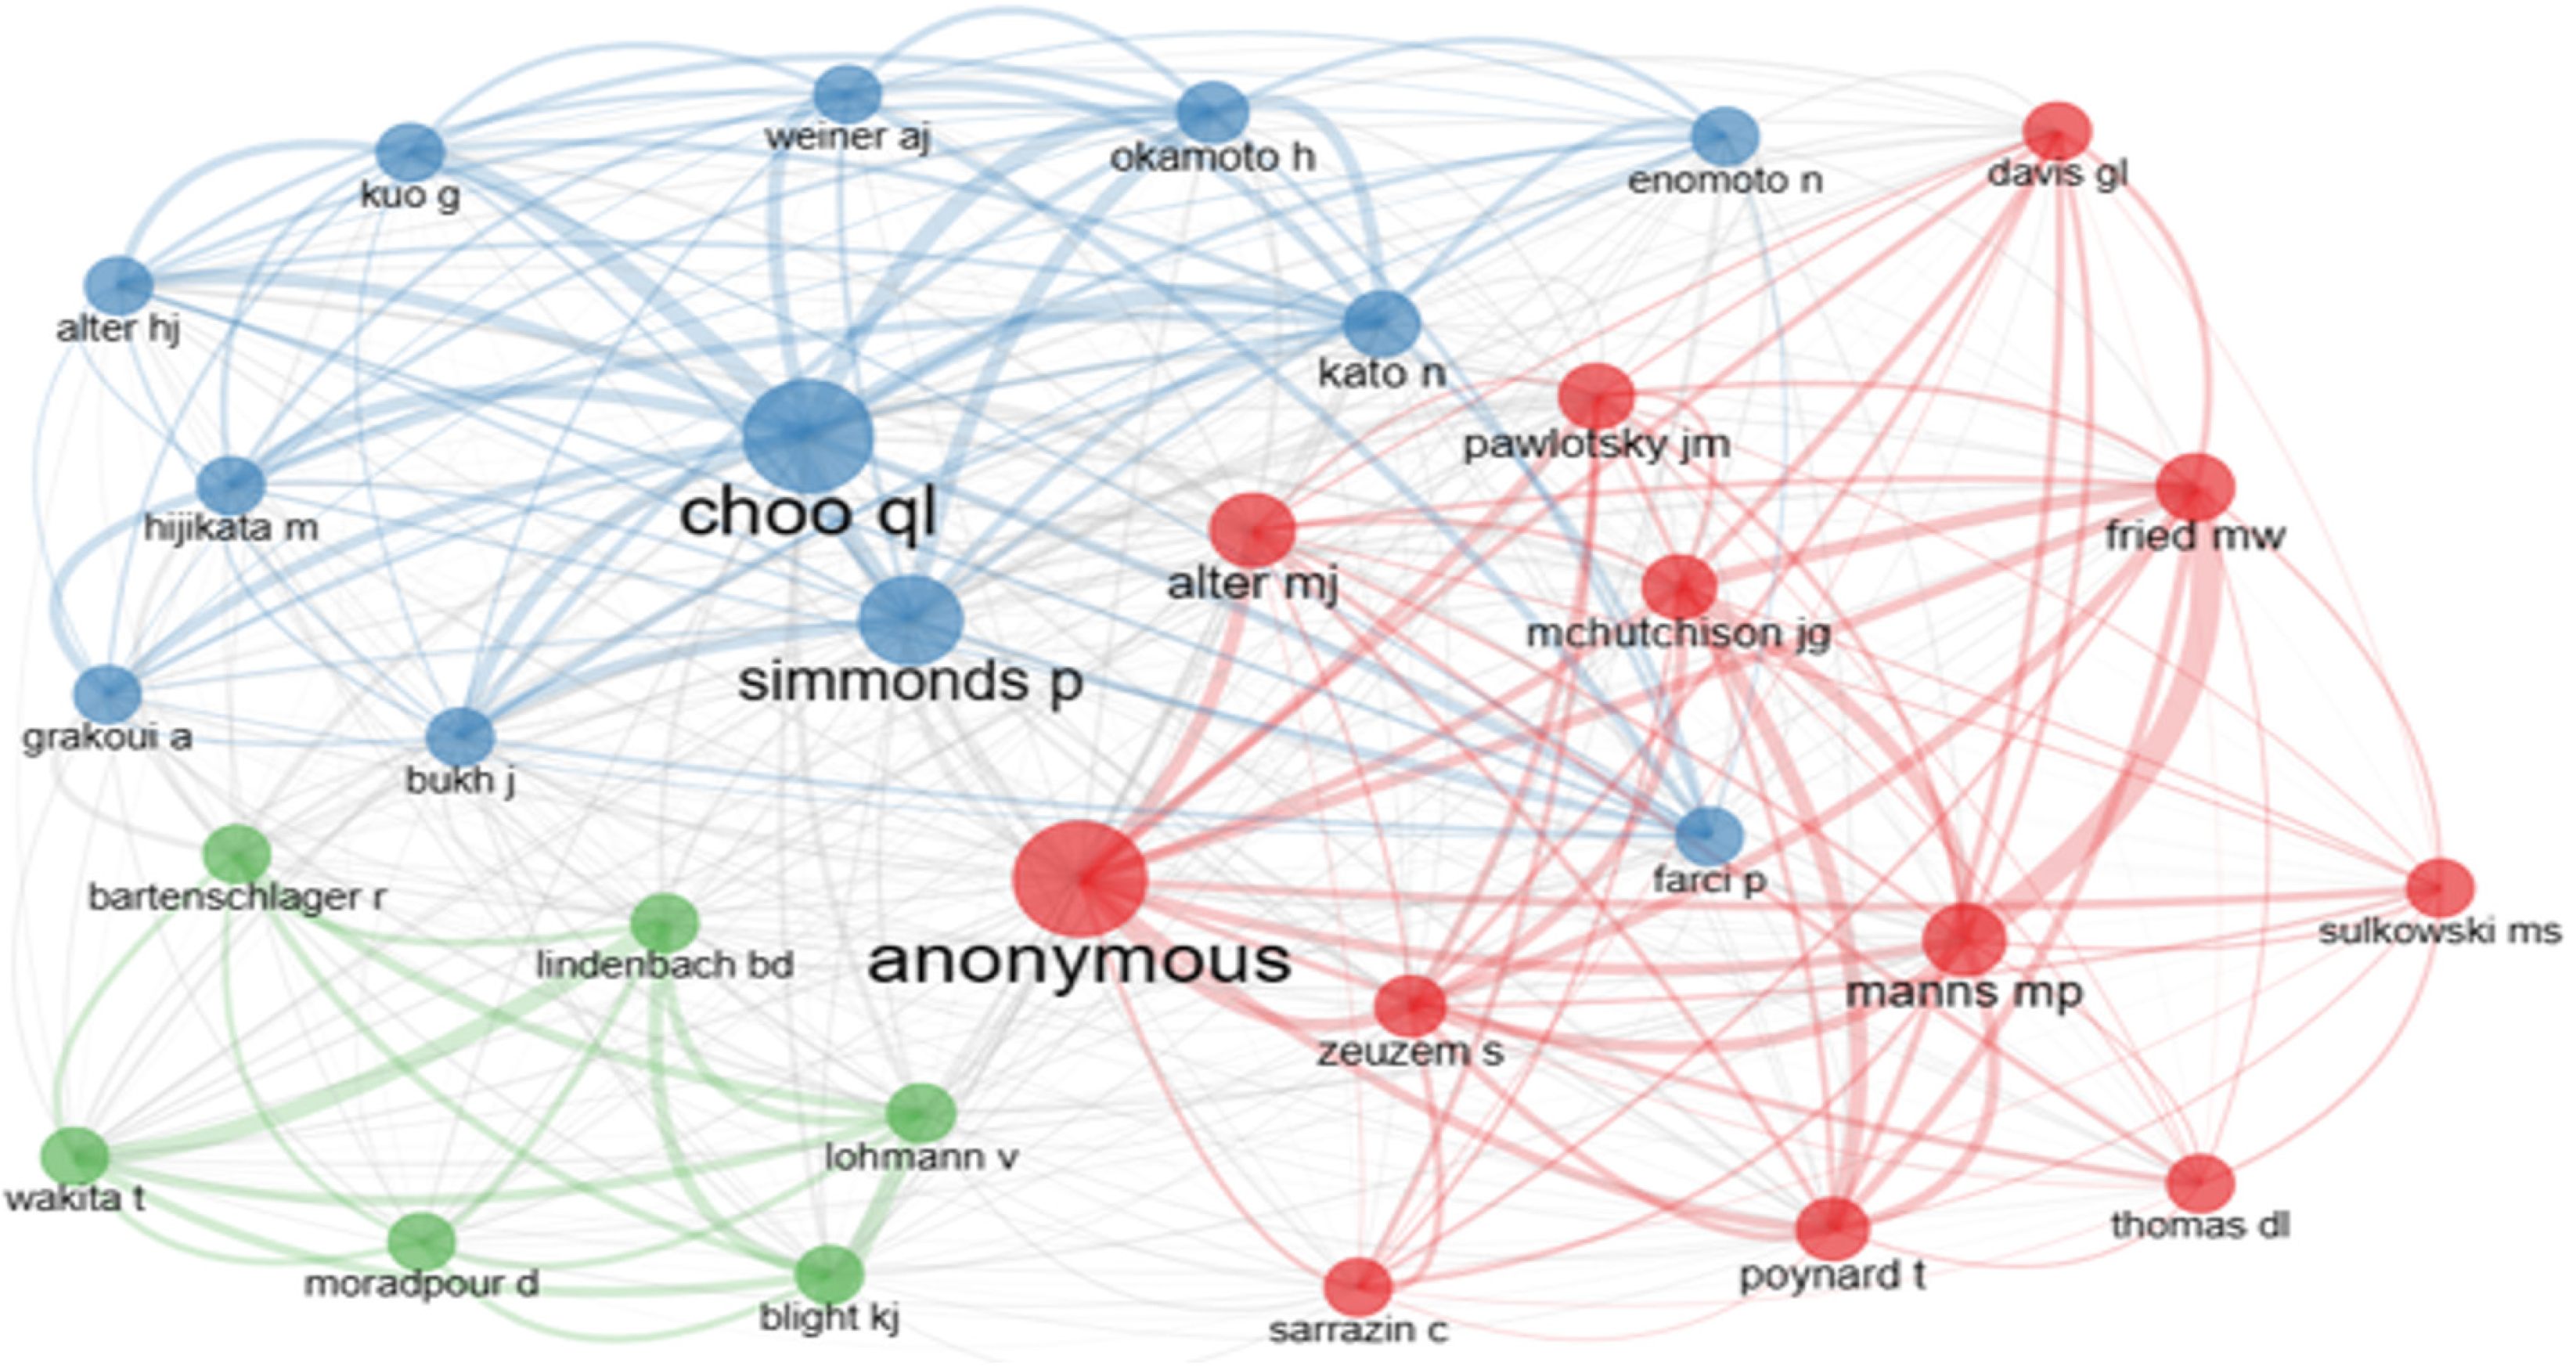
Figure 8 Authors co-citation network.
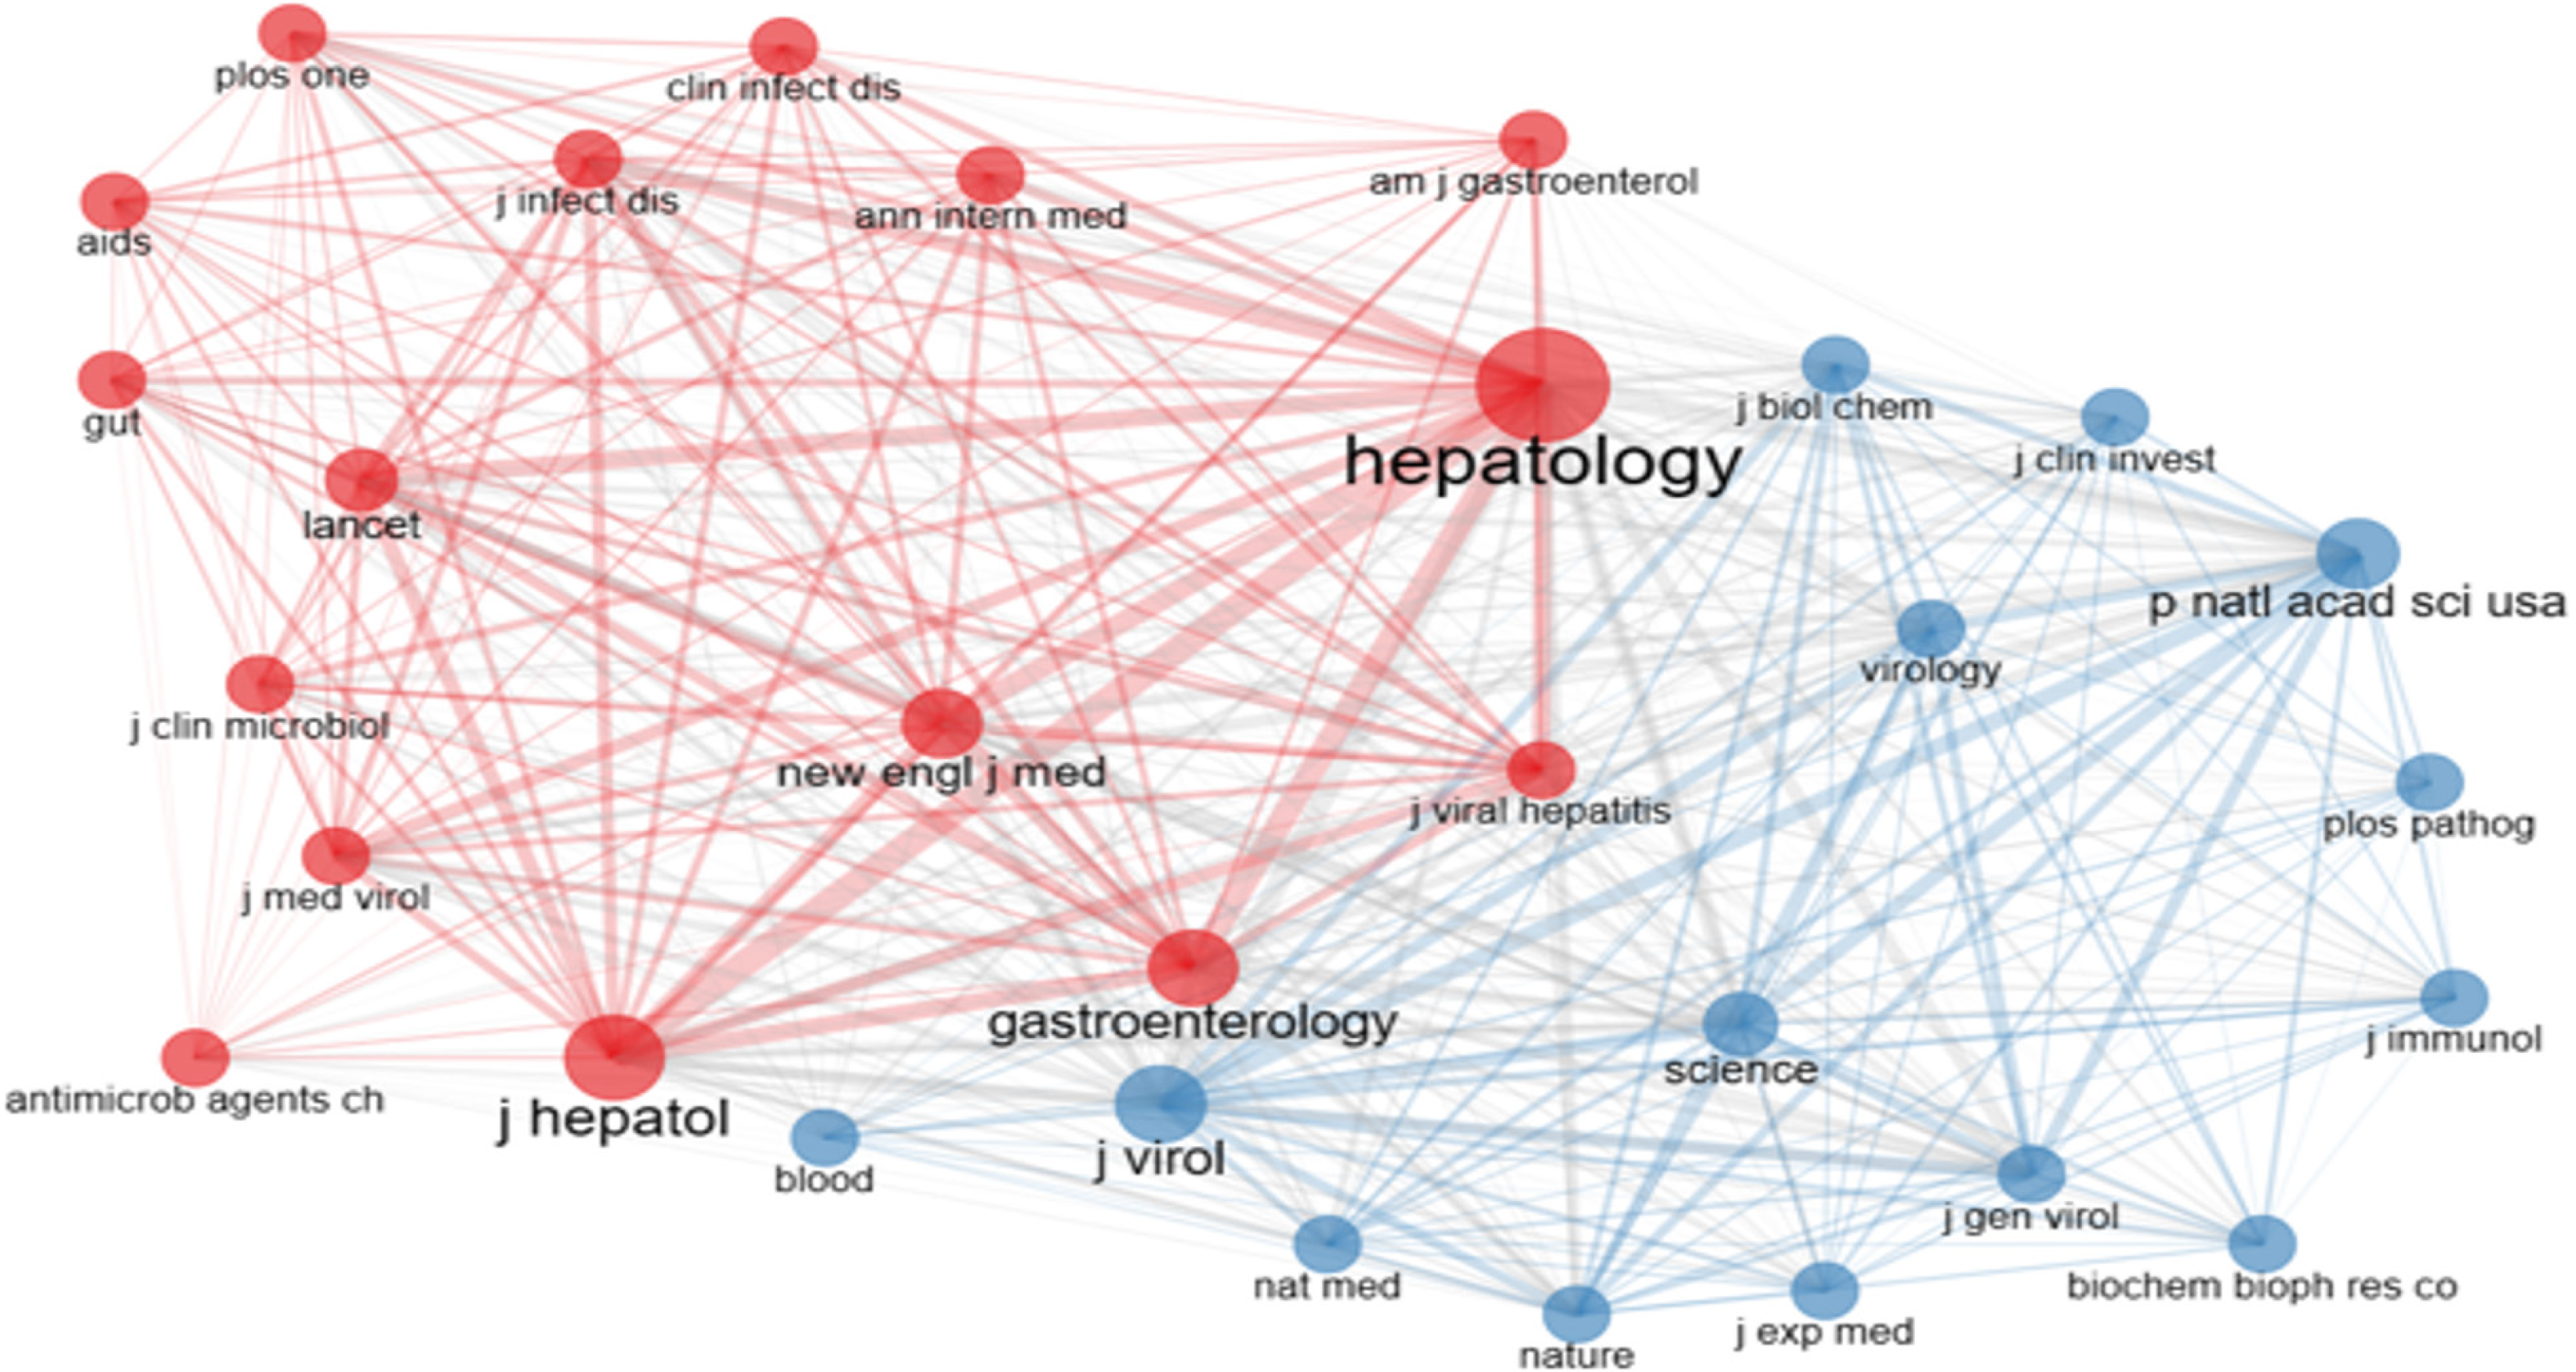
Figure 9 Sources co-citation network.
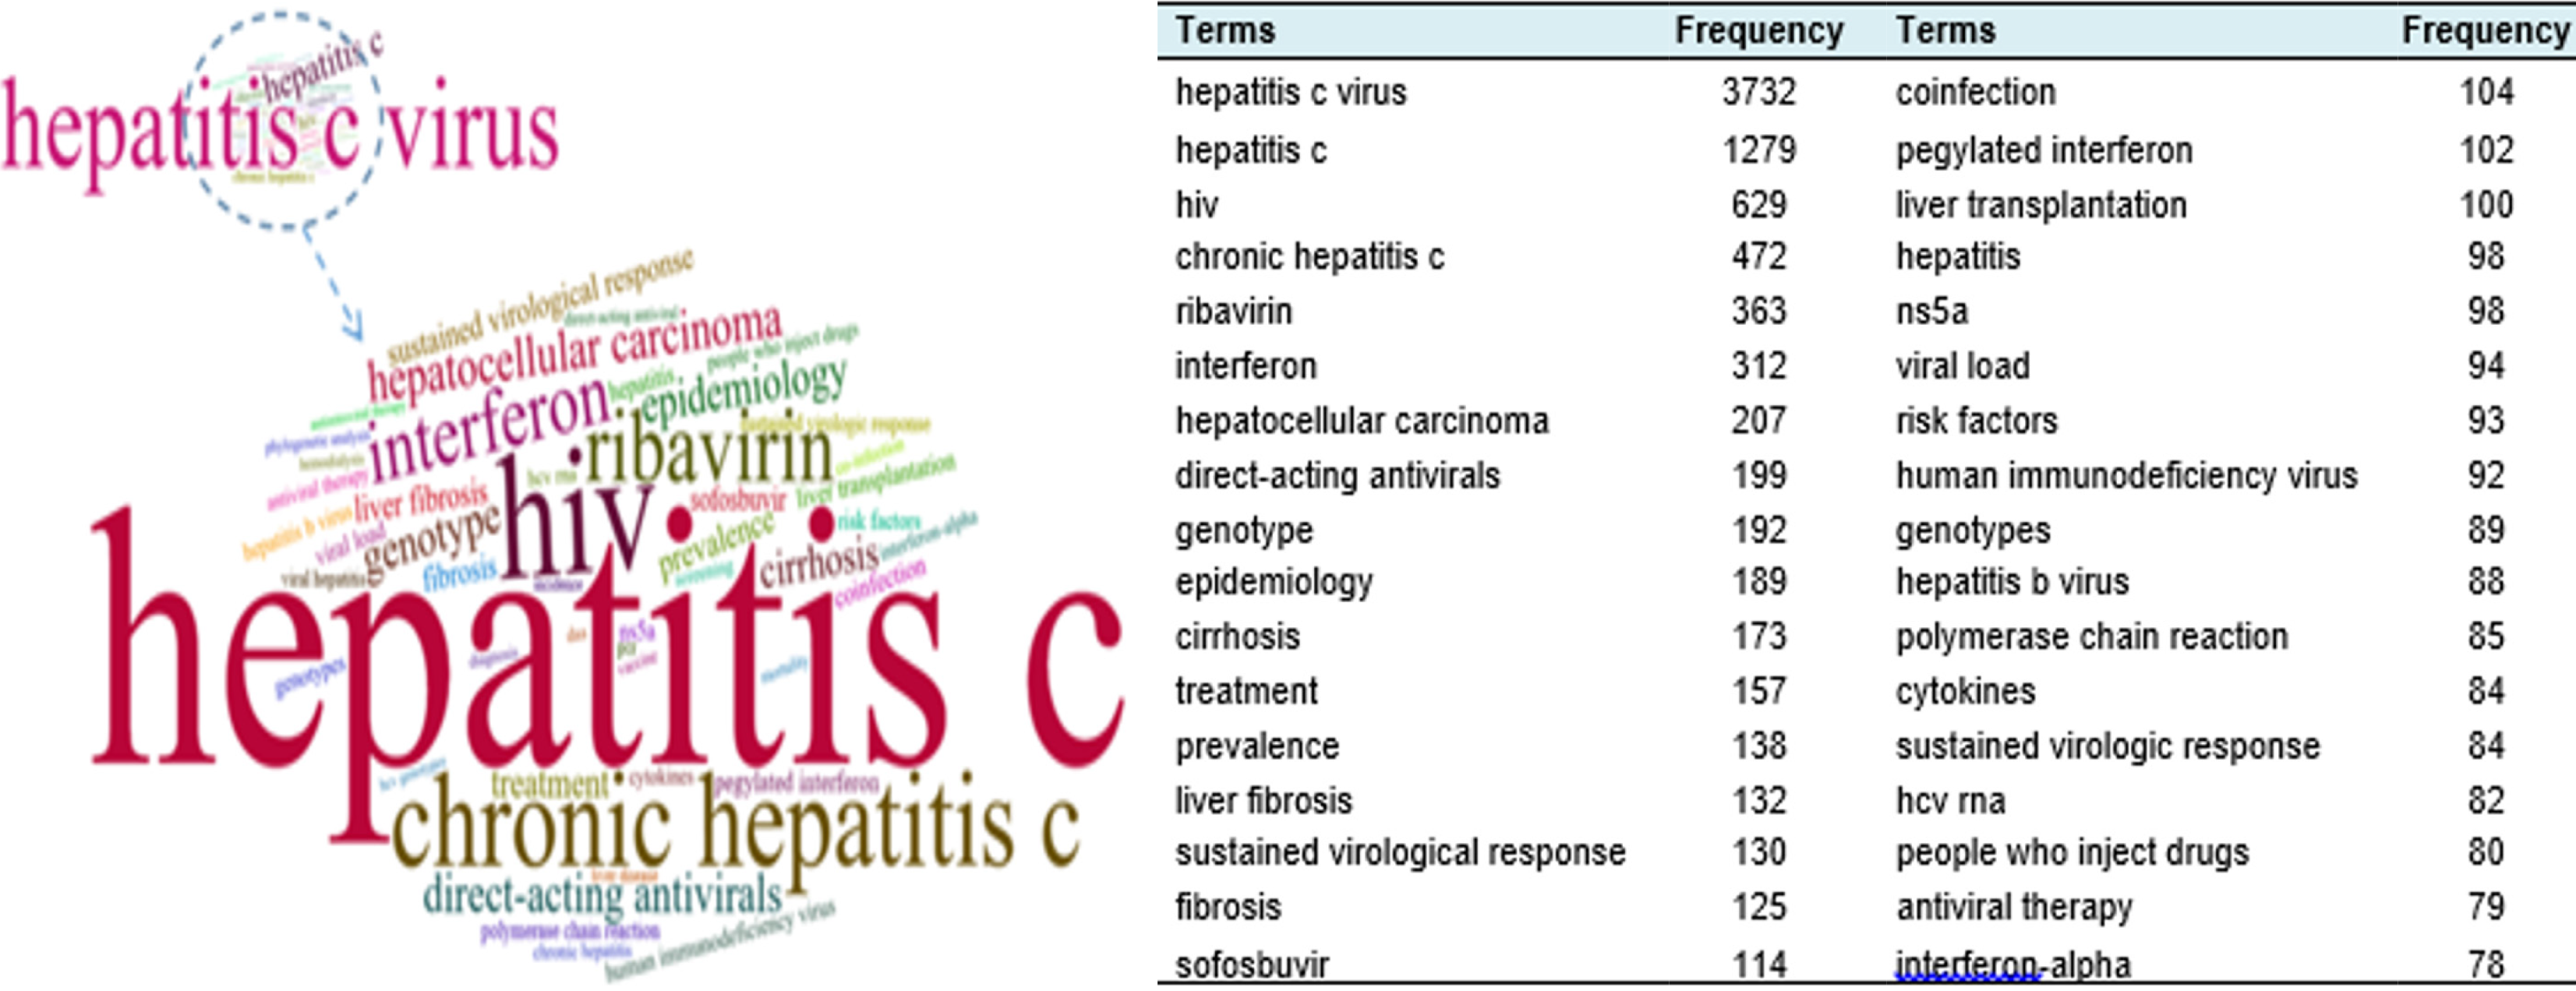
Figure 10 Word cloud.
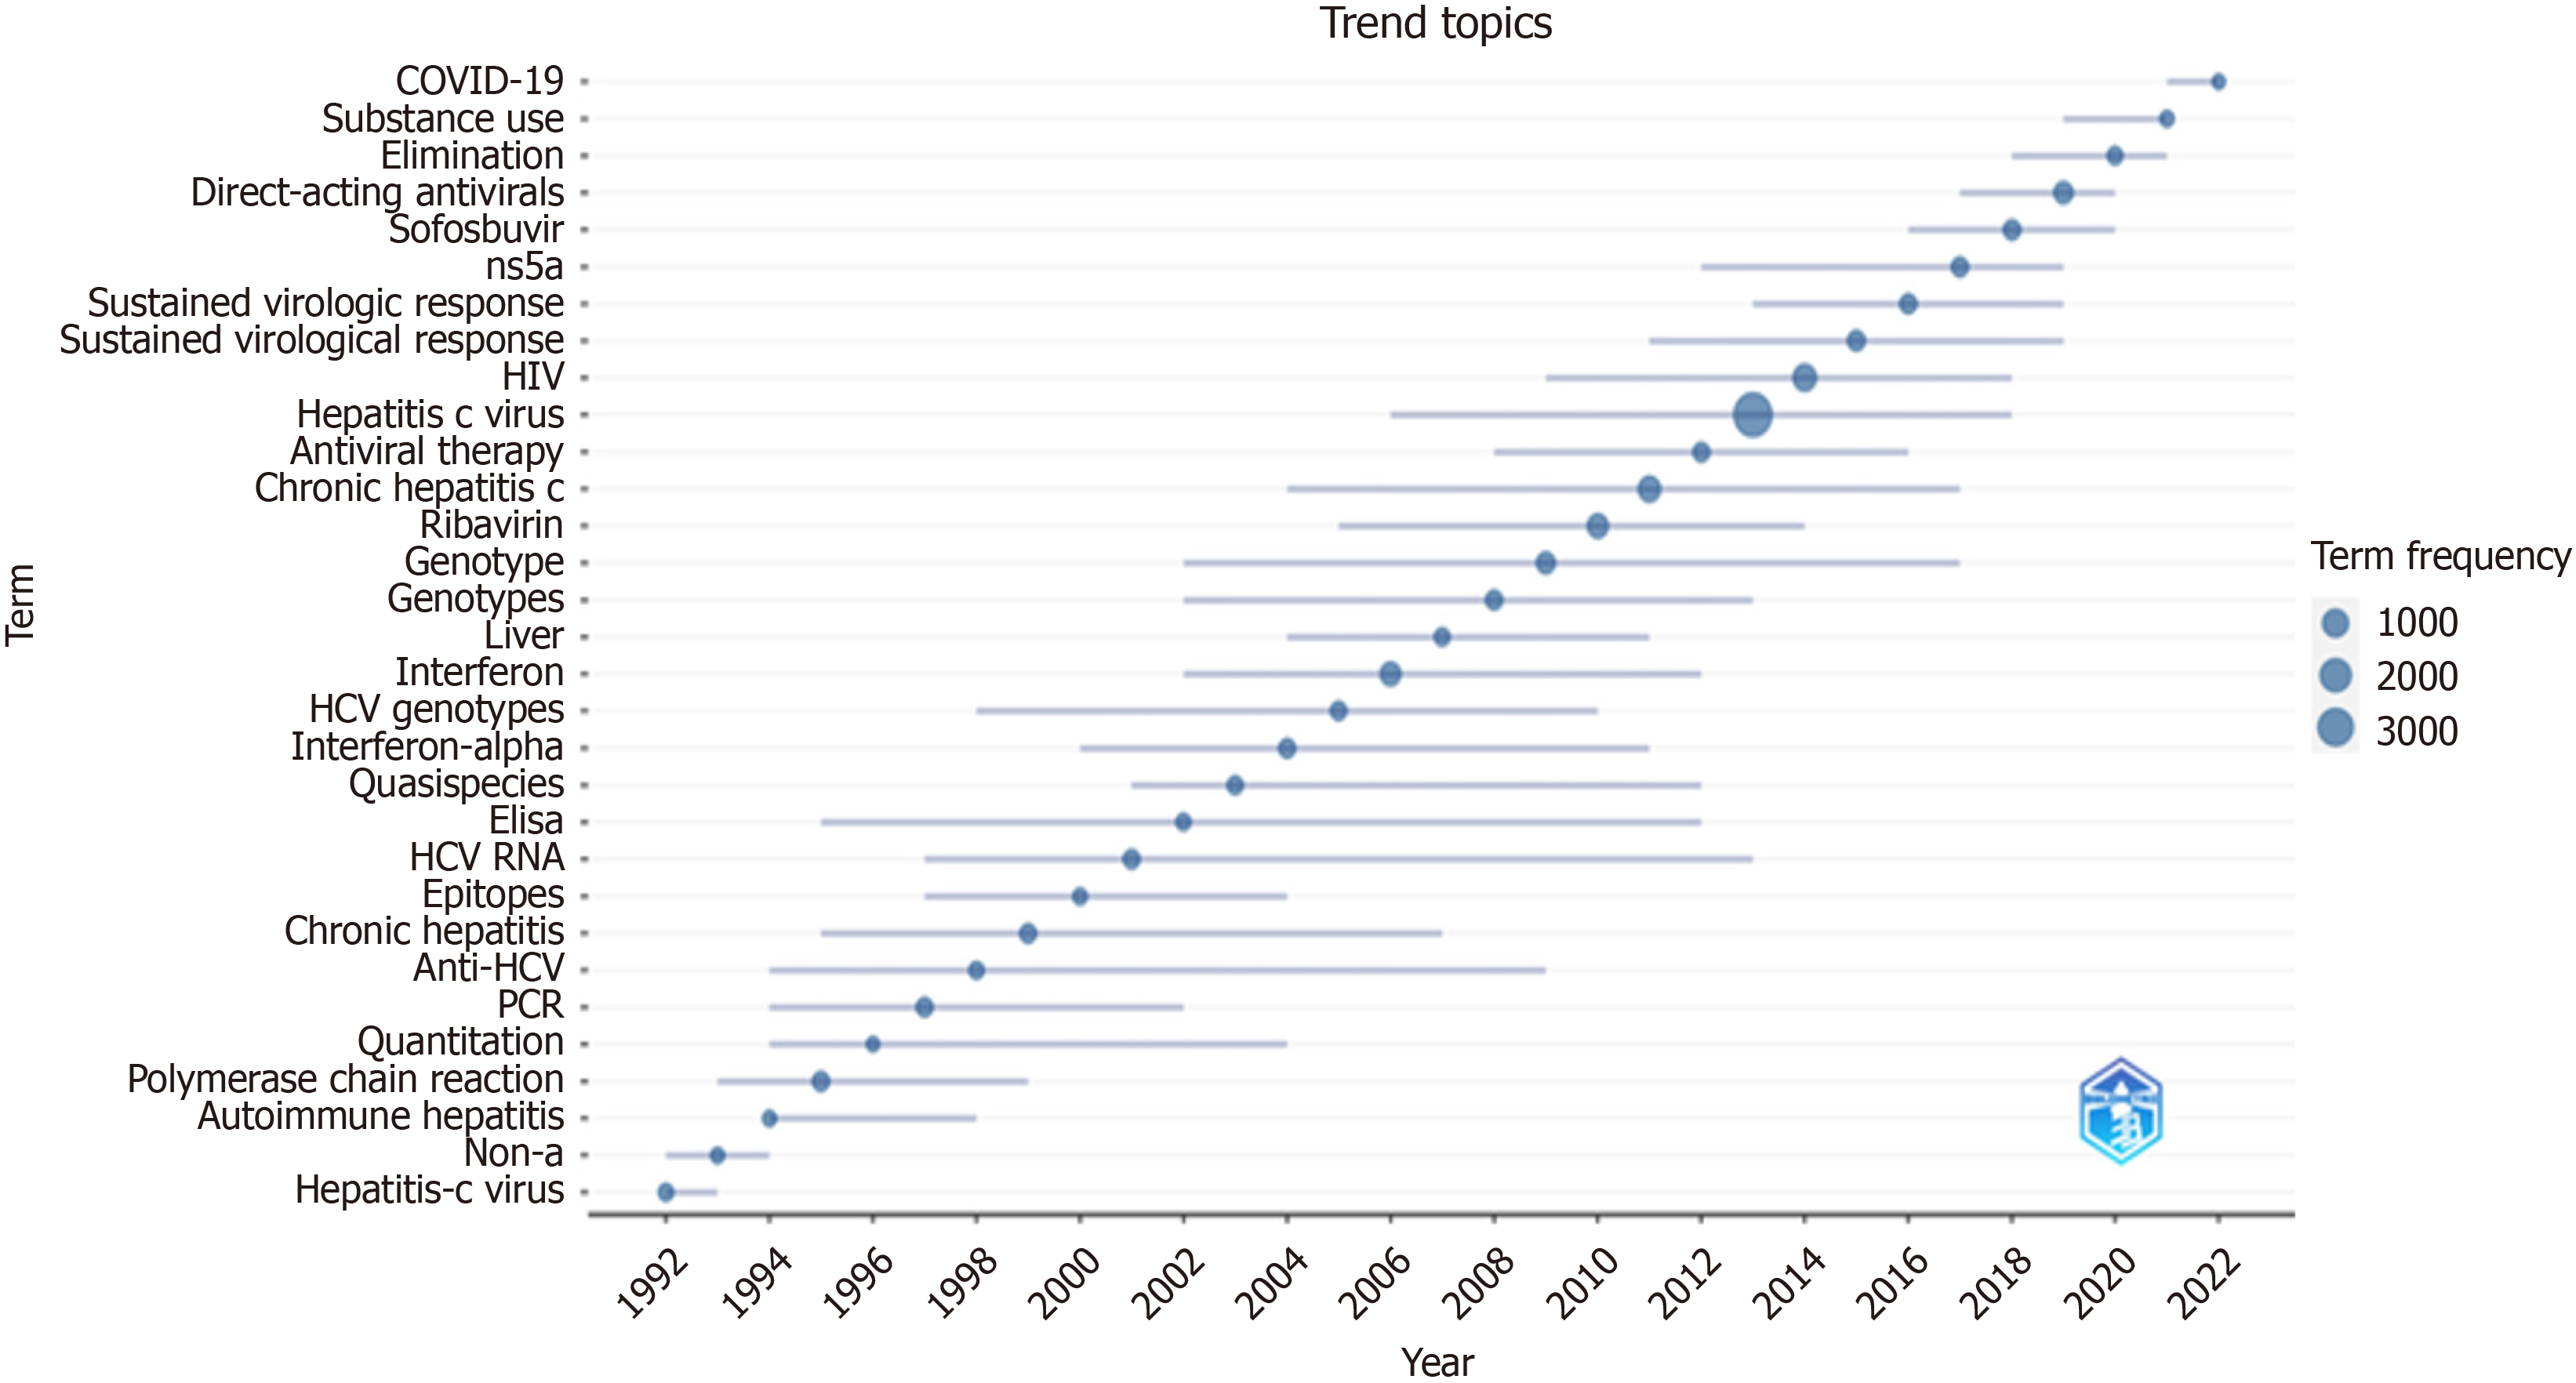
Figure 11 Trend topics.
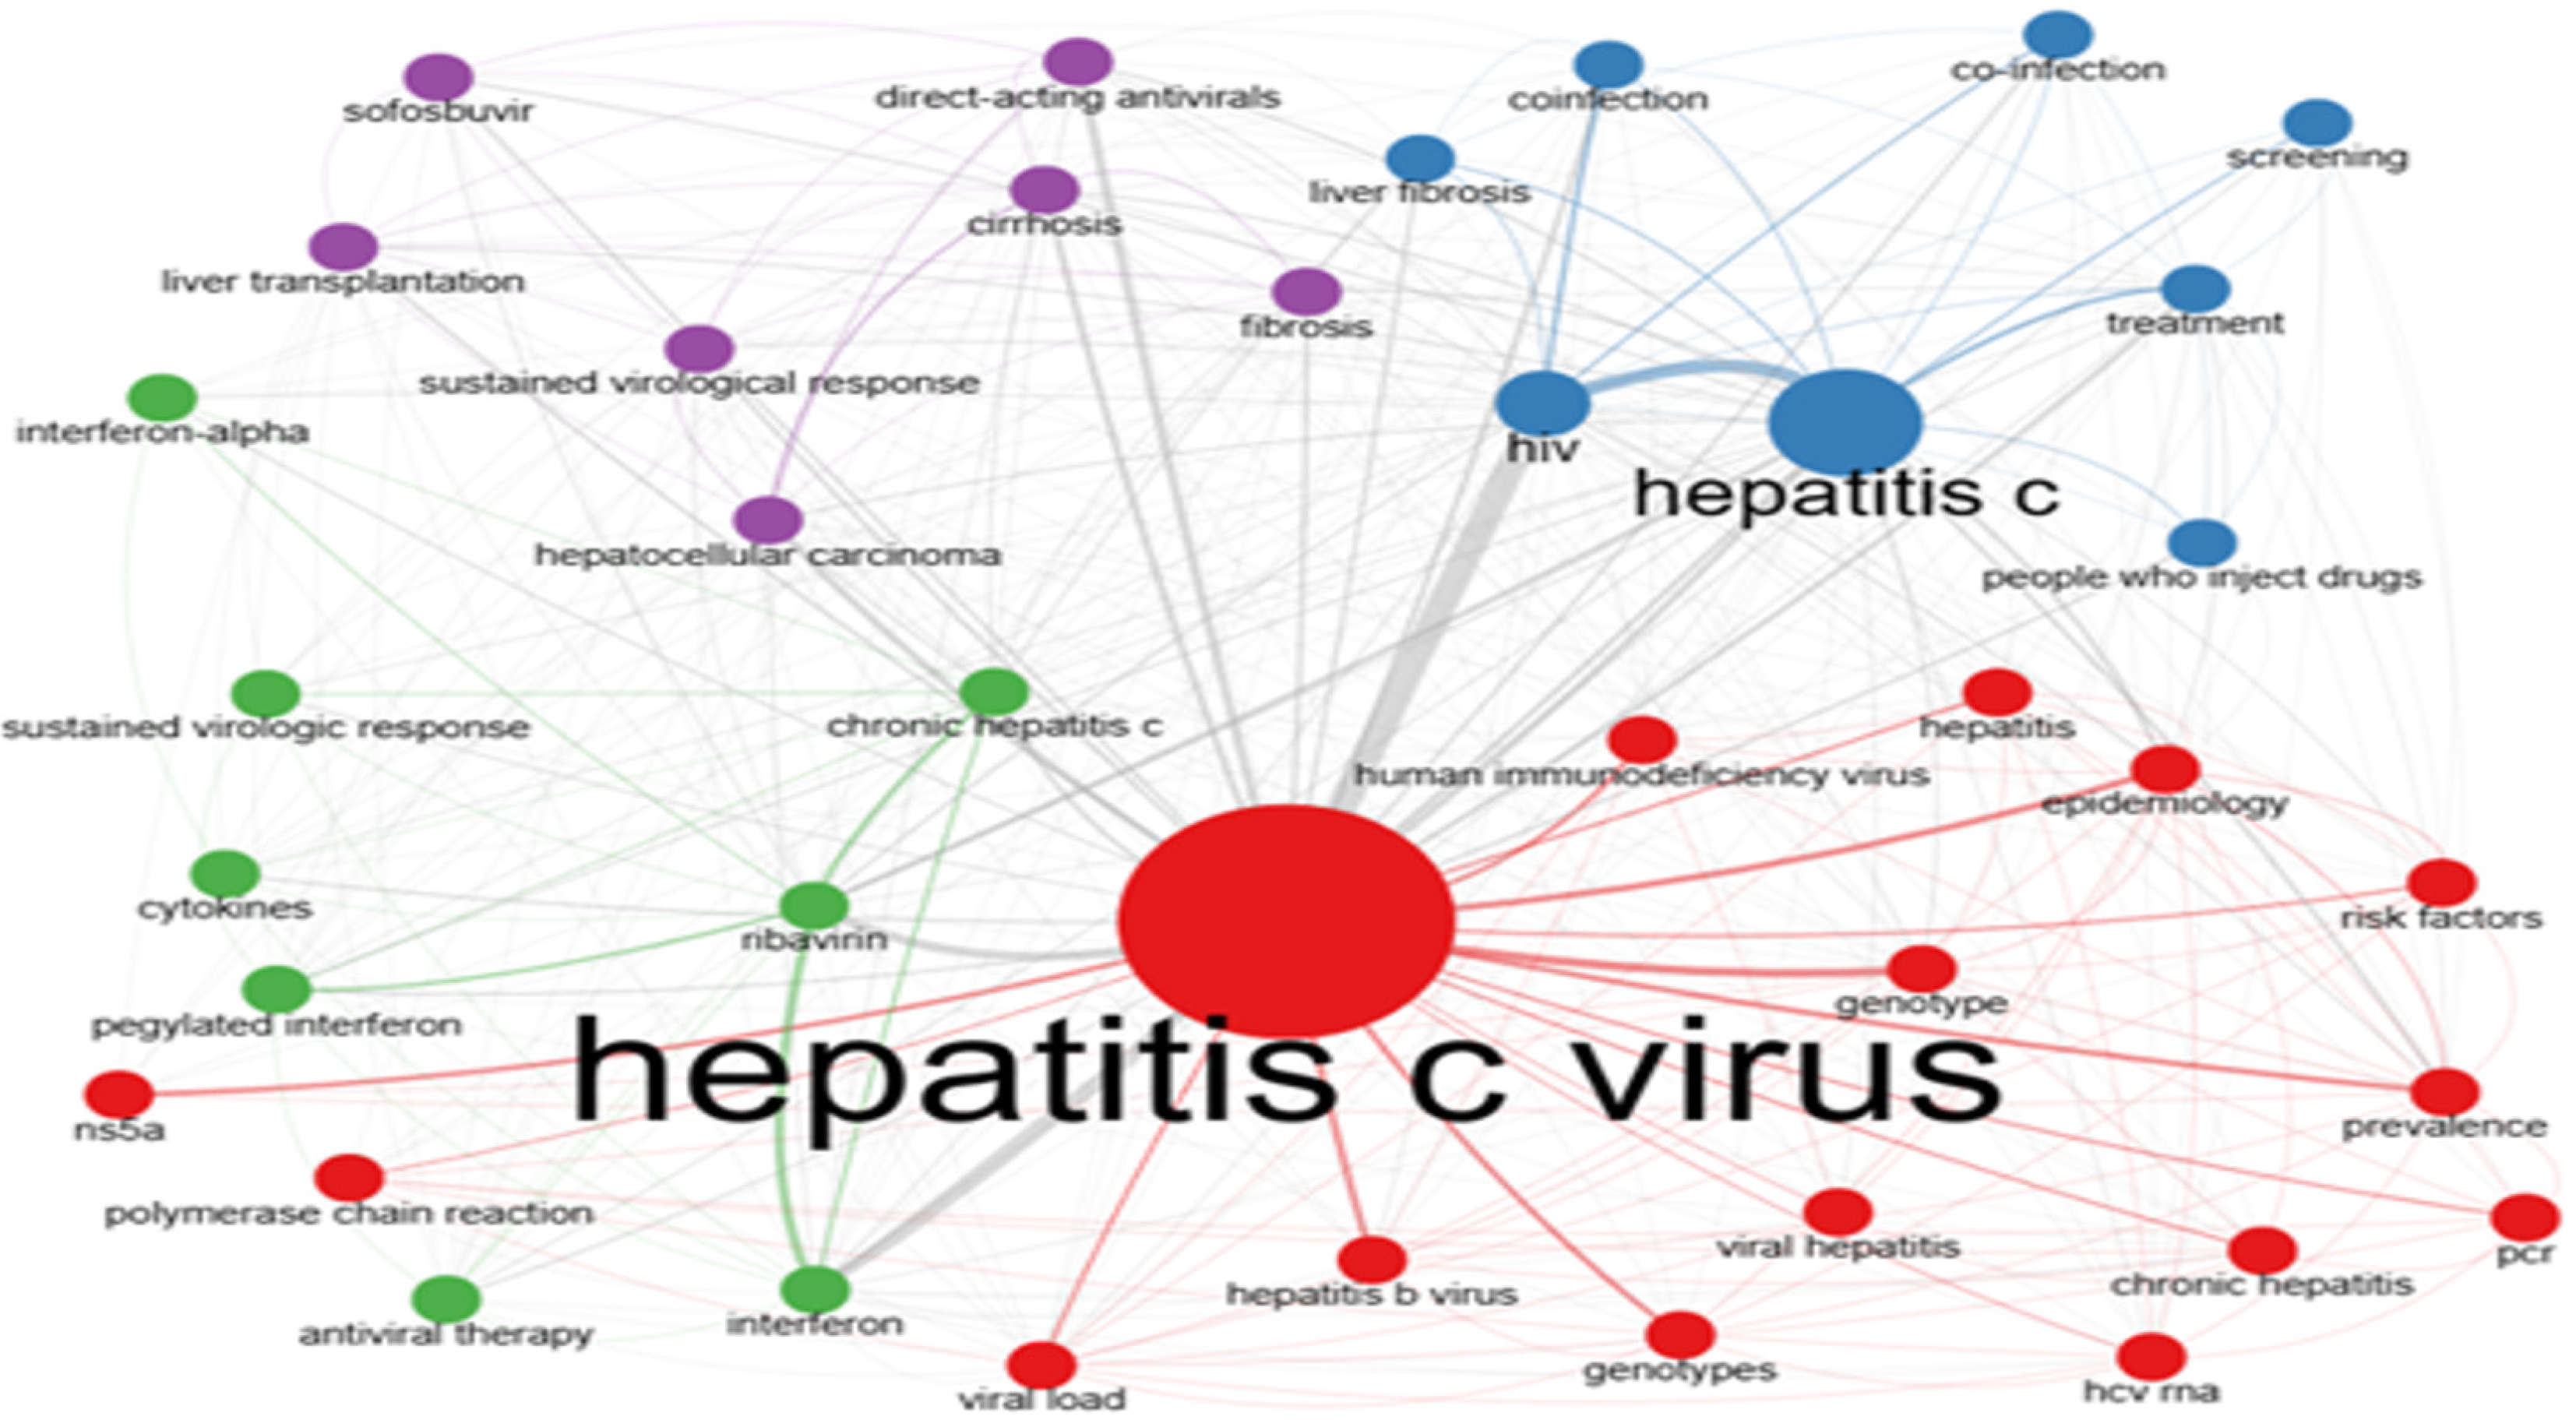
Figure 12 Authors’ keywords co-occurrence network.
Figure 13 Thematic map.
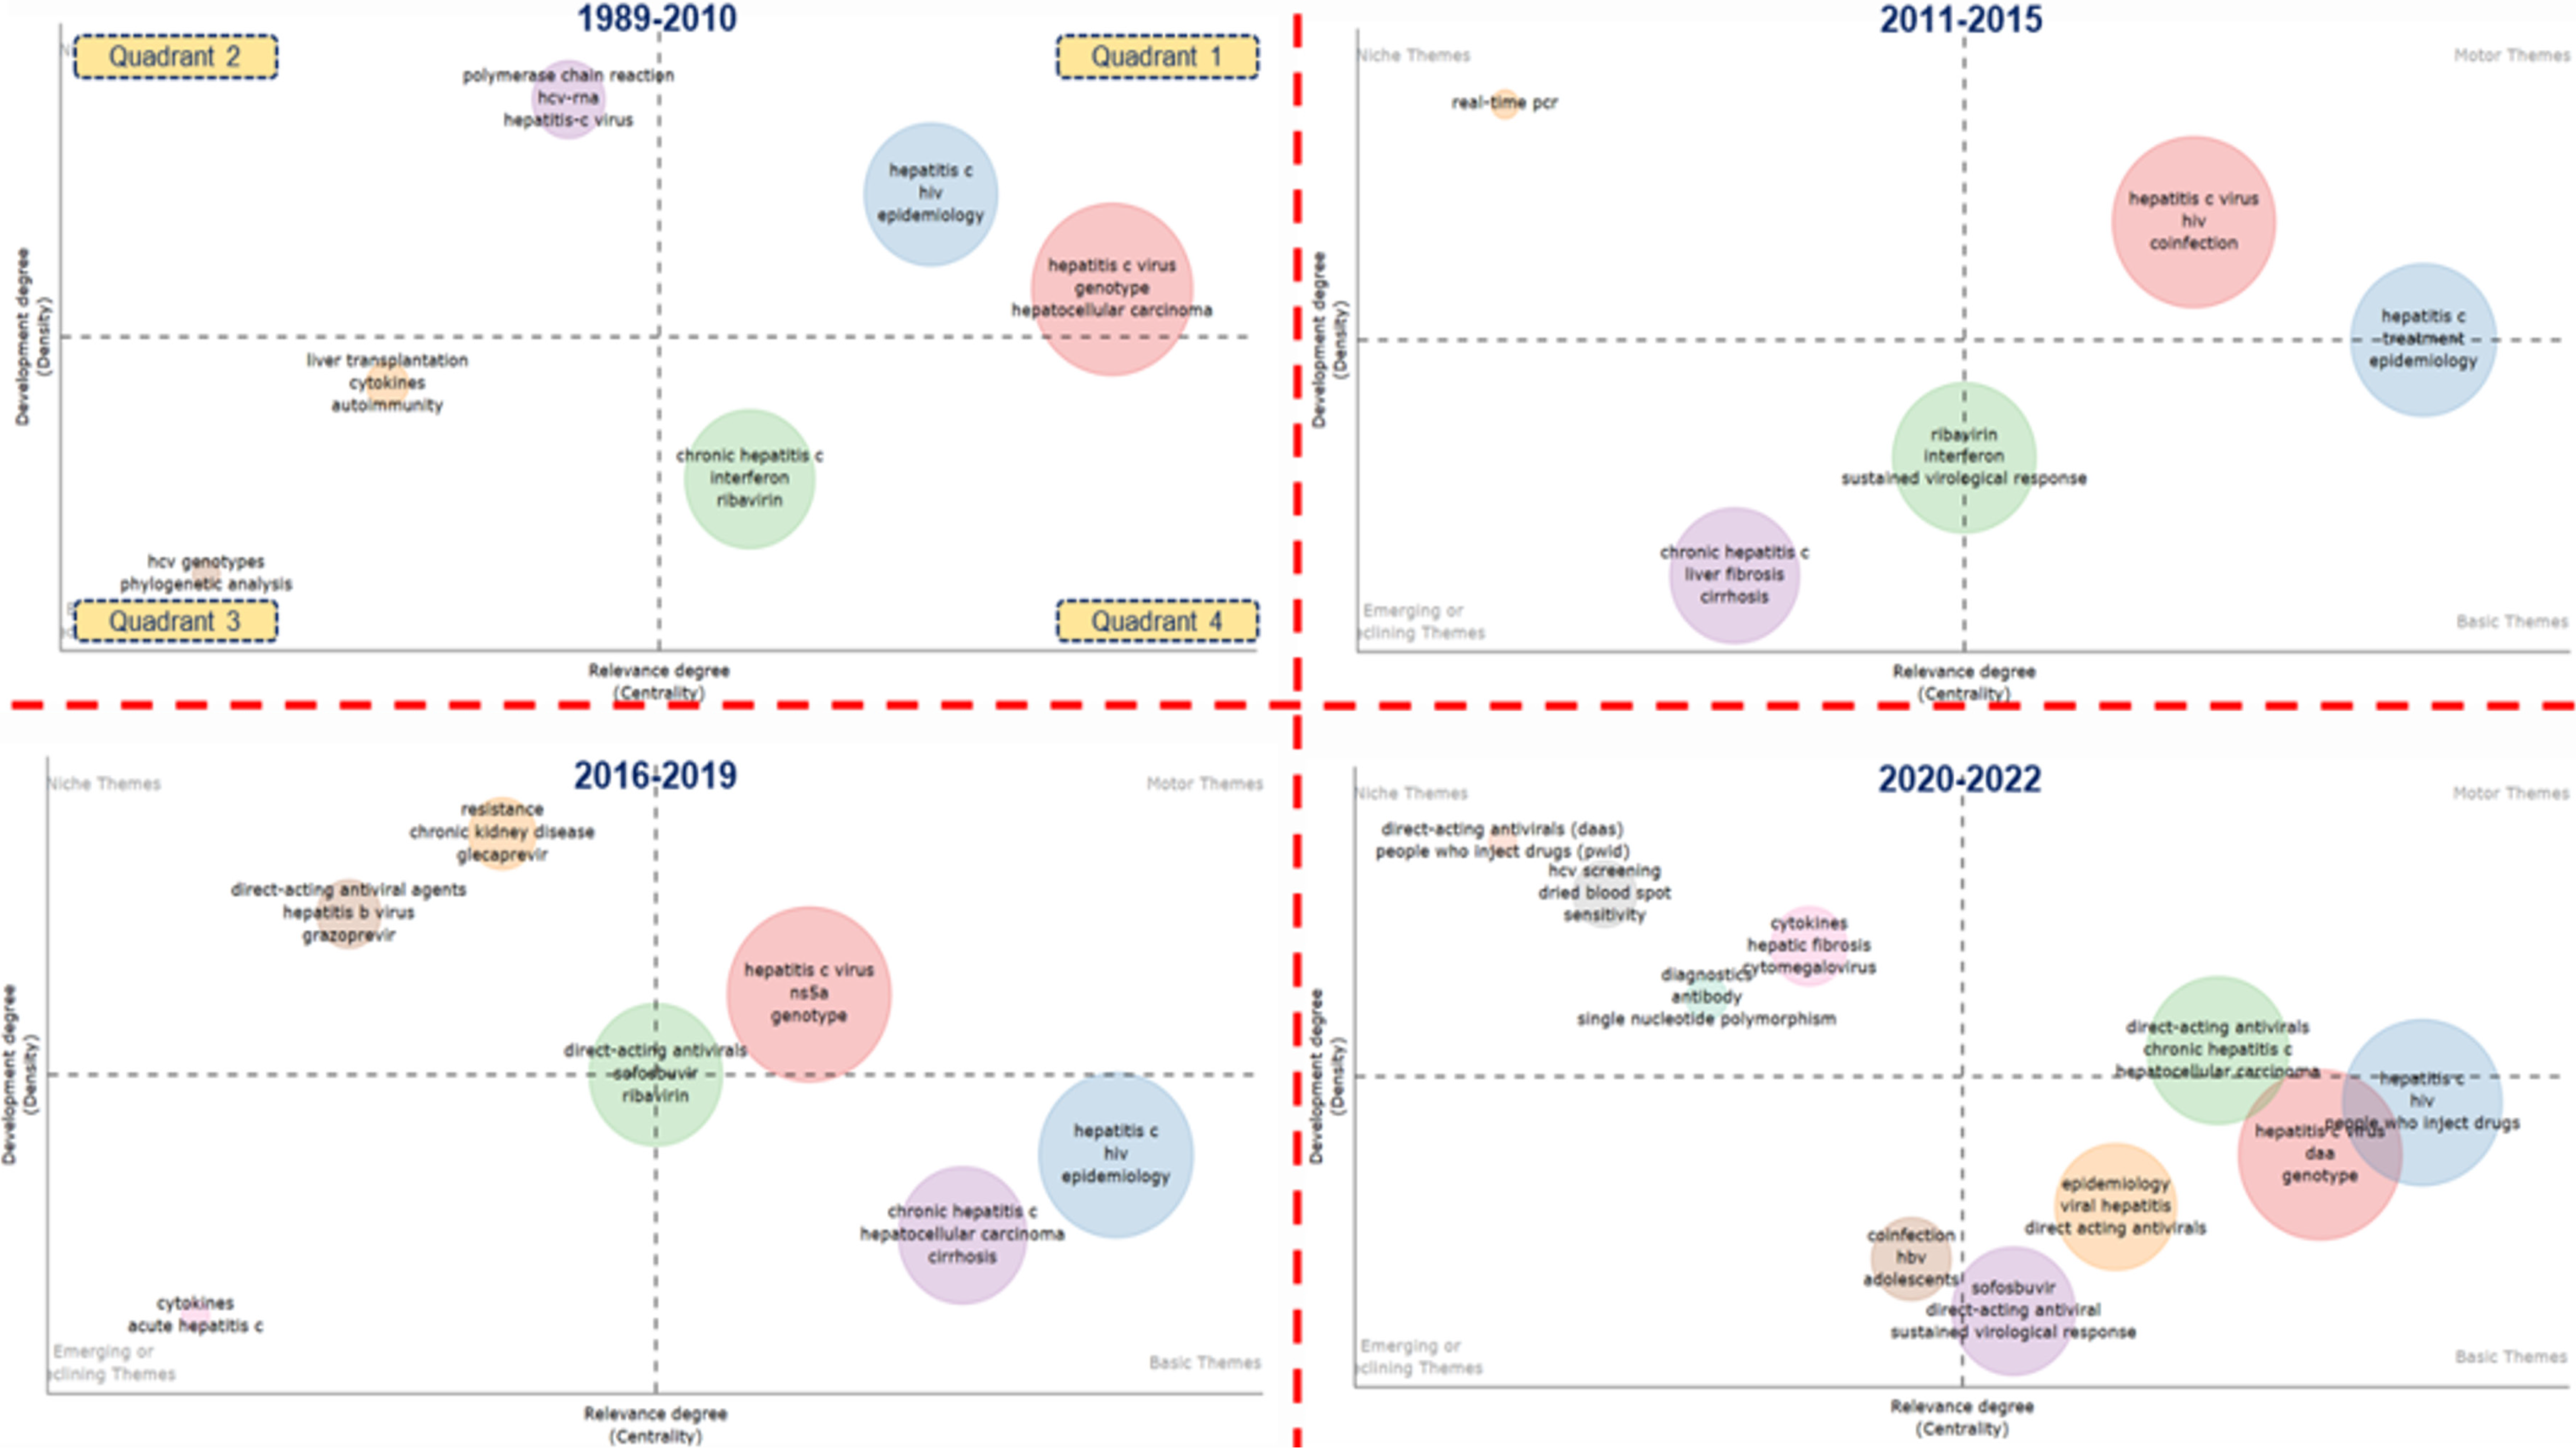
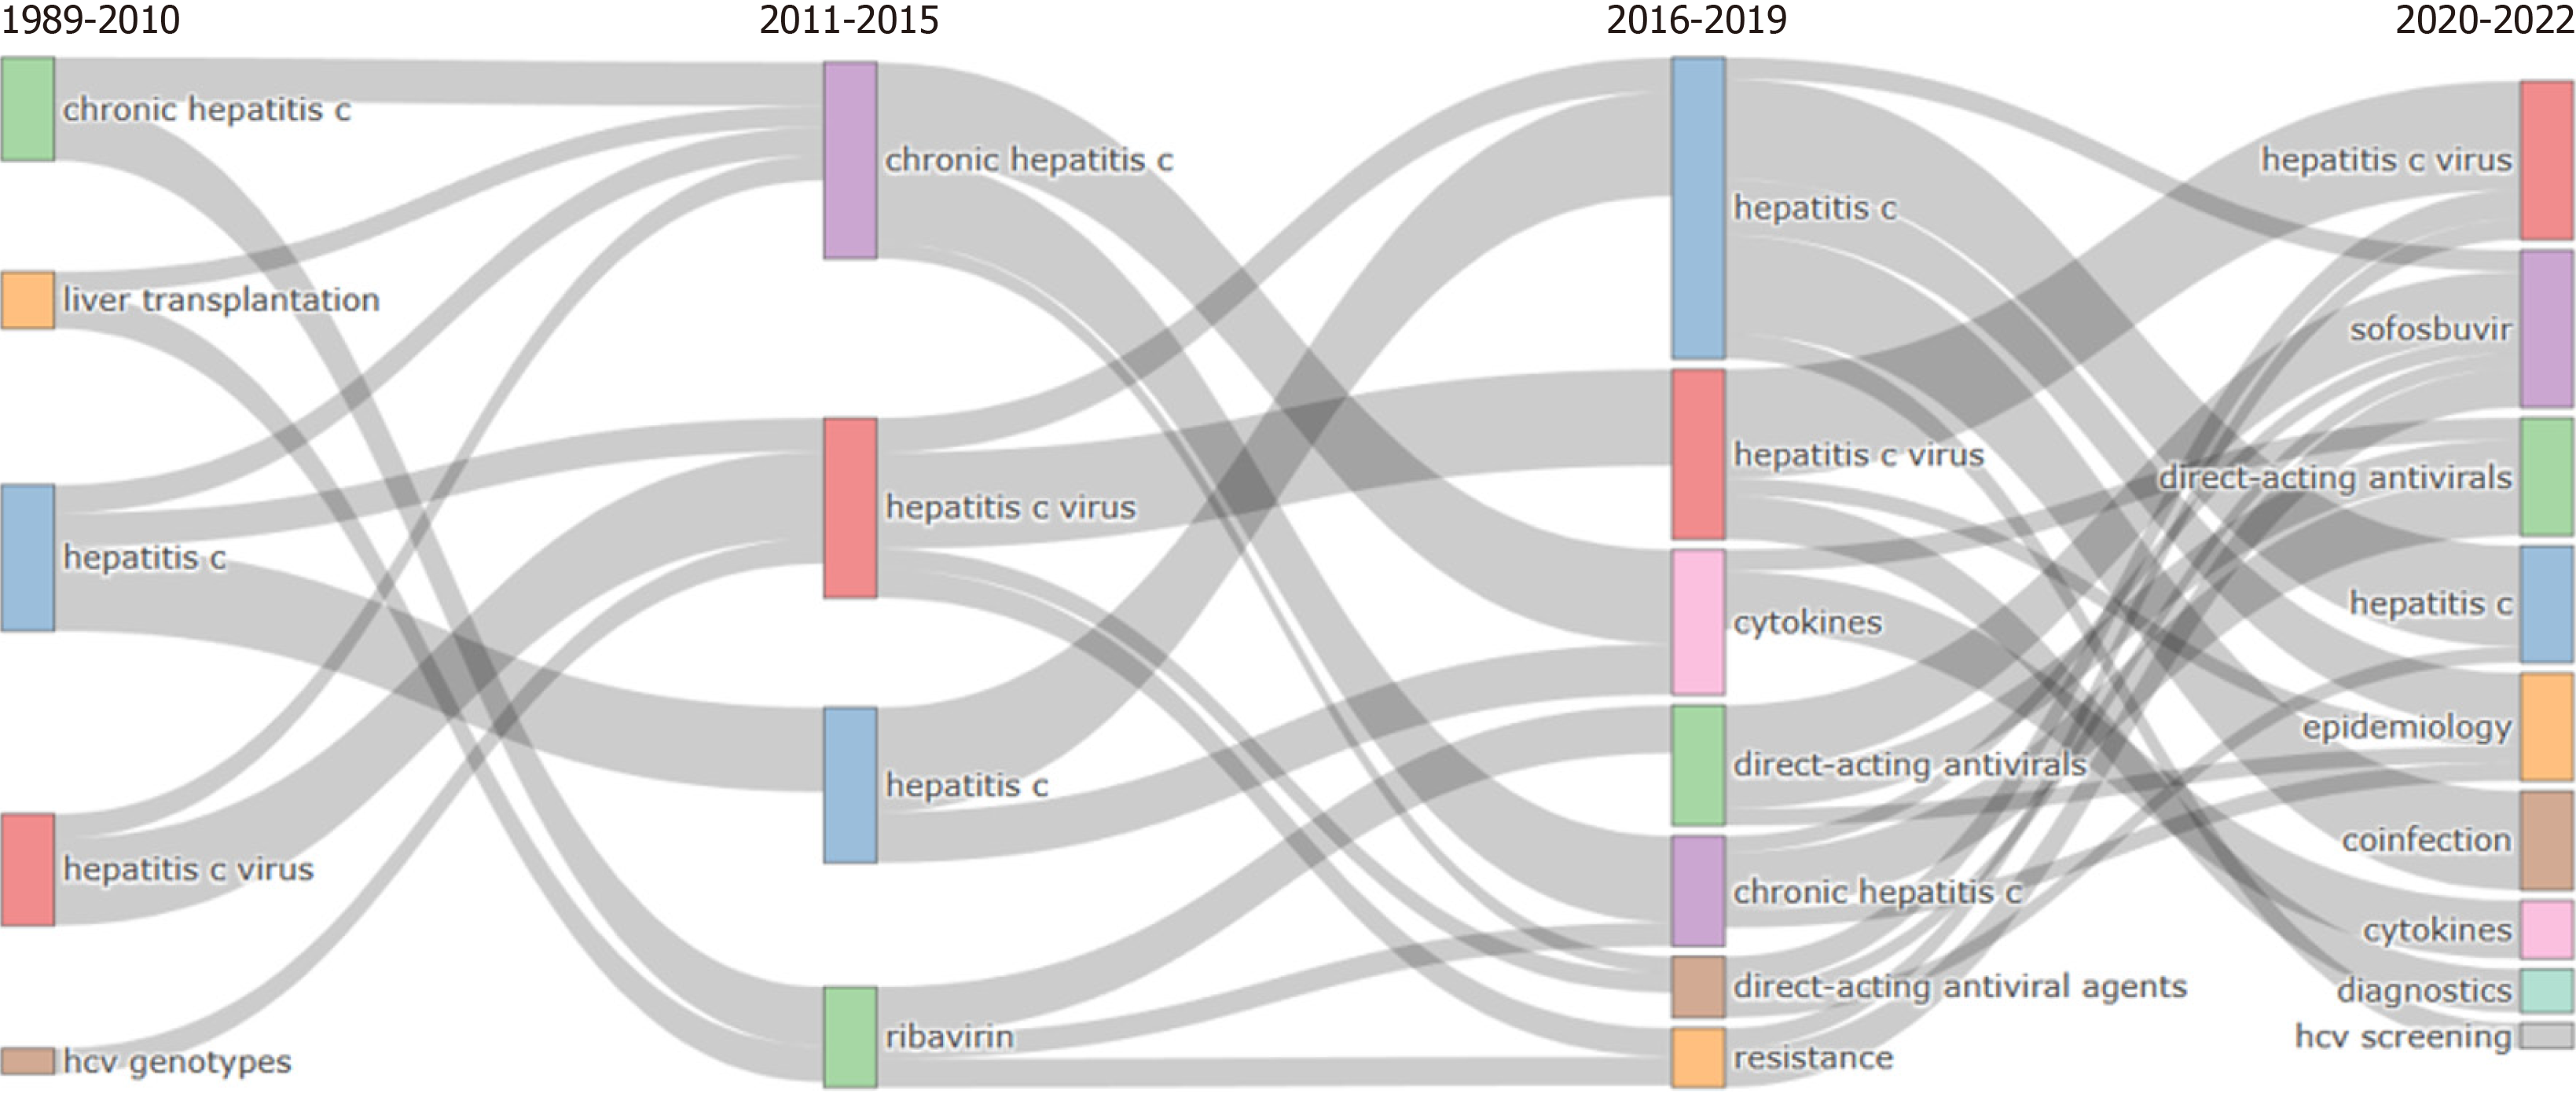
Figure 14 Thematic evolution (1989–2022).
- Citation: Tok D. Analysis of articles on hepatitis C by scientific mapping: 1989-2022. World J Clin Cases 2024; 12(20): 4301-4316
- URL: https://www.wjgnet.com/2307-8960/full/v12/i20/4301.htm
- DOI: https://dx.doi.org/10.12998/wjcc.v12.i20.4301


