Copyright
©The Author(s) 2024.
World J Clin Cases. Jul 16, 2024; 12(20): 4239-4246
Published online Jul 16, 2024. doi: 10.12998/wjcc.v12.i20.4239
Published online Jul 16, 2024. doi: 10.12998/wjcc.v12.i20.4239
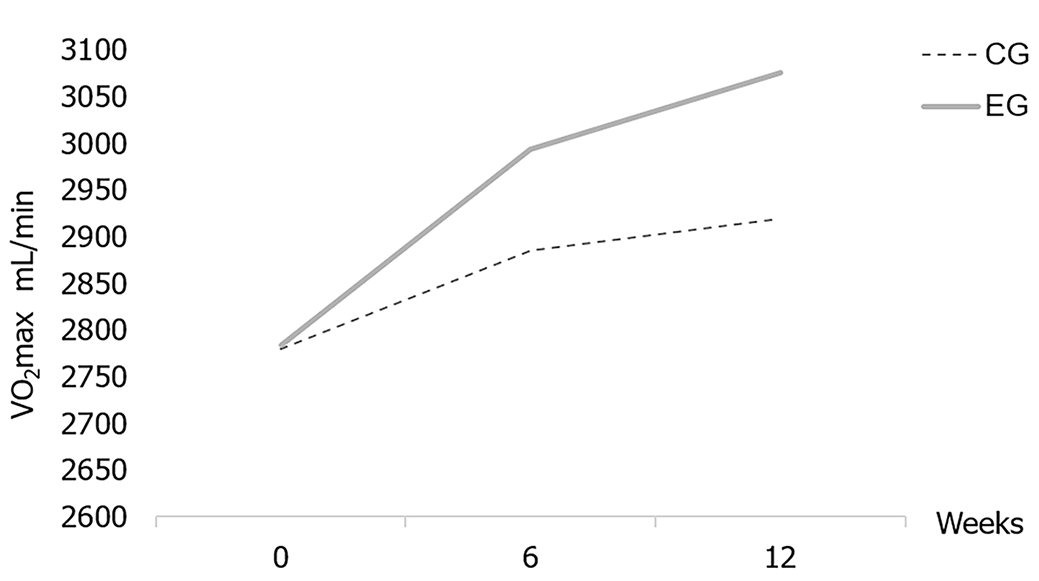
Figure 1 Change of maximal oxygen uptake.
Experimental group (EG) compared with the control group (CG), P < 0.05. VO2max: Maximal oxygen uptake.
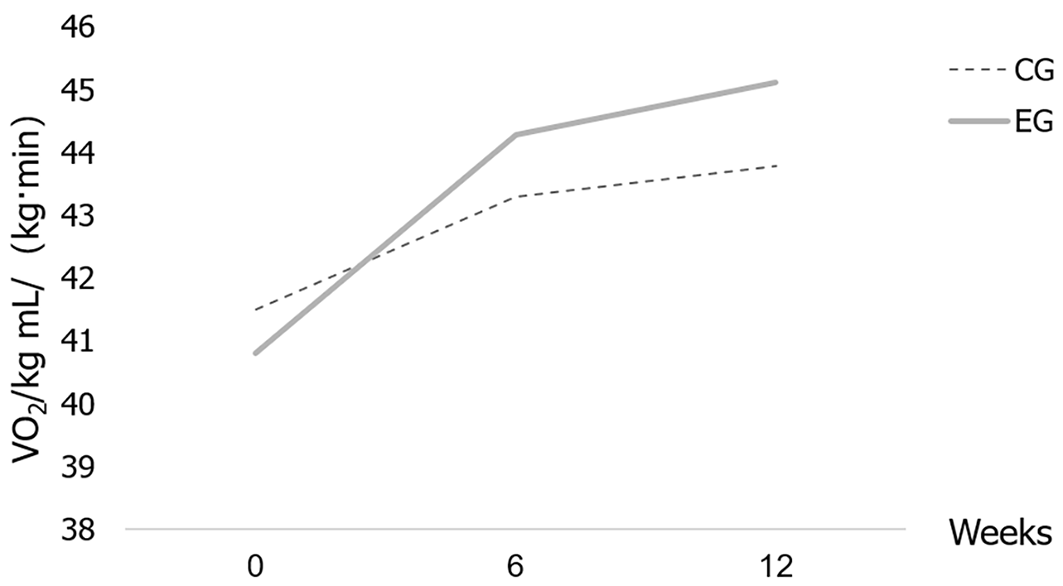
Figure 2 Change of relative maximal oxygen uptake.
Experimental group (EG) compared with the control group (CG), P < 0.05. VO2max: Maximal oxygen uptake.
- Citation: Luo H, Zhao DY, Li J. Impact of a 12-wk physical conditioning program on the aerobic capacity of aviation cadets. World J Clin Cases 2024; 12(20): 4239-4246
- URL: https://www.wjgnet.com/2307-8960/full/v12/i20/4239.htm
- DOI: https://dx.doi.org/10.12998/wjcc.v12.i20.4239


