Copyright
©The Author(s) 2024.
World J Clin Cases. Jul 16, 2024; 12(20): 4154-4165
Published online Jul 16, 2024. doi: 10.12998/wjcc.v12.i20.4154
Published online Jul 16, 2024. doi: 10.12998/wjcc.v12.i20.4154
Figure 1 X-ray imaging manifestations corresponding to different X-ray grades.
A-D: X-ray grades 1, 2, 3, and 4, respectively.
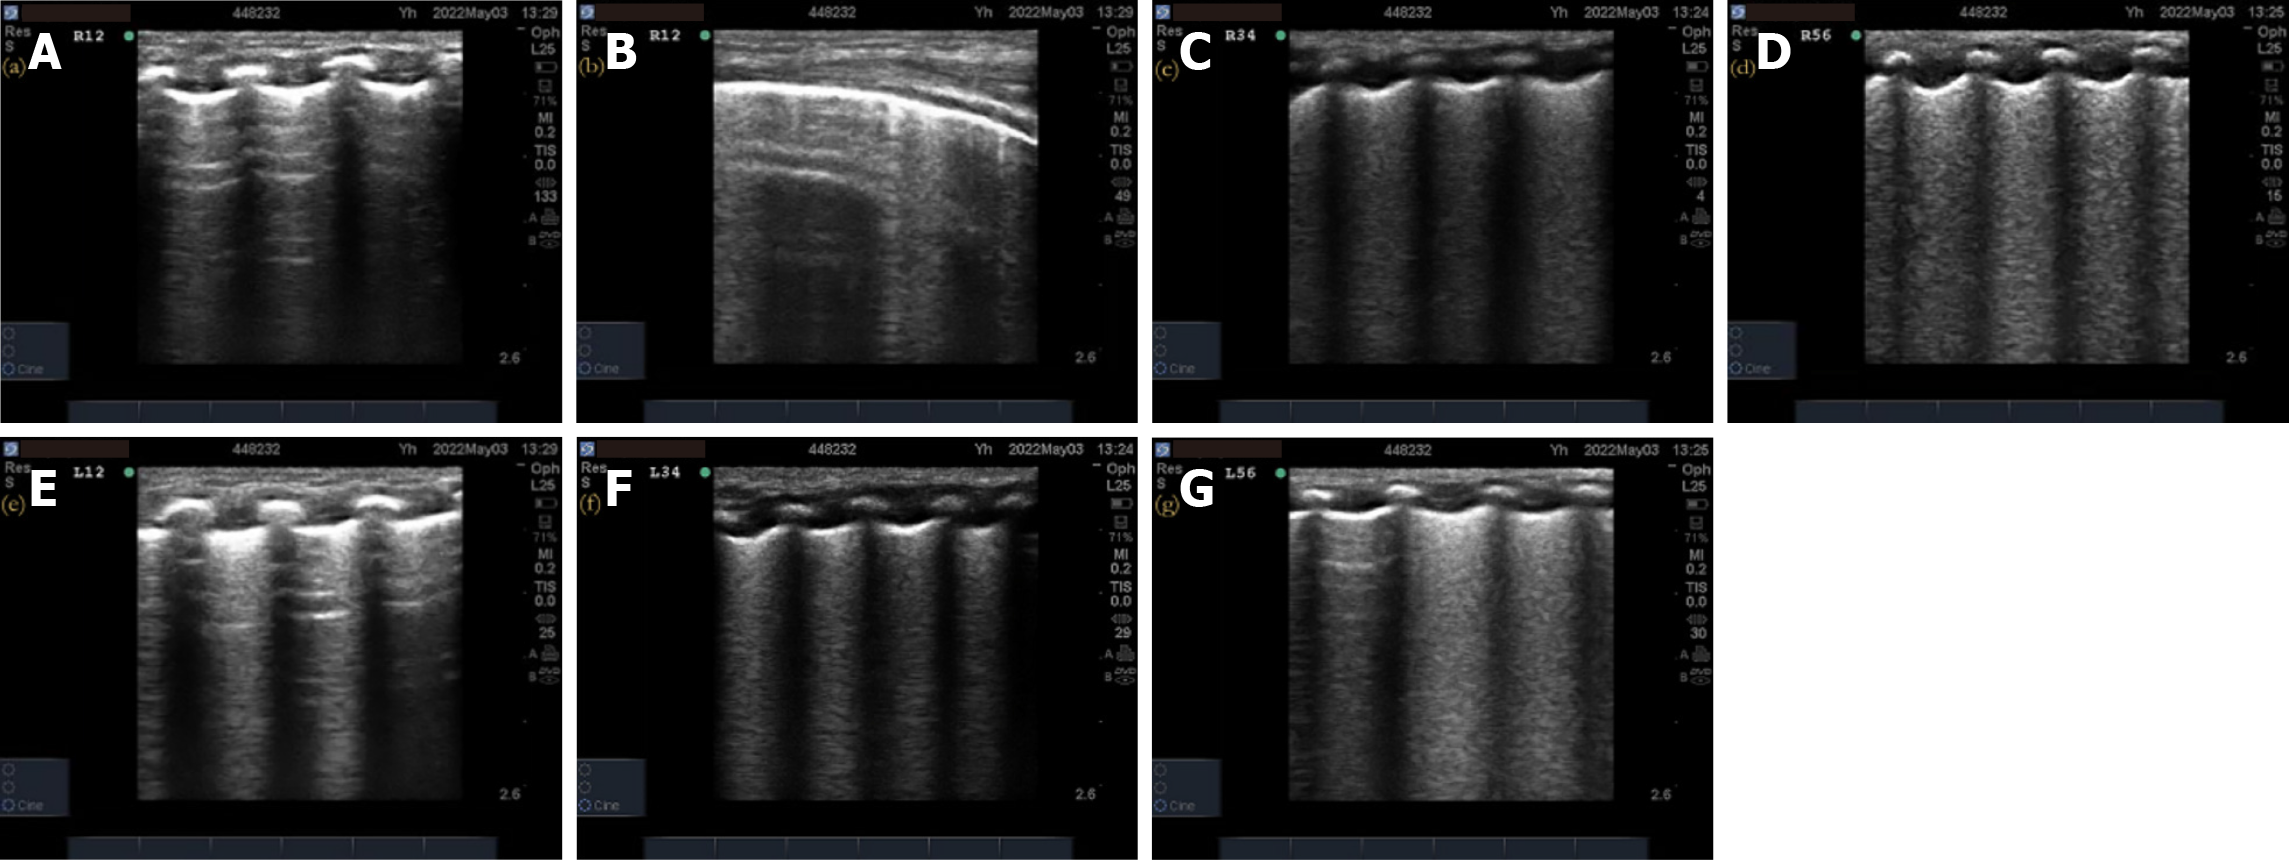
Figure 2 X-ray grade 1 respiratory distress syndrome neonatal pulmonary ultrasonography images.
A, B, E: Representative images showing increase in B-lines in the anterior chest of R1–R2/L1–L2. Real-time ultrasonography shows that B-lines and A-lines alternate with lung slip, resulting in 1 point each; C, D, F, G: Representative images showing ground-glass-like changes in each region of R3–R4/L3–L4 R5–R6/L5–L6, with 2 points each and a total ultrasonography score of 10 points.
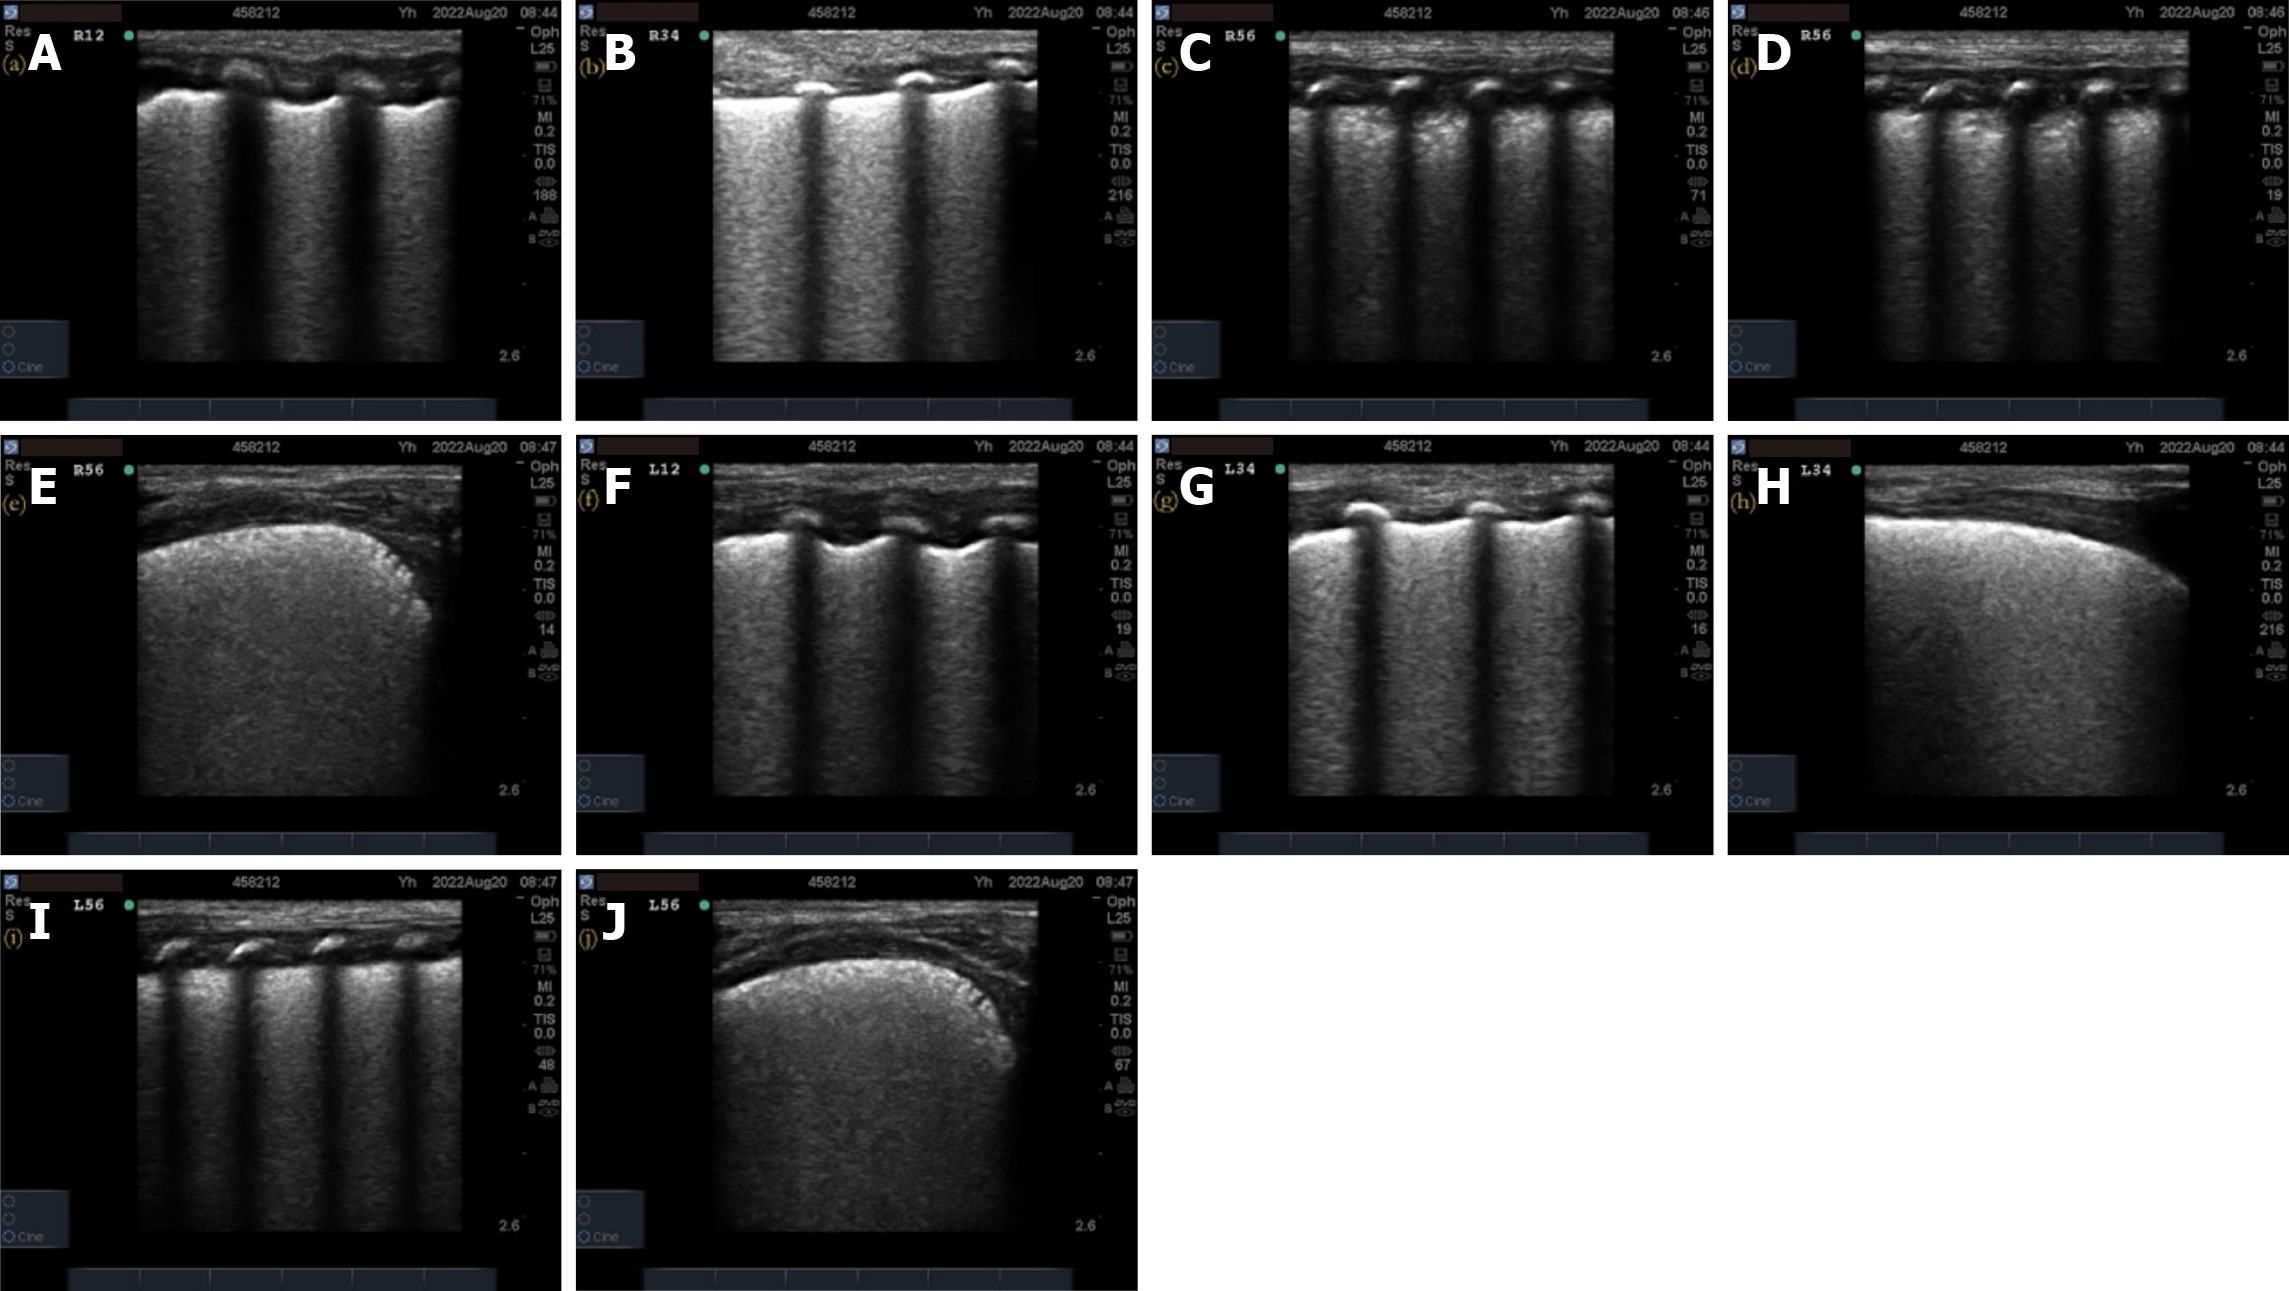
Figure 3 X-ray grade 2 respiratory distress syndrome neonatal pulmonary ultrasonography images.
A, B, F–H: Representative images showing ground-glass-like changes in the R1–R4/L1–L4 region. Transverse scanning confirms continuous interruption of pleural lines with snowflake-like changes, similar to lung adenocarcinoma in situ, but in reality, they indicate early or mild lung consolidation changes, with 2 points for each region; C–E, I, J: Representative images showing the disappearance of pleural and A-lines in the R5–6/L5–6 region, with pulmonary consolidation accompanied by bronchial inflation sign. Transverse scan confirms that each area scores 6 points, and the total ultrasonography score is 20 points.
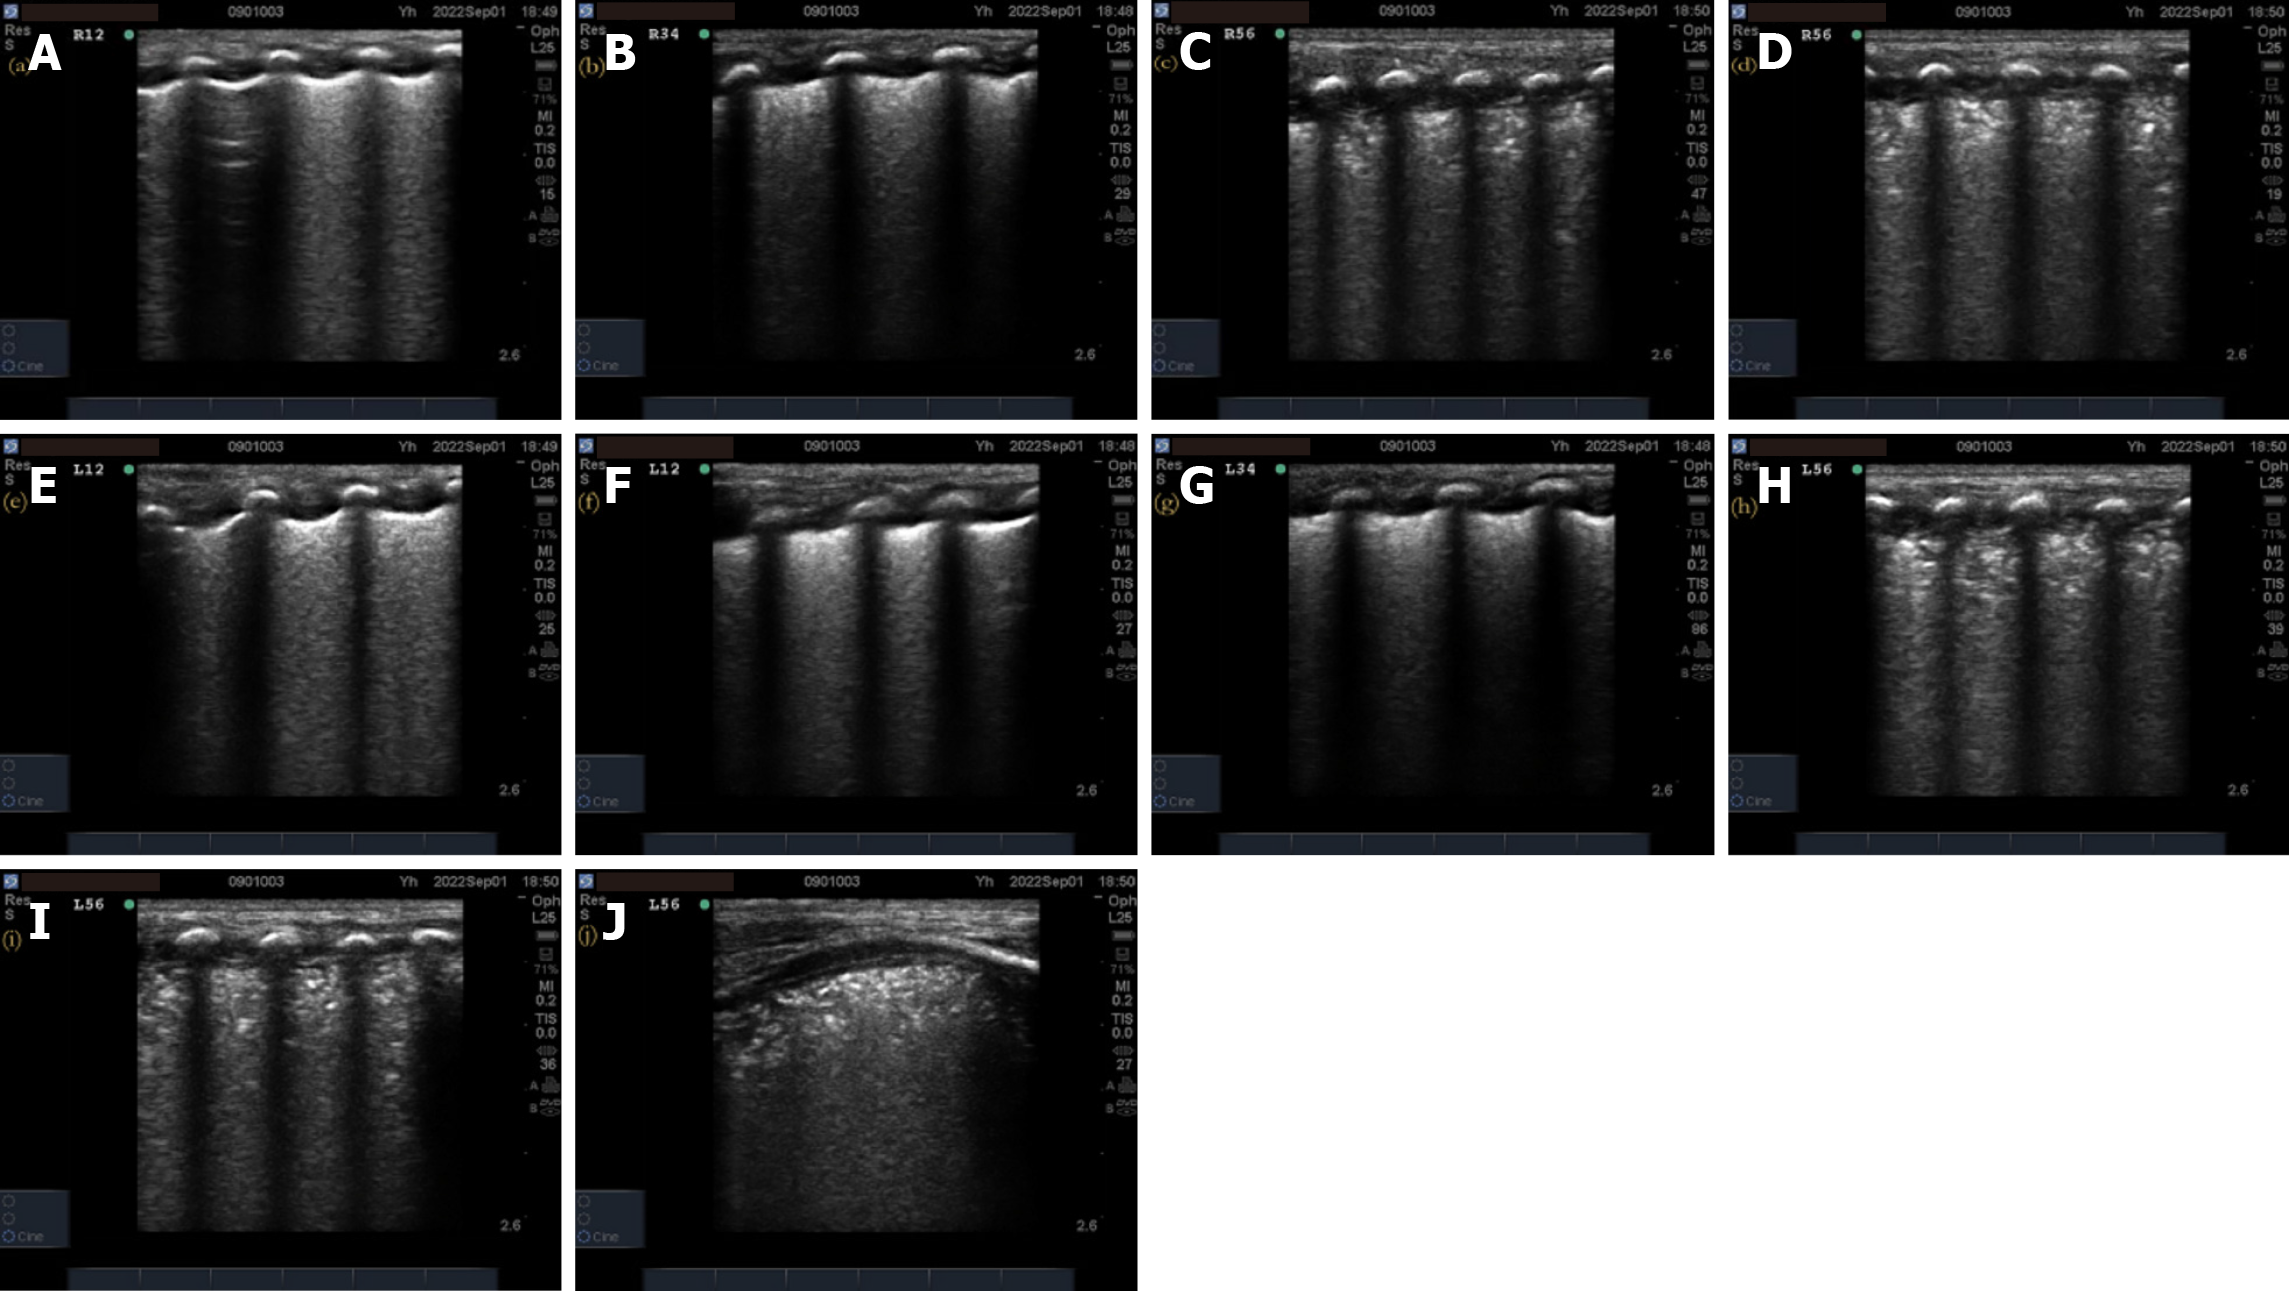
Figure 4 X-ray grade 3 respiratory distress syndrome neonatal lung ultrasonography images.
A: Ground-glass-like changes in the right lung R1–R2, as shown by the A-line, resulting in 2 points; B, E–G: Representative images showing consolidation of the left lung L1–L4 and right lung L3–L4 in half of the lung field, with 5 points for each area; C, D, H–J: Representative images showing consolidation of R5–R6/L5–L6 involving the entire lung field, with 6 points for each area and a total ultrasonography score of 29 points.
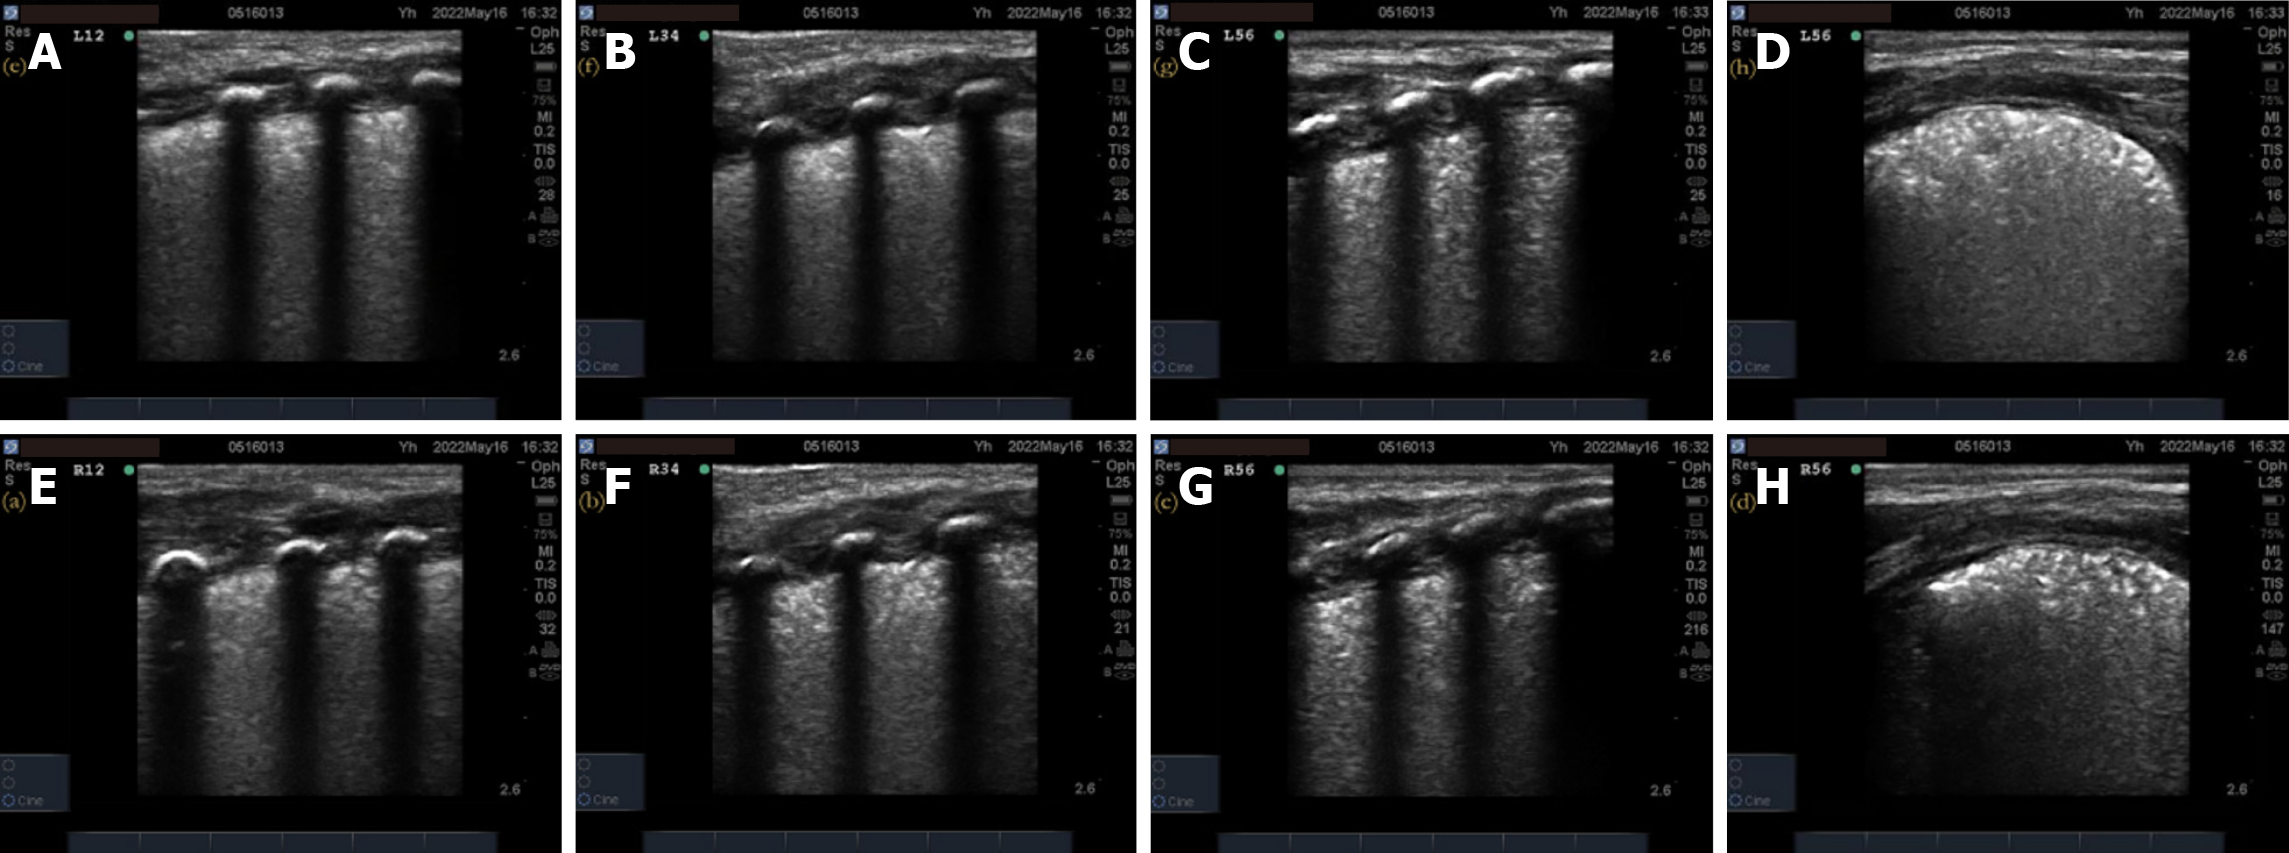
Figure 5 X-ray grade 4 respiratory distress syndrome neonatal pulmonary ultrasonography images.
A–H: Representative images showing involvement of consolidation with bronchial inflation sign in each longitudinal area. The transverse scan confirms the existence of the above changes, with 6 points for each area and a total ultrasonography score of 36 points.
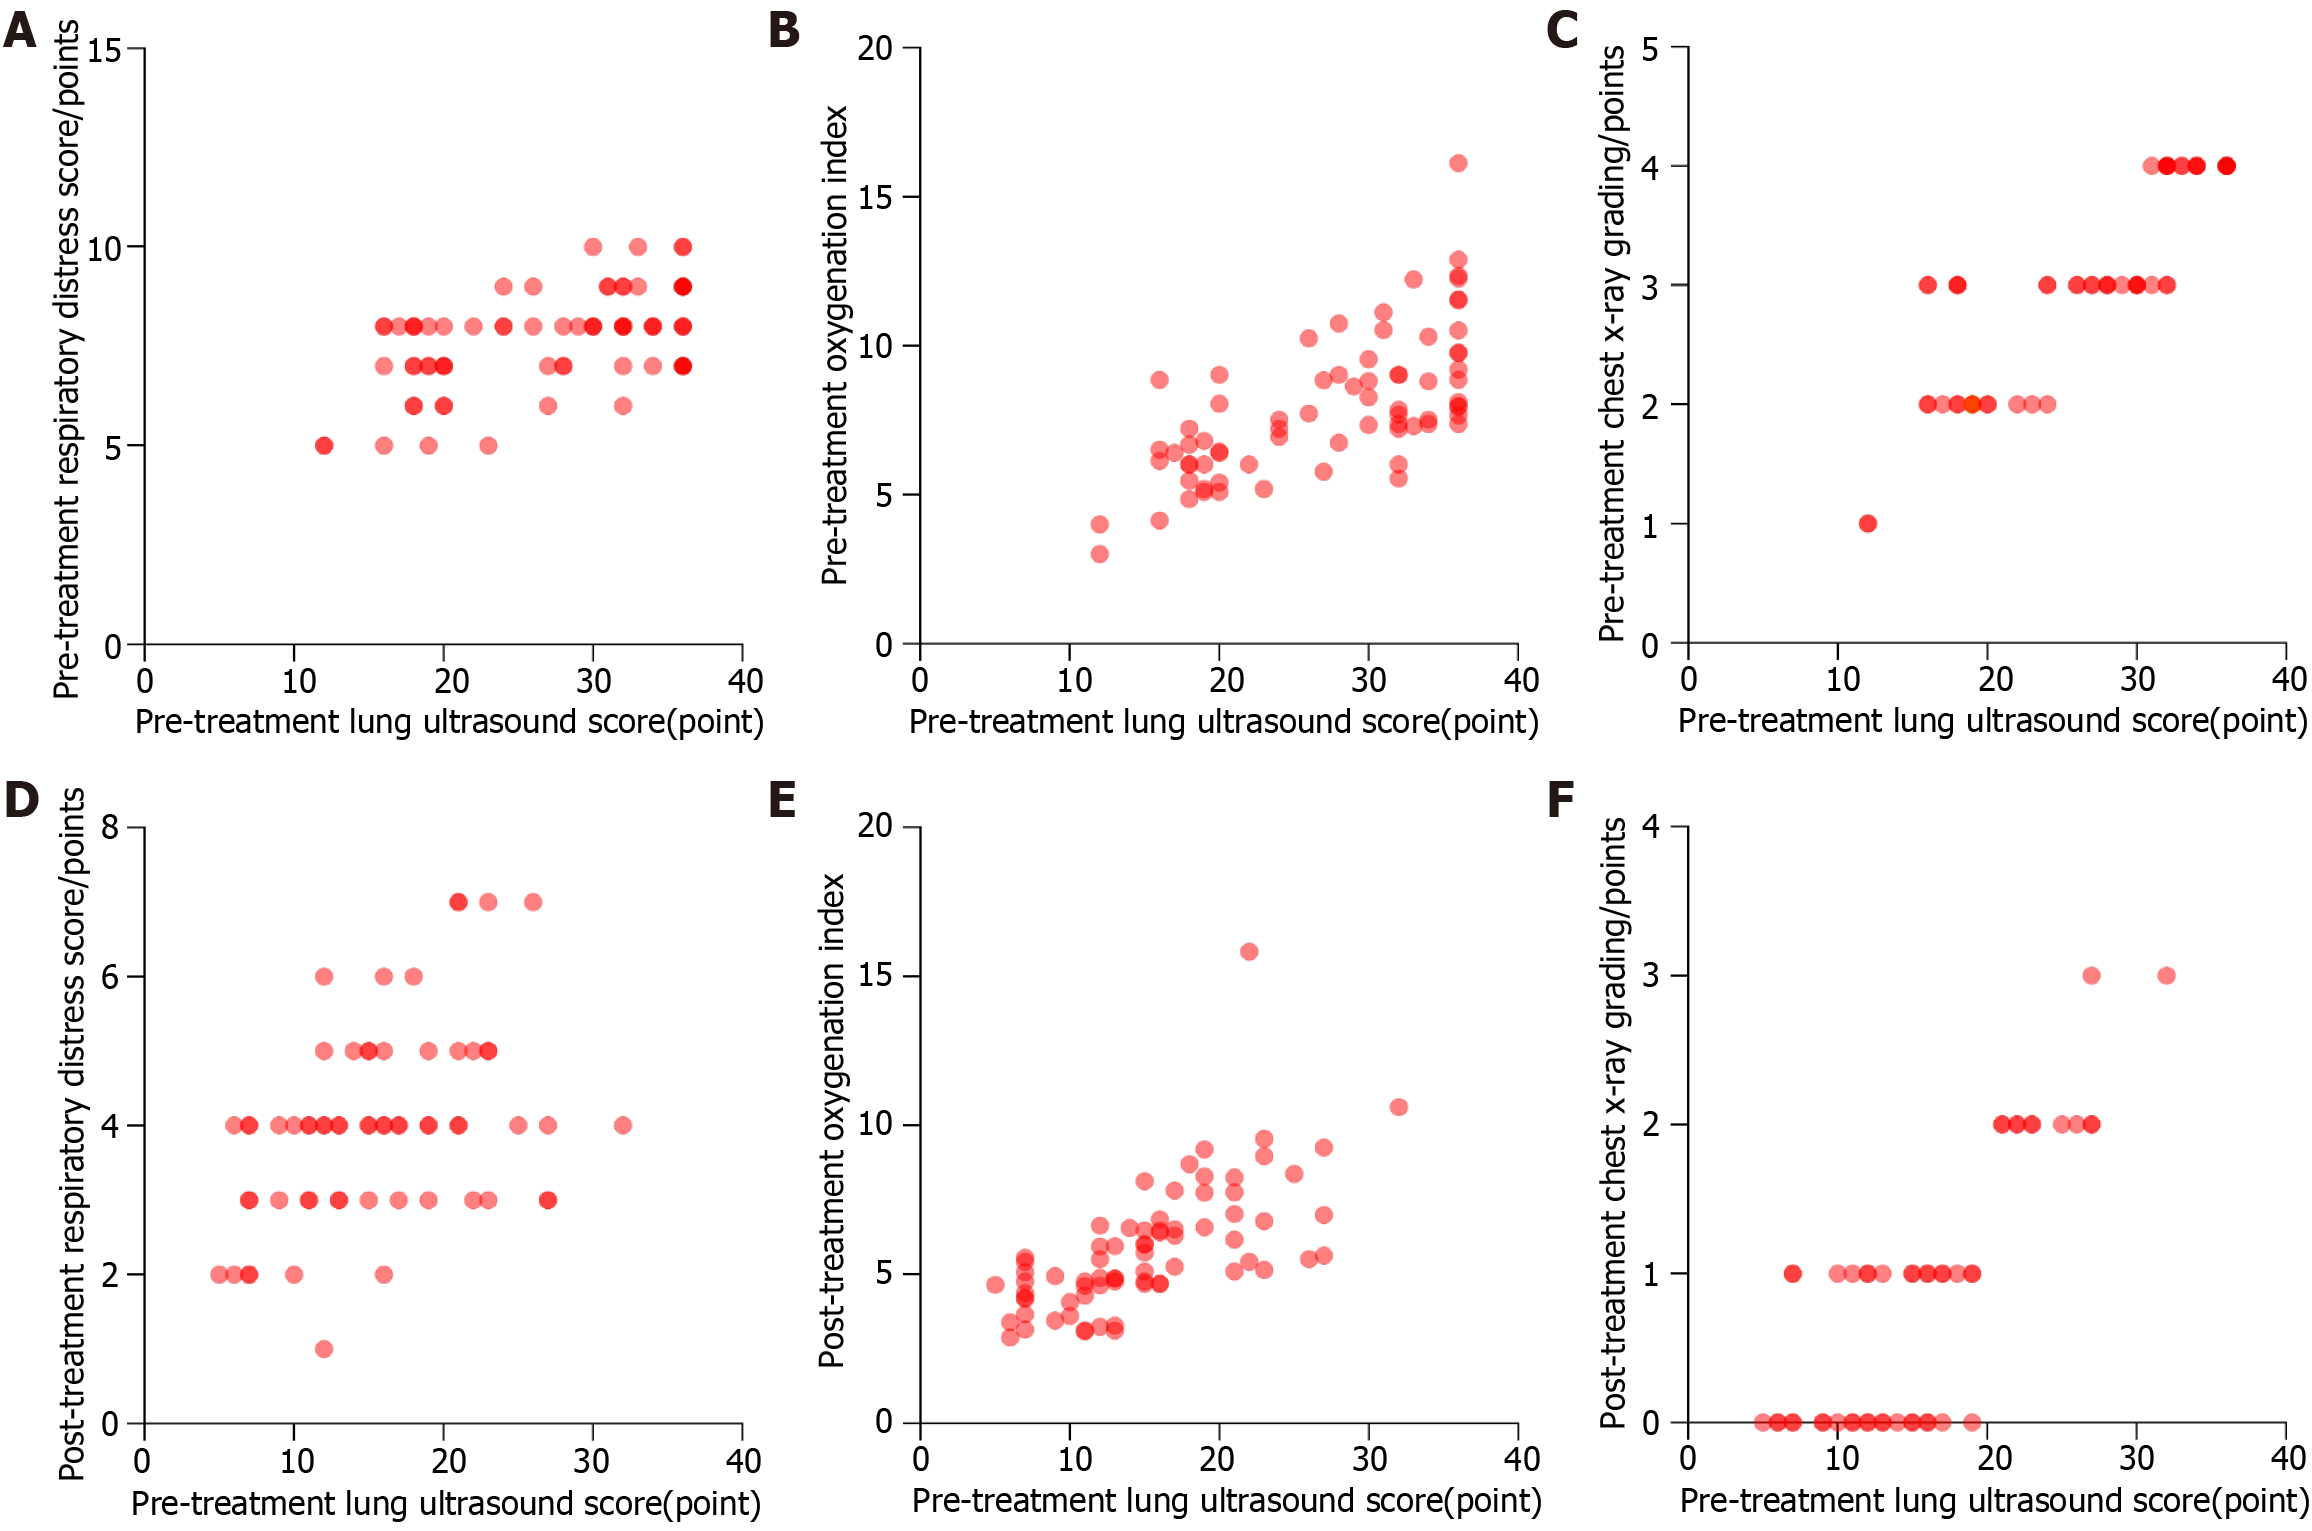
Figure 6 Scatter plot of the relationship between the respiratory distress syndrome neonatal ultrasonography score, respiratory distress score, oxygenation index, and chest X-ray grade before and after treatment.
A: Relationship between the pretreatment ultrasonography scores and respiratory distress scores; B: Relationship between the pretreatment ultrasonography score and oxygenation index; C: Relationship between the pretreatment ultrasonography scores and chest X-ray grade; D: Relationship between the ultrasonography scores and respiratory distress scores after treatment; E: Relationship between the ultrasonography scores and oxygenation index after treatment; F: Relationship between the post-treatment ultrasonography score and chest X-ray grade; the red circle in the figure represents the corresponding data of each sample indicator.
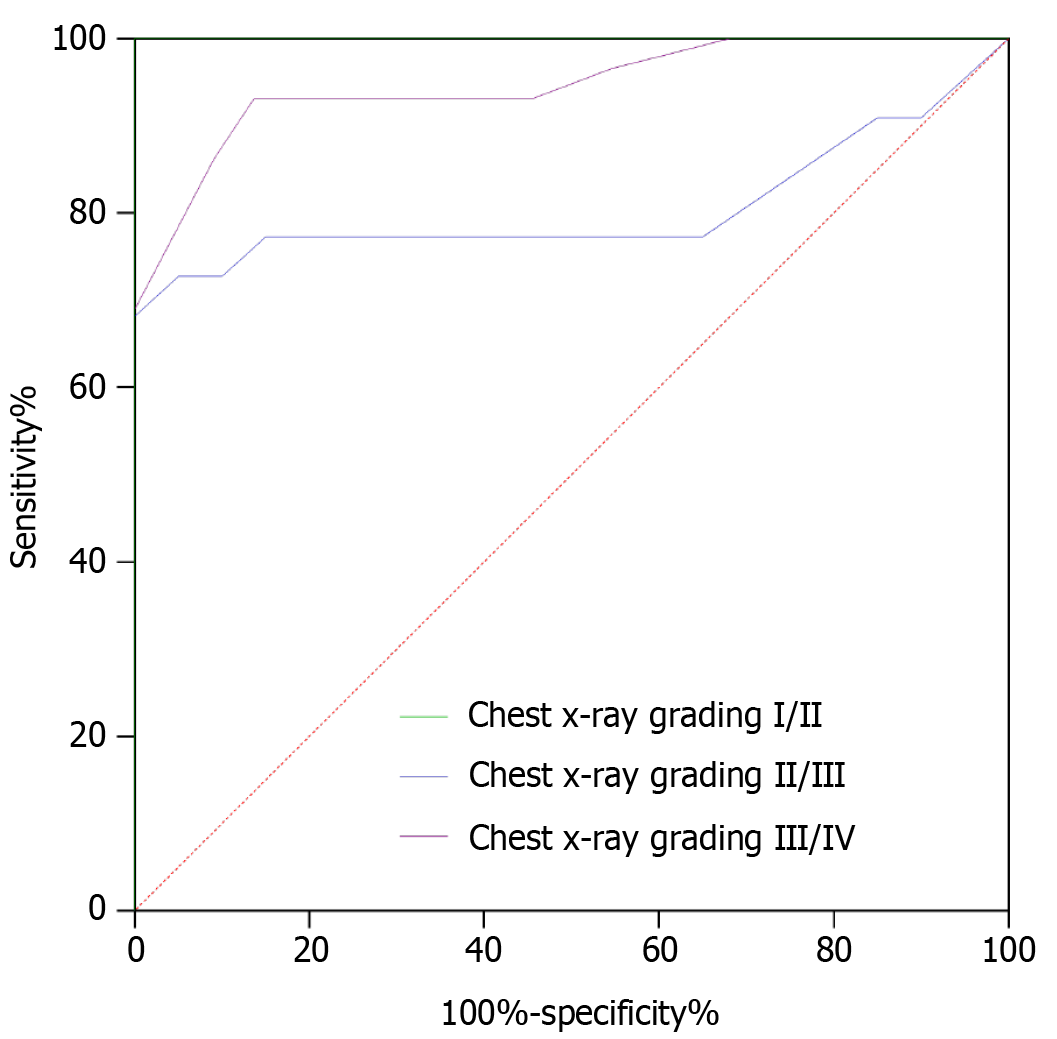
Figure 7 Receiver operating characteristic correlation of the pulmonary ultrasonography score with newborn respiratory distress syndrome severity.
The green line is the receiver operating characteristic (ROC) of pulmonary X-ray grades I and II; the blue line is the ROC of pulmonary X-ray grades II and III; and the purple line is the ROC of pulmonary X-ray grades III and IV.
- Citation: Yang H, Gao LJ, Lei J, Li Q, Cui L, Li XH, Yin WX, Tian SH. Relationship between neonatal respiratory distress syndrome pulmonary ultrasonography and respiratory distress score, oxygenation index, and chest radiography grading. World J Clin Cases 2024; 12(20): 4154-4165
- URL: https://www.wjgnet.com/2307-8960/full/v12/i20/4154.htm
- DOI: https://dx.doi.org/10.12998/wjcc.v12.i20.4154


