Copyright
©The Author(s) 2024.
World J Clin Cases. Jan 16, 2024; 12(2): 335-345
Published online Jan 16, 2024. doi: 10.12998/wjcc.v12.i2.335
Published online Jan 16, 2024. doi: 10.12998/wjcc.v12.i2.335
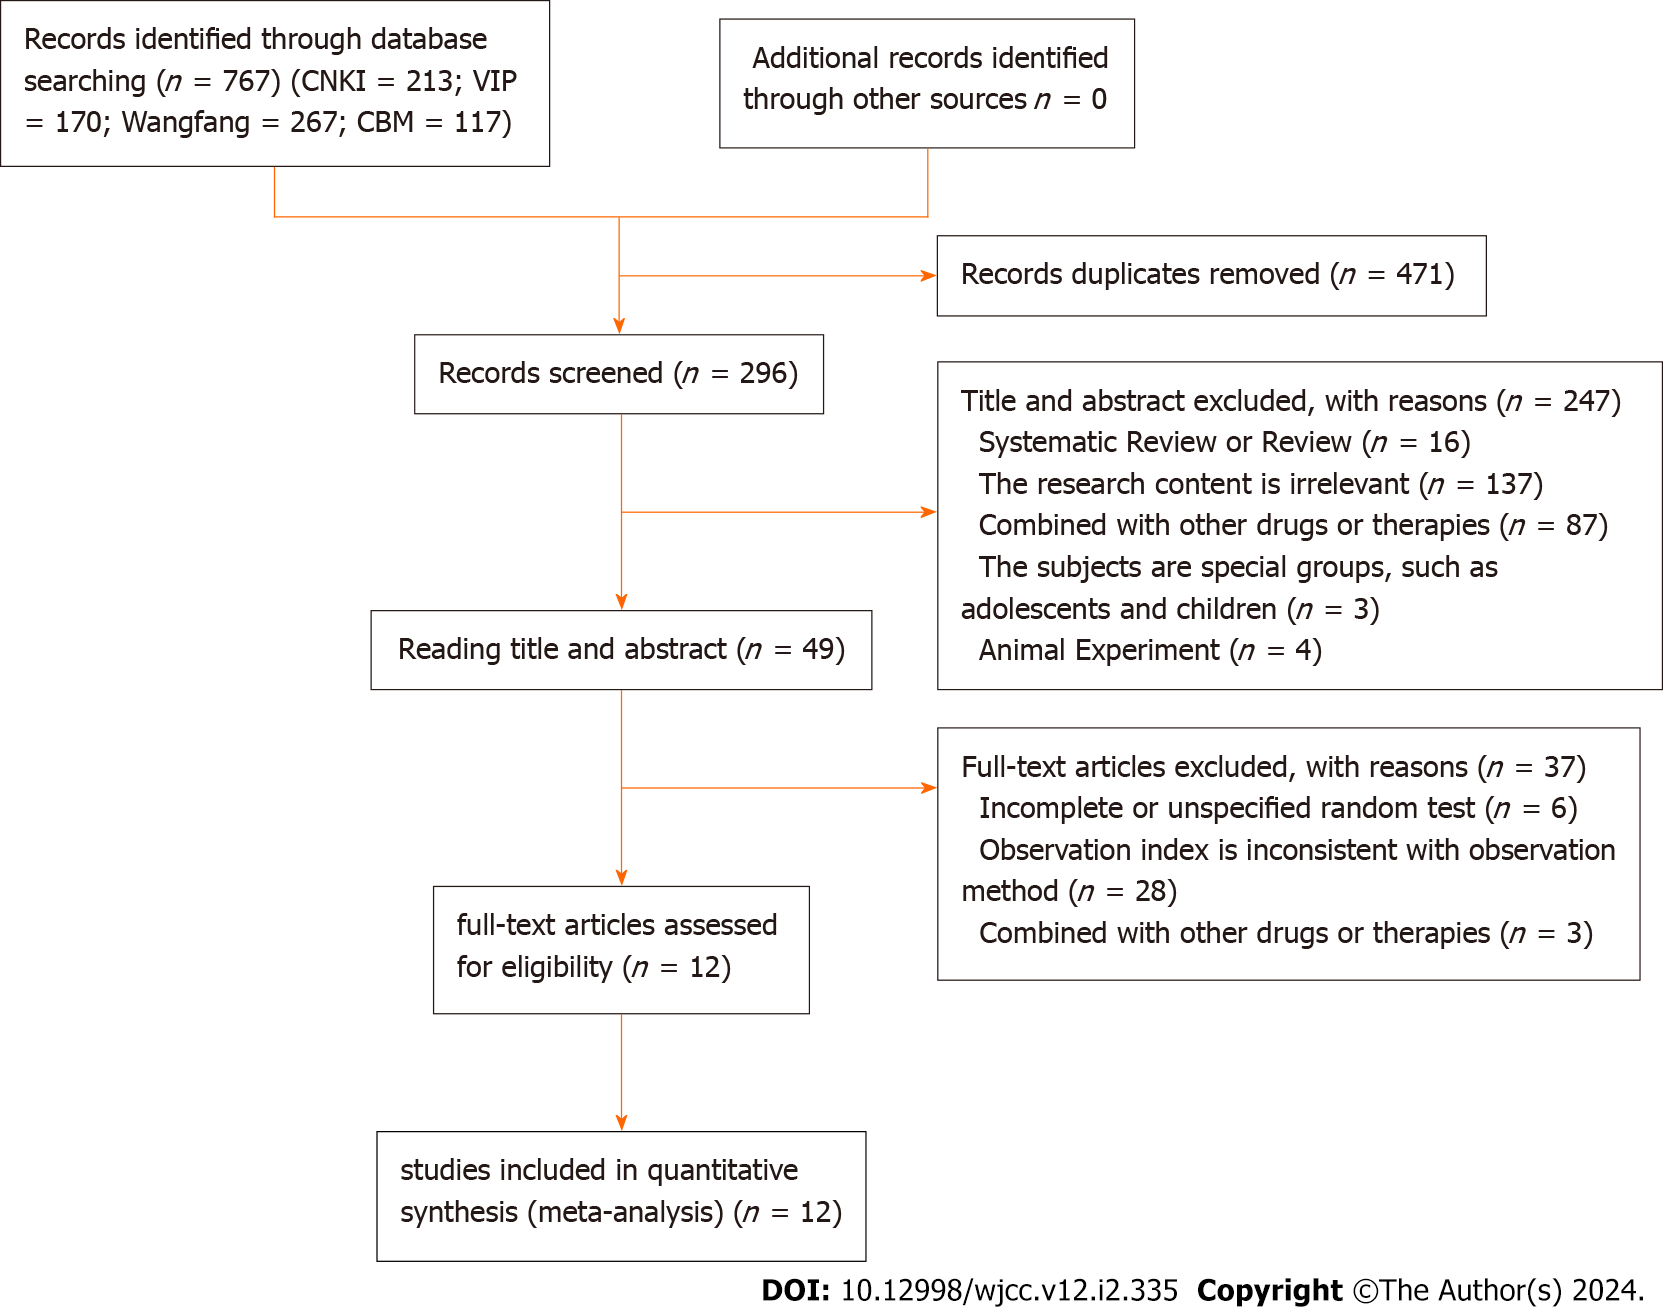
Figure 1 Flow chart of study selection.
Figure 2 Risk of bias summary.
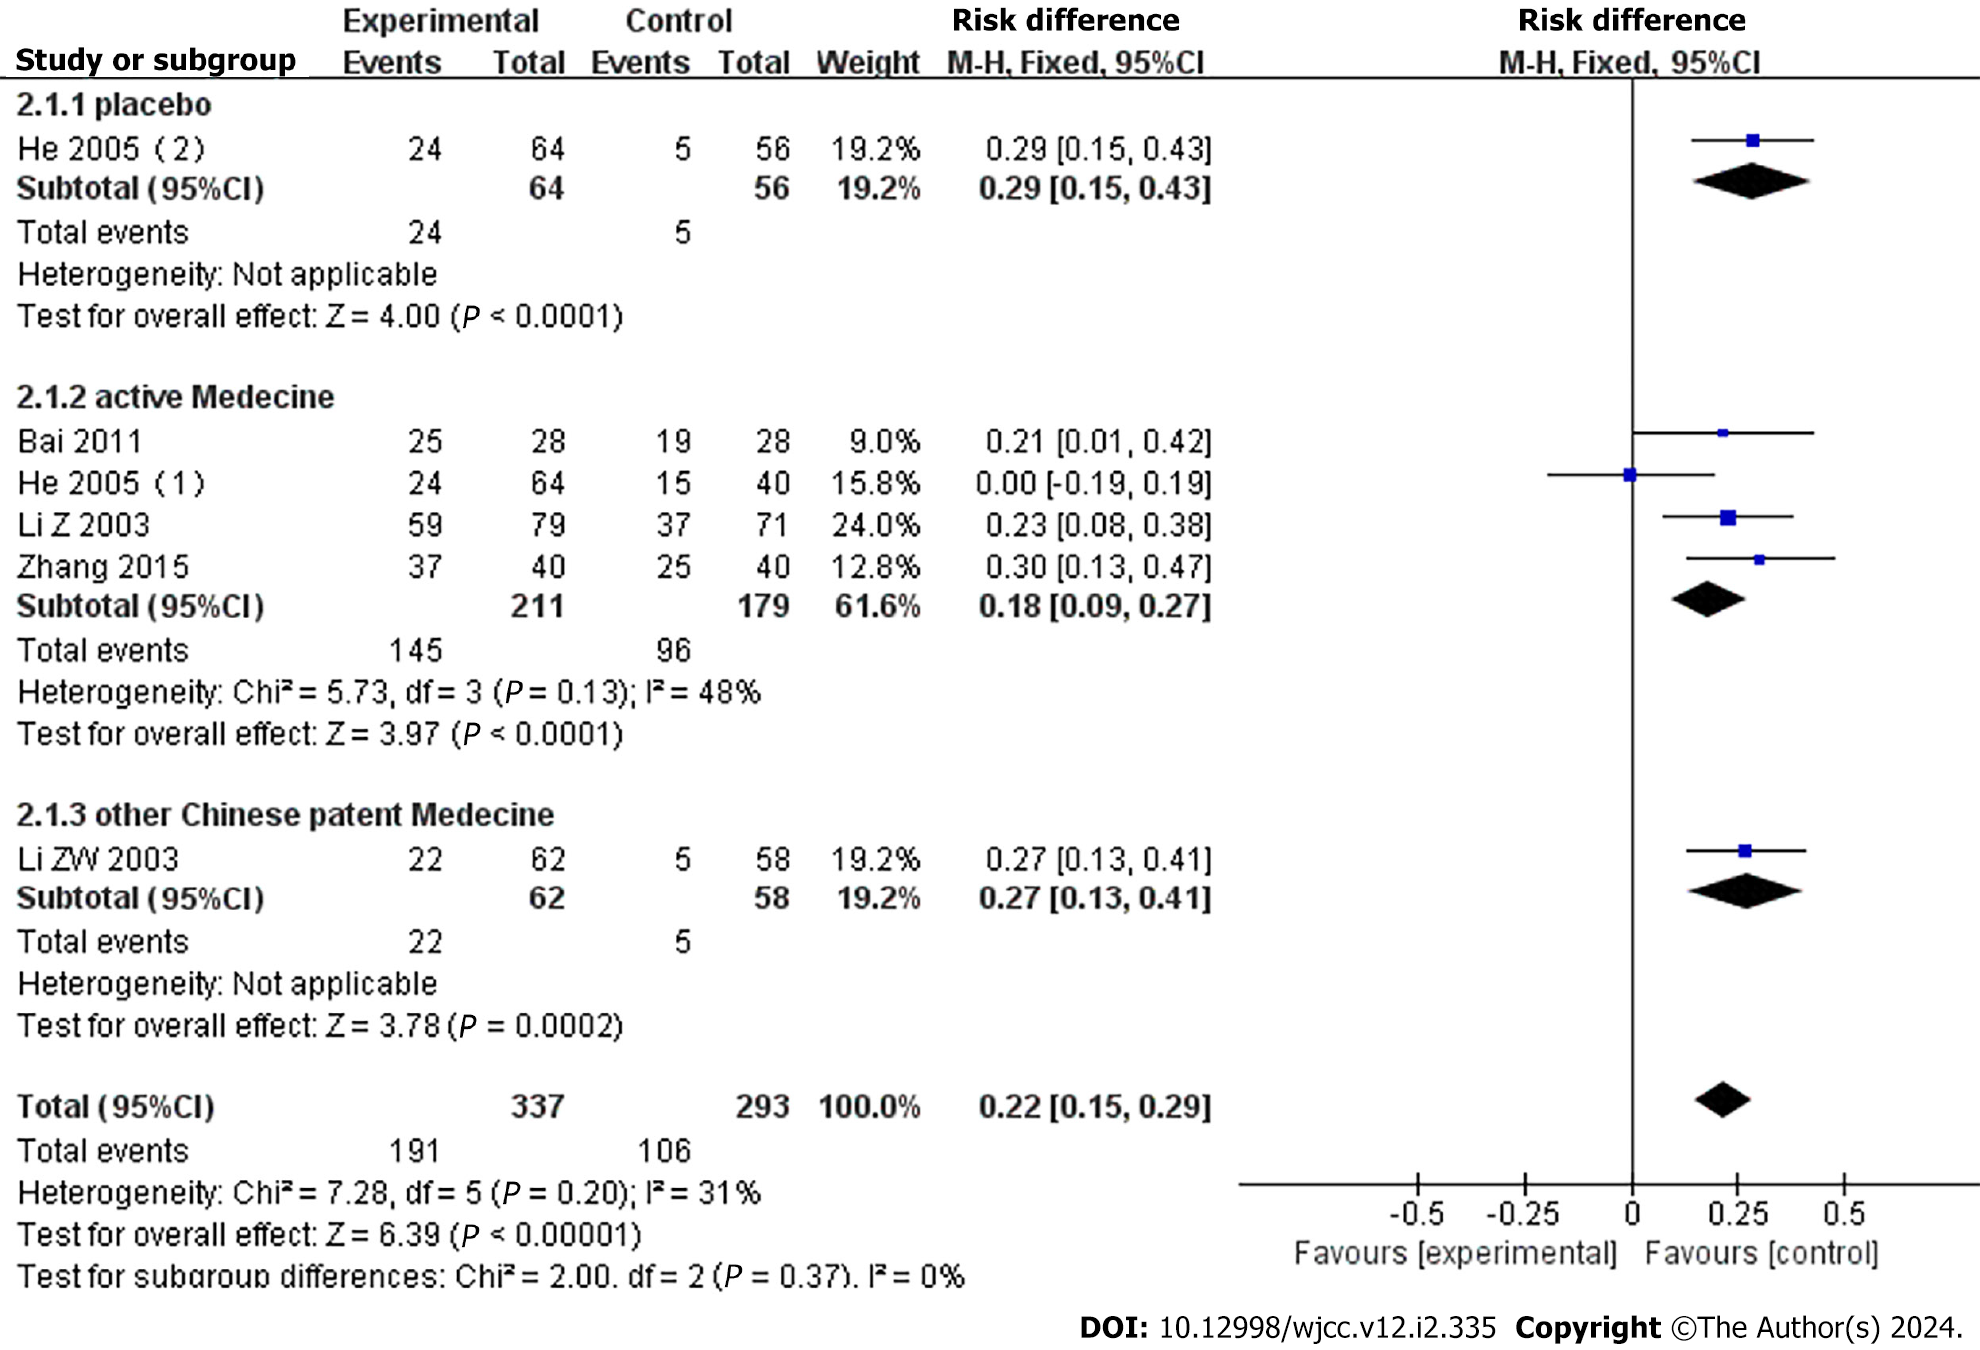
Figure 3 Forest plot of clinical trial efficacy divided into subgroups according to control medicine.
95%CI: 95% confidence interval.
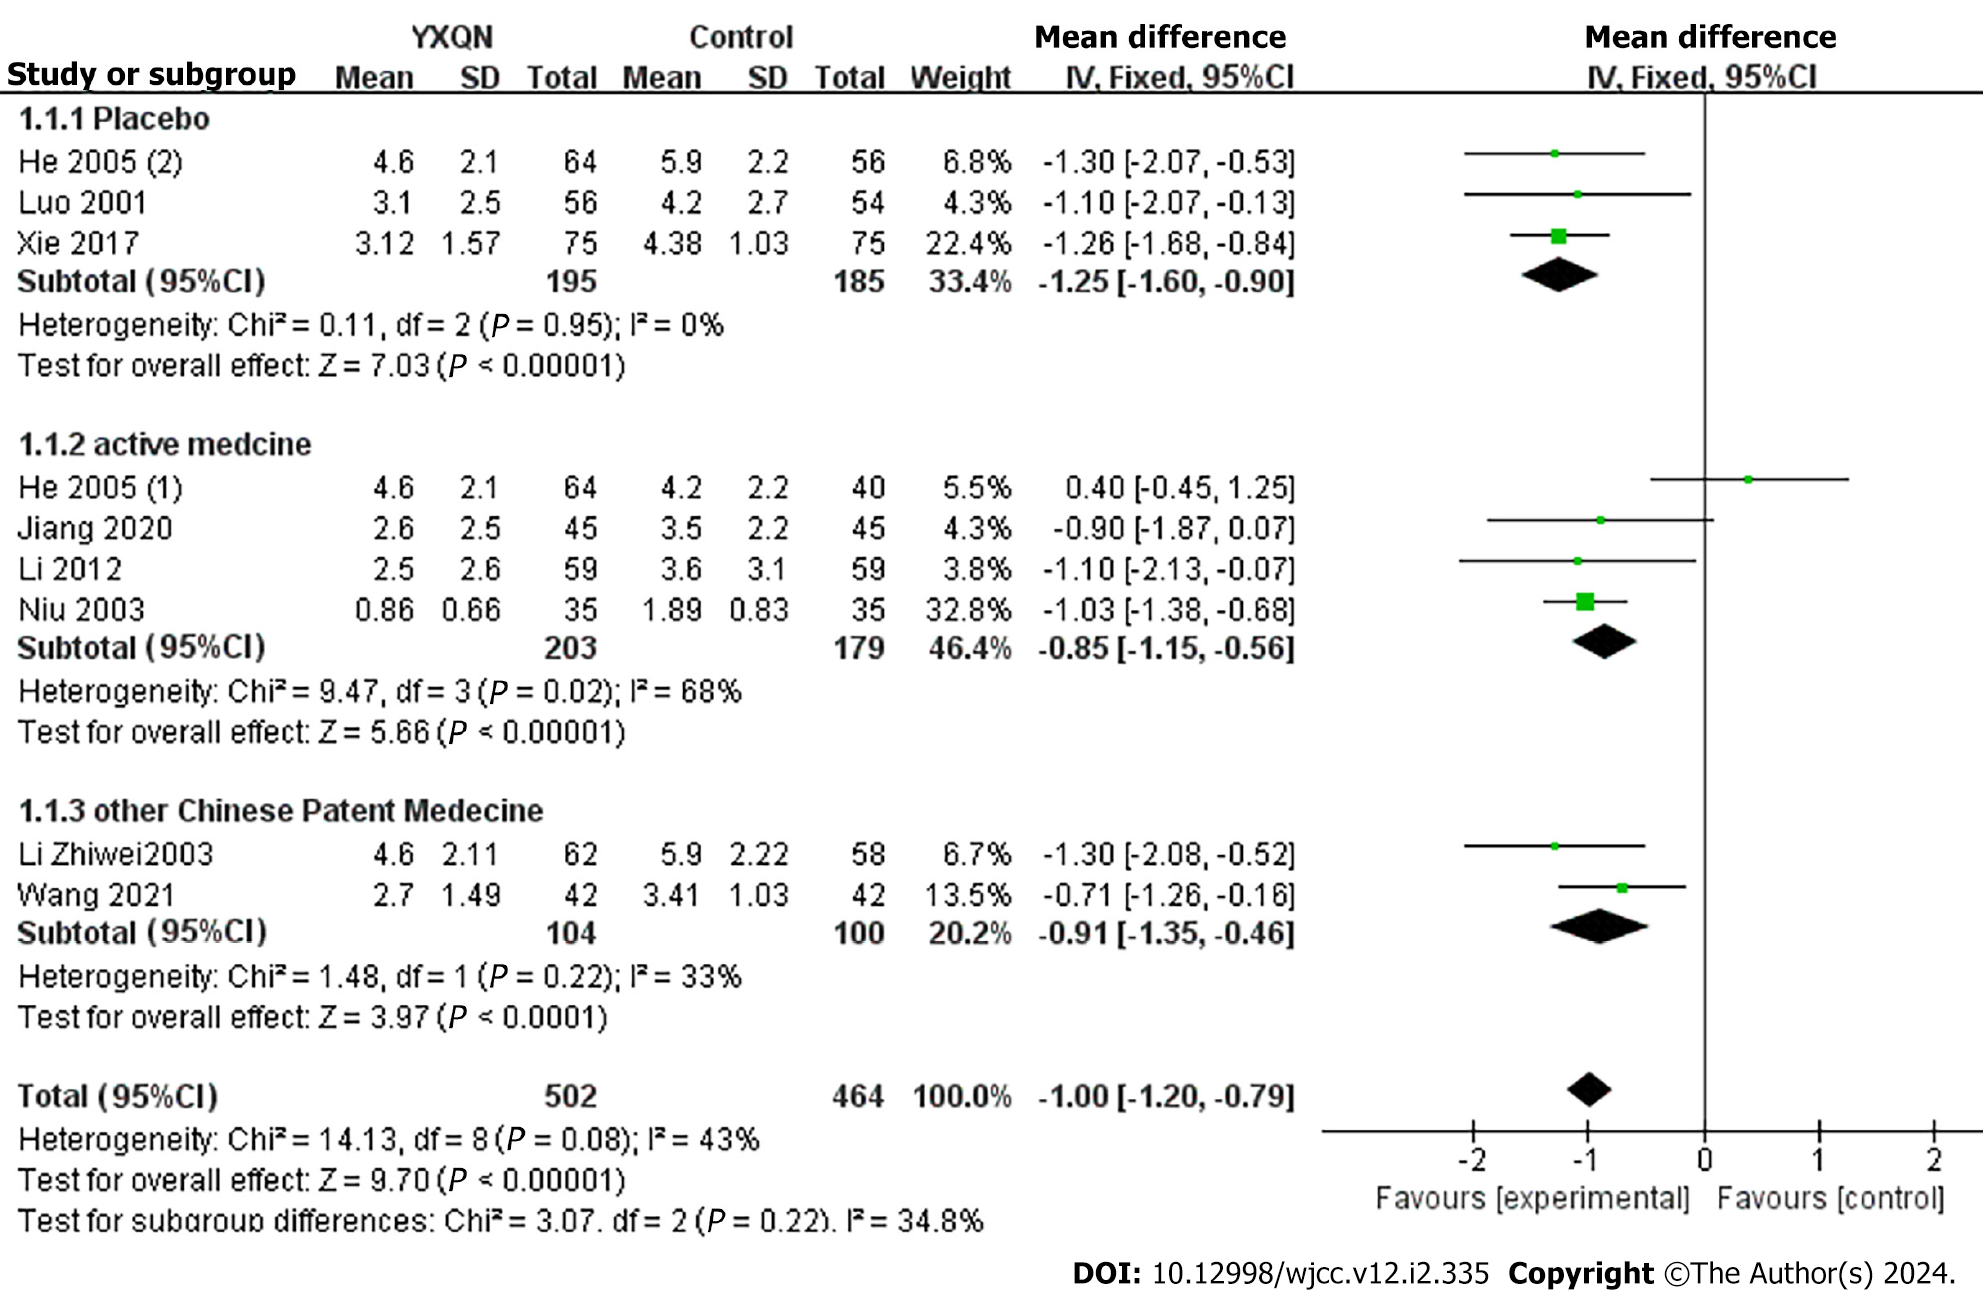
Figure 4 Forest plot of frequency of headache.
95%CI: 95% confidence interval; YXQN: Yangxue Qingnao Granules.
Figure 5 Forest plot of headache duration.
95%CI: 95% confidence interval.
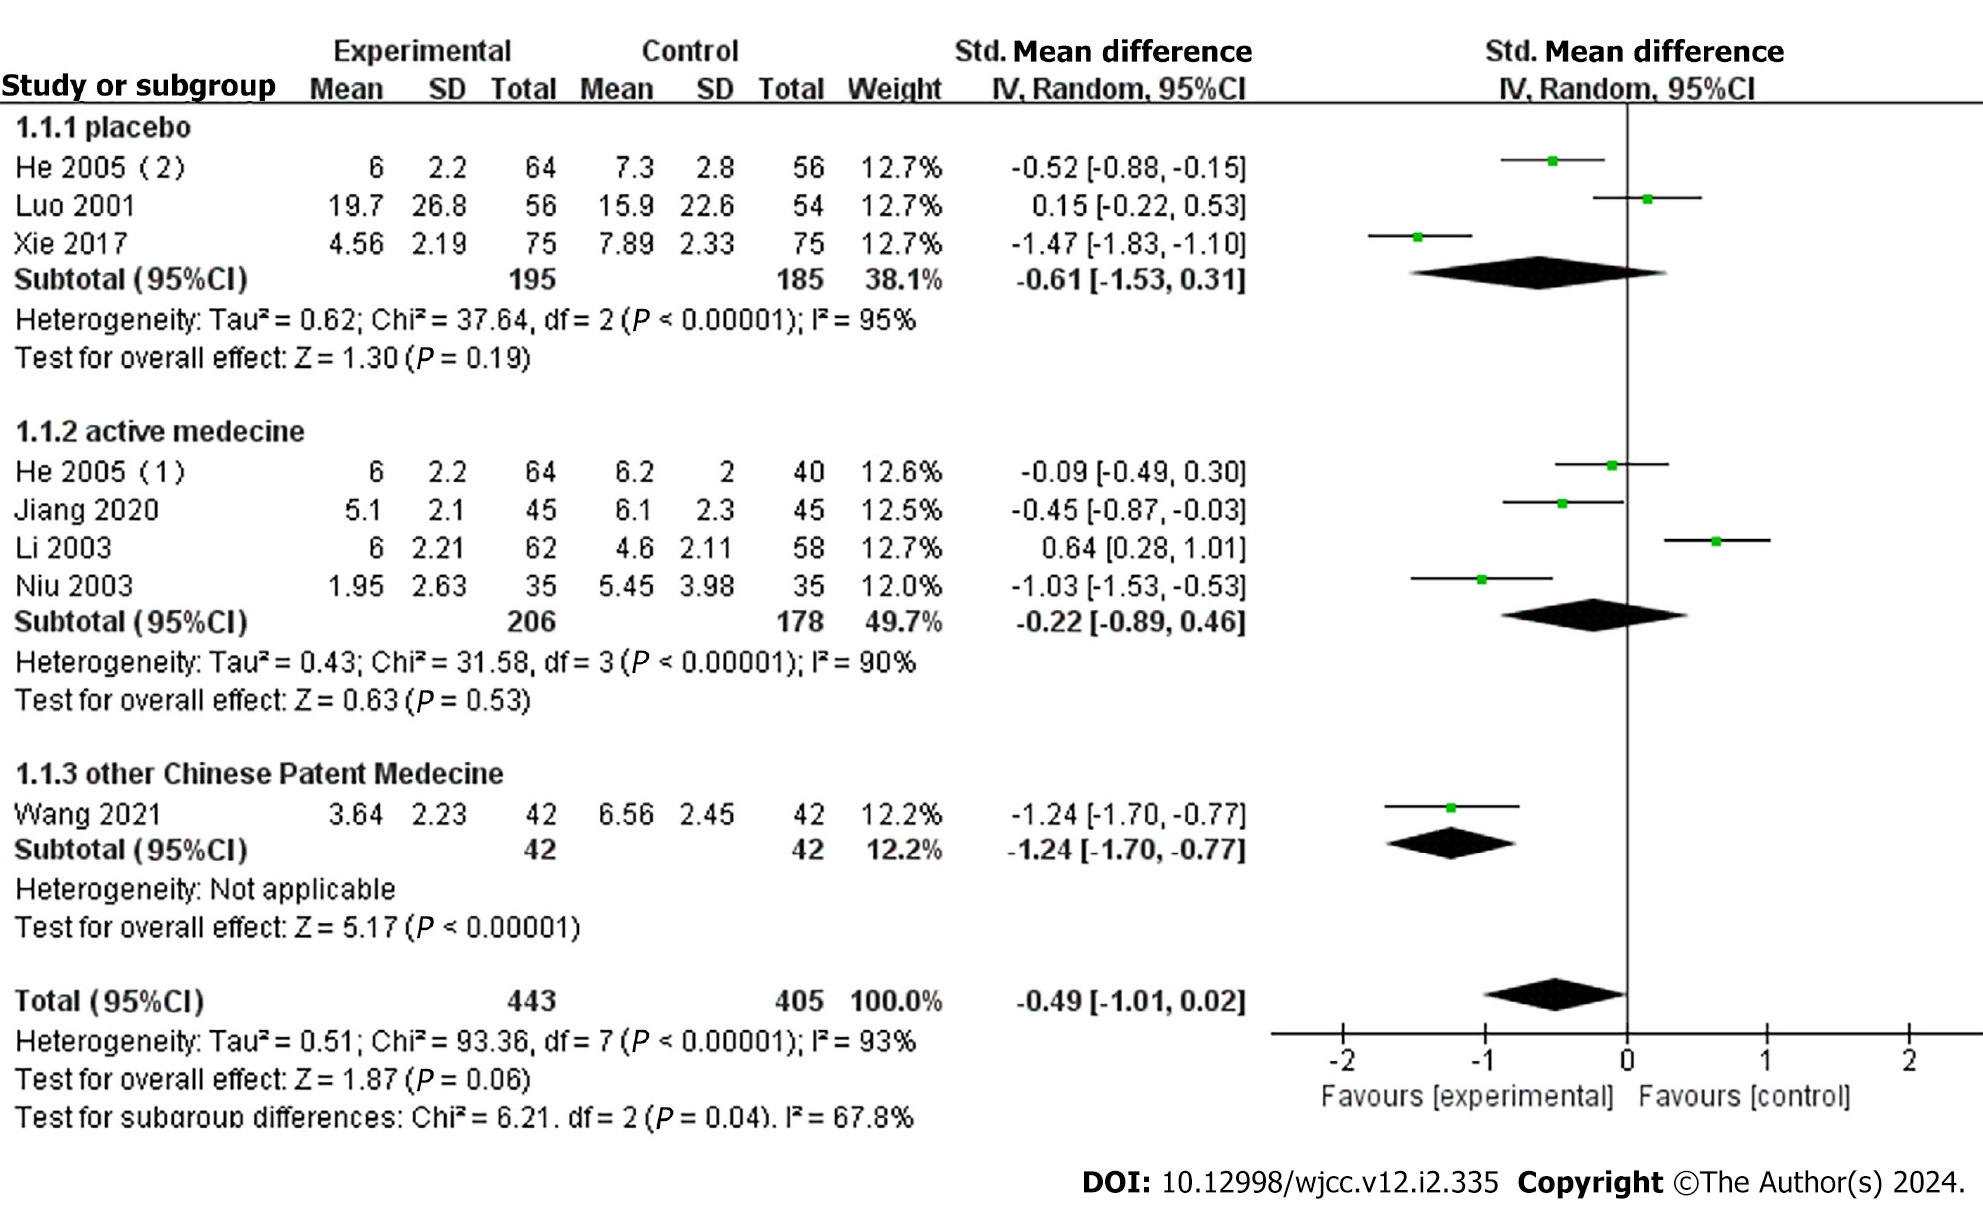
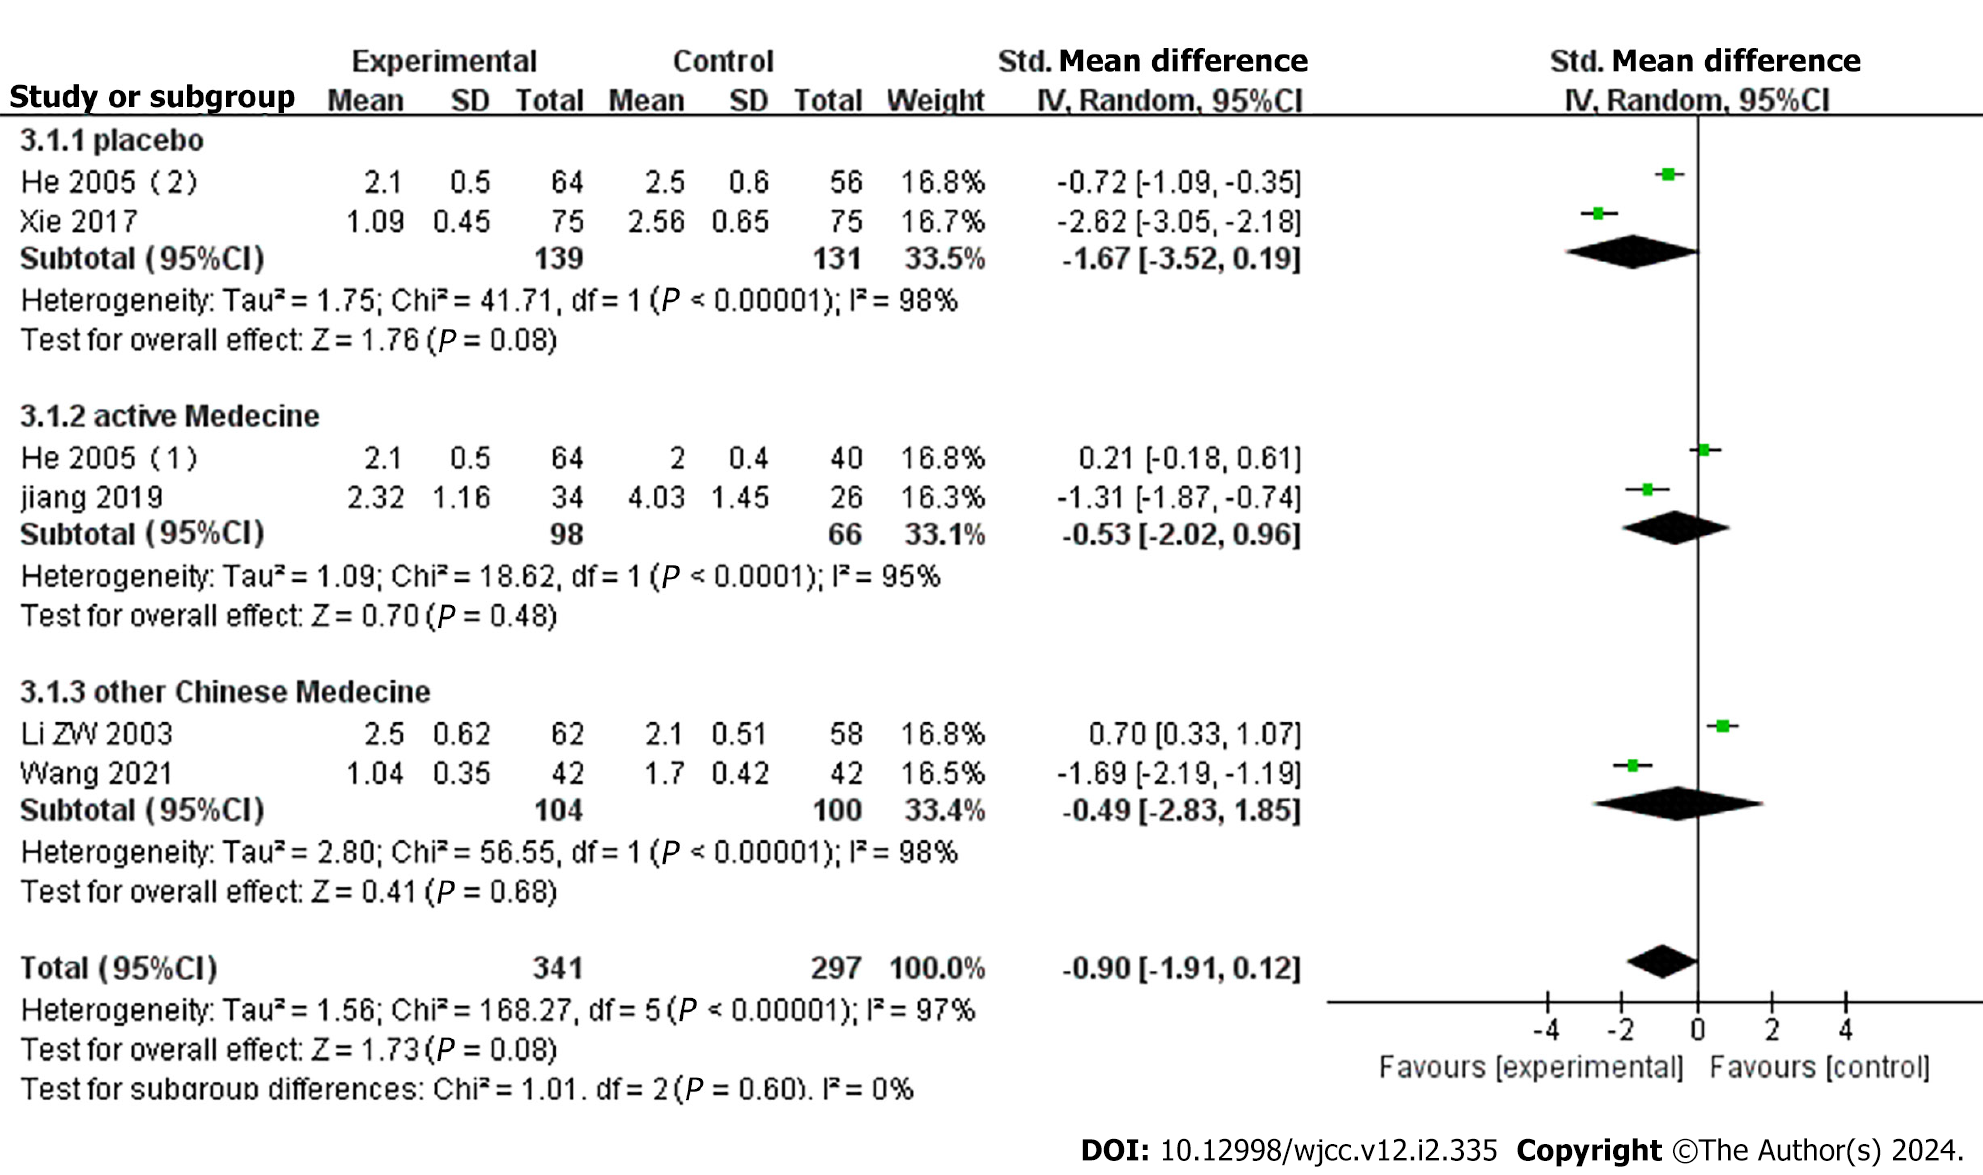
Figure 6 Forest plot of headache severity.
95%CI: 95% confidence interval.
- Citation: Zhou B, Wang GS, Yao YN, Hao T, Li HQ, Cao KG. Efficacy and safety of Yangxue Qingnao Granules in treatment of migraine: A systematic review and meta-analysis. World J Clin Cases 2024; 12(2): 335-345
- URL: https://www.wjgnet.com/2307-8960/full/v12/i2/335.htm
- DOI: https://dx.doi.org/10.12998/wjcc.v12.i2.335


