Copyright
©The Author(s) 2024.
World J Clin Cases. Jan 16, 2024; 12(2): 302-313
Published online Jan 16, 2024. doi: 10.12998/wjcc.v12.i2.302
Published online Jan 16, 2024. doi: 10.12998/wjcc.v12.i2.302
Figure 1 Phosphorylated-Akt in the platelets.
A and B: Type 2 diabetes mellitus (T2DM) group; C and D: The control group. To avoid platelet activation, ice-cold ethylenediaminetetraacetic acid (10 mmol/L) solution was added immediately to the platelet-rich plasma obtained from the patients in the T2DM group (A and B) and the control group (C and D). The lysates of the platelets were then subjected to western blot analysis using antibodies against phospho-specific Akt (Thr-308) or glyceraldehyde 3-phosphate dehydrogenase (GAPDH). All the results are presented collectively (A: n = 40; C: n = 15). The levels of GAPDH and phosphorylated Akt were determined using the ImageJ software program. The bar graphs show the levels of phosphorylated Akt corrected by those of GAPDH in the T2DM group (B) and the control group (D). GAPDH: Glyceraldehyde 3-phosphate dehydrogenase.
Figure 2 The relationship between the individual levels of phosphorylated-Akt and the Voxel-based specific regional analysis system for Alzheimer’s disease Z-score.
A: Type 2 diabetes mellitus (T2DM) group; B: The control group. The levels of phosphorylated-Akt corrected with those of glyceraldehyde 3-phosphate dehydrogenase in the T2DM group (A) and the control group (B) were plotted against Voxel-based specific regional analysis system for Alzheimer’s disease Z-scores obtained by magnetic resonance imaging. The plotted data were analysed by linear regression analysis. VSRAD: Voxel-based specific regional analysis system for Alzheimer’s disease; GAPDH: Glyceraldehyde 3-phosphate dehydrogenase.
Figure 3 Phosphorylated p38 mitogen-activated protein kinase in the platelets and the levels of phosphorylated Akt corrected with those of phosphorylated p38 mitogen-activated protein kinase.
A and B: Type 2 diabetes mellitus (T2DM) group; C and D: The control group. To avoid platelet activation, ice-cold ethylenediaminetetraacetic acid (10 mmol/L) solution was added immediately to the platelet-rich plasma obtained from patients in the T2DM group (A and B) and the control group (C and D). The lysates of the platelets were then subjected to western blot analysis using antibodies against phospho-specific p38 Mitogen-activated protein kinase (MAPK). All the results are presented collectively (A: n = 40; C: n = 15). The levels of phosphorylated-p38 MAPK were determined using the ImageJ software program. The bar graphs show the levels of phosphorylated-Akt corrected with those of phosphorylated p38 MAPK in the T2DM group (B) and the control group (D). MAPK: Mitogen-activated protein kinase.
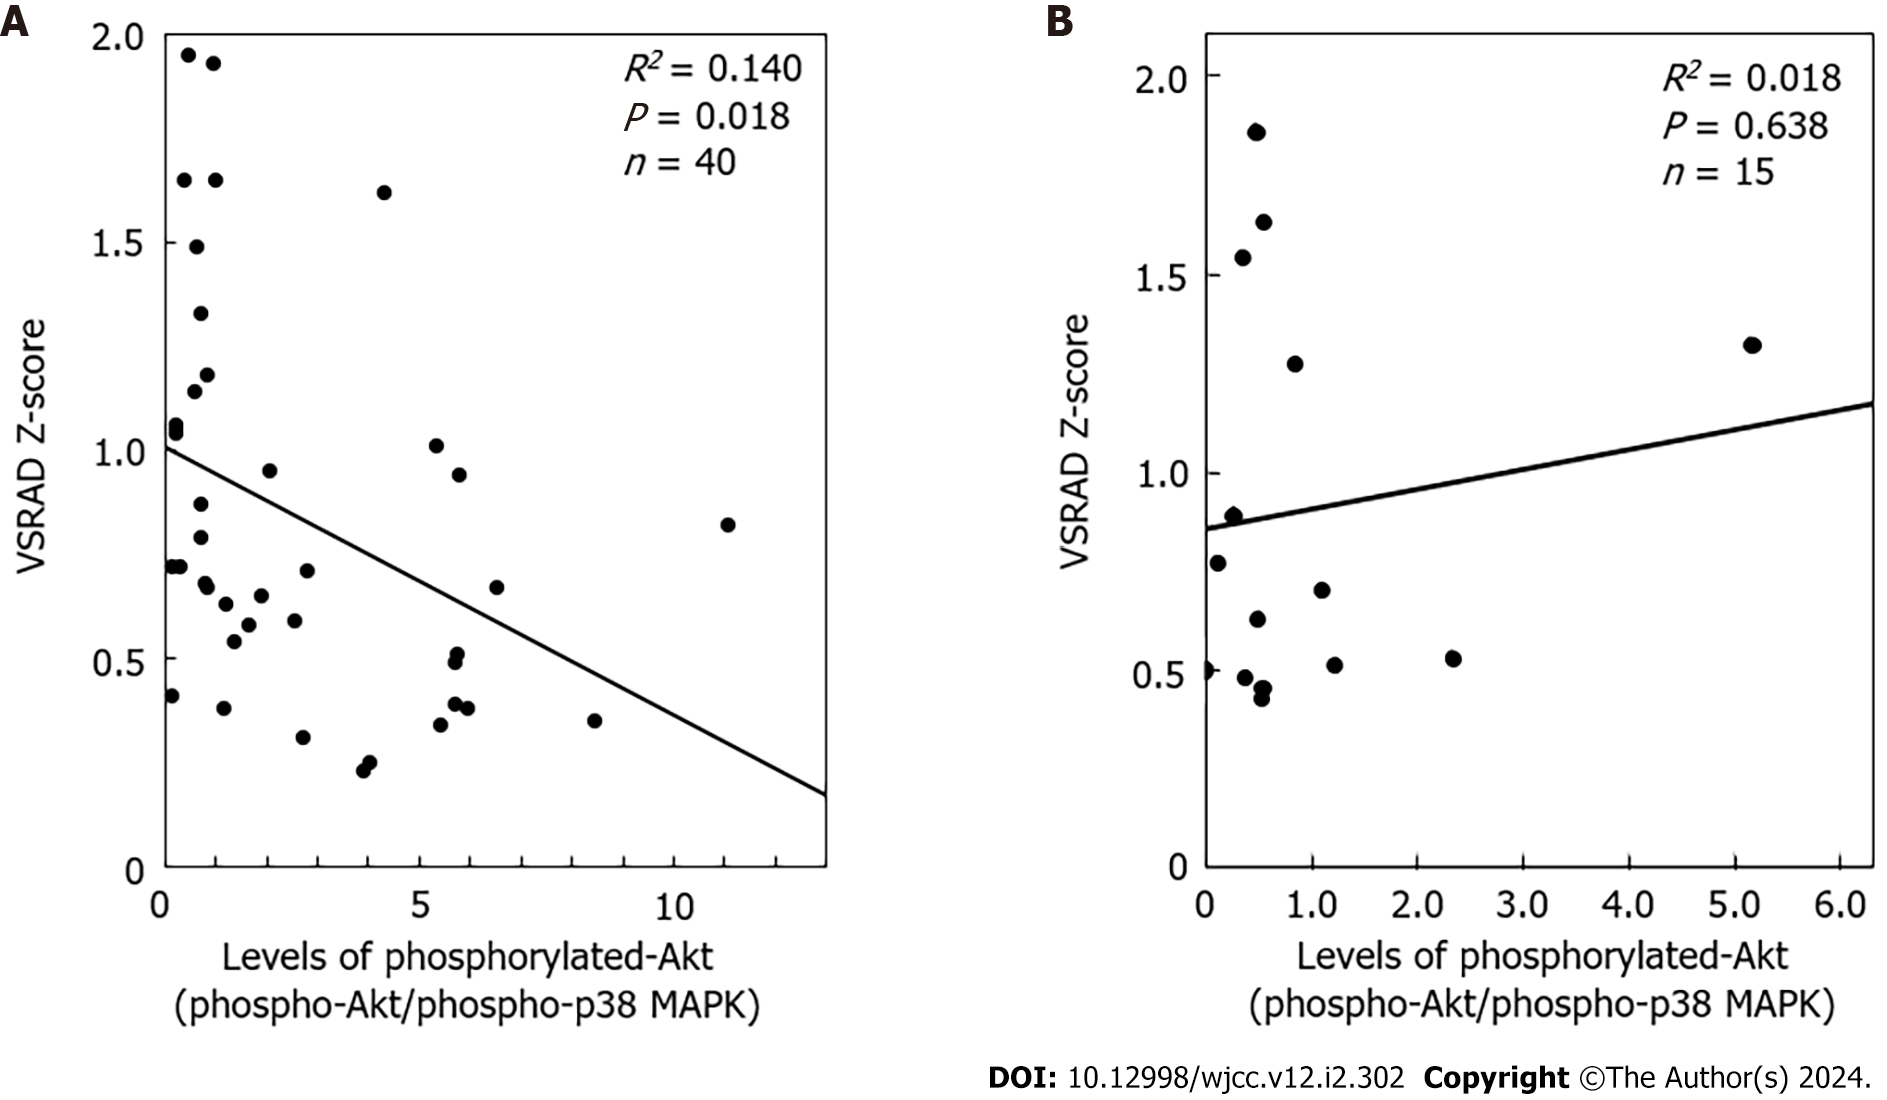
Figure 4 The relationship between the individual levels of phosphorylated Akt corrected with phosphorylated p38 mitogen-activated protein kinase (phosphorylated Akt/phosphorylated p38 mitogen-activated protein kinase) and the voxel-based specific regional analysis system for Alzheimer’s disease Z-score.
A: Type 2 diabetes mellitus (T2DM) group; B: The control group. The levels of phosphorylated Akt corrected with phosphorylated-p38 mitogen-activated protein kinase (MAPK) (phosphorylated-Akt/phosphorylated-p38 MAPK) in the T2DM group (A) and the control group (B) were plotted against the voxel-based specific regional analysis system for Alzheimer’s disease Z-scores. The plotted data were analysed by linear regression analysis. VSRAD: Voxel-based specific regional analysis system for Alzheimer’s disease; MAPK: Mitogen-activated protein kinase.
- Citation: Tokuda H, Hori T, Mizutani D, Hioki T, Kojima K, Onuma T, Enomoto Y, Doi T, Matsushima-Nishiwaki R, Ogura S, Iida H, Iwama T, Sakurai T, Kozawa O. Inverse relationship between platelet Akt activity and hippocampal atrophy: A pilot case-control study in patients with diabetes mellitus. World J Clin Cases 2024; 12(2): 302-313
- URL: https://www.wjgnet.com/2307-8960/full/v12/i2/302.htm
- DOI: https://dx.doi.org/10.12998/wjcc.v12.i2.302


