Copyright
©The Author(s) 2024.
World J Clin Cases. Jan 16, 2024; 12(2): 267-275
Published online Jan 16, 2024. doi: 10.12998/wjcc.v12.i2.267
Published online Jan 16, 2024. doi: 10.12998/wjcc.v12.i2.267
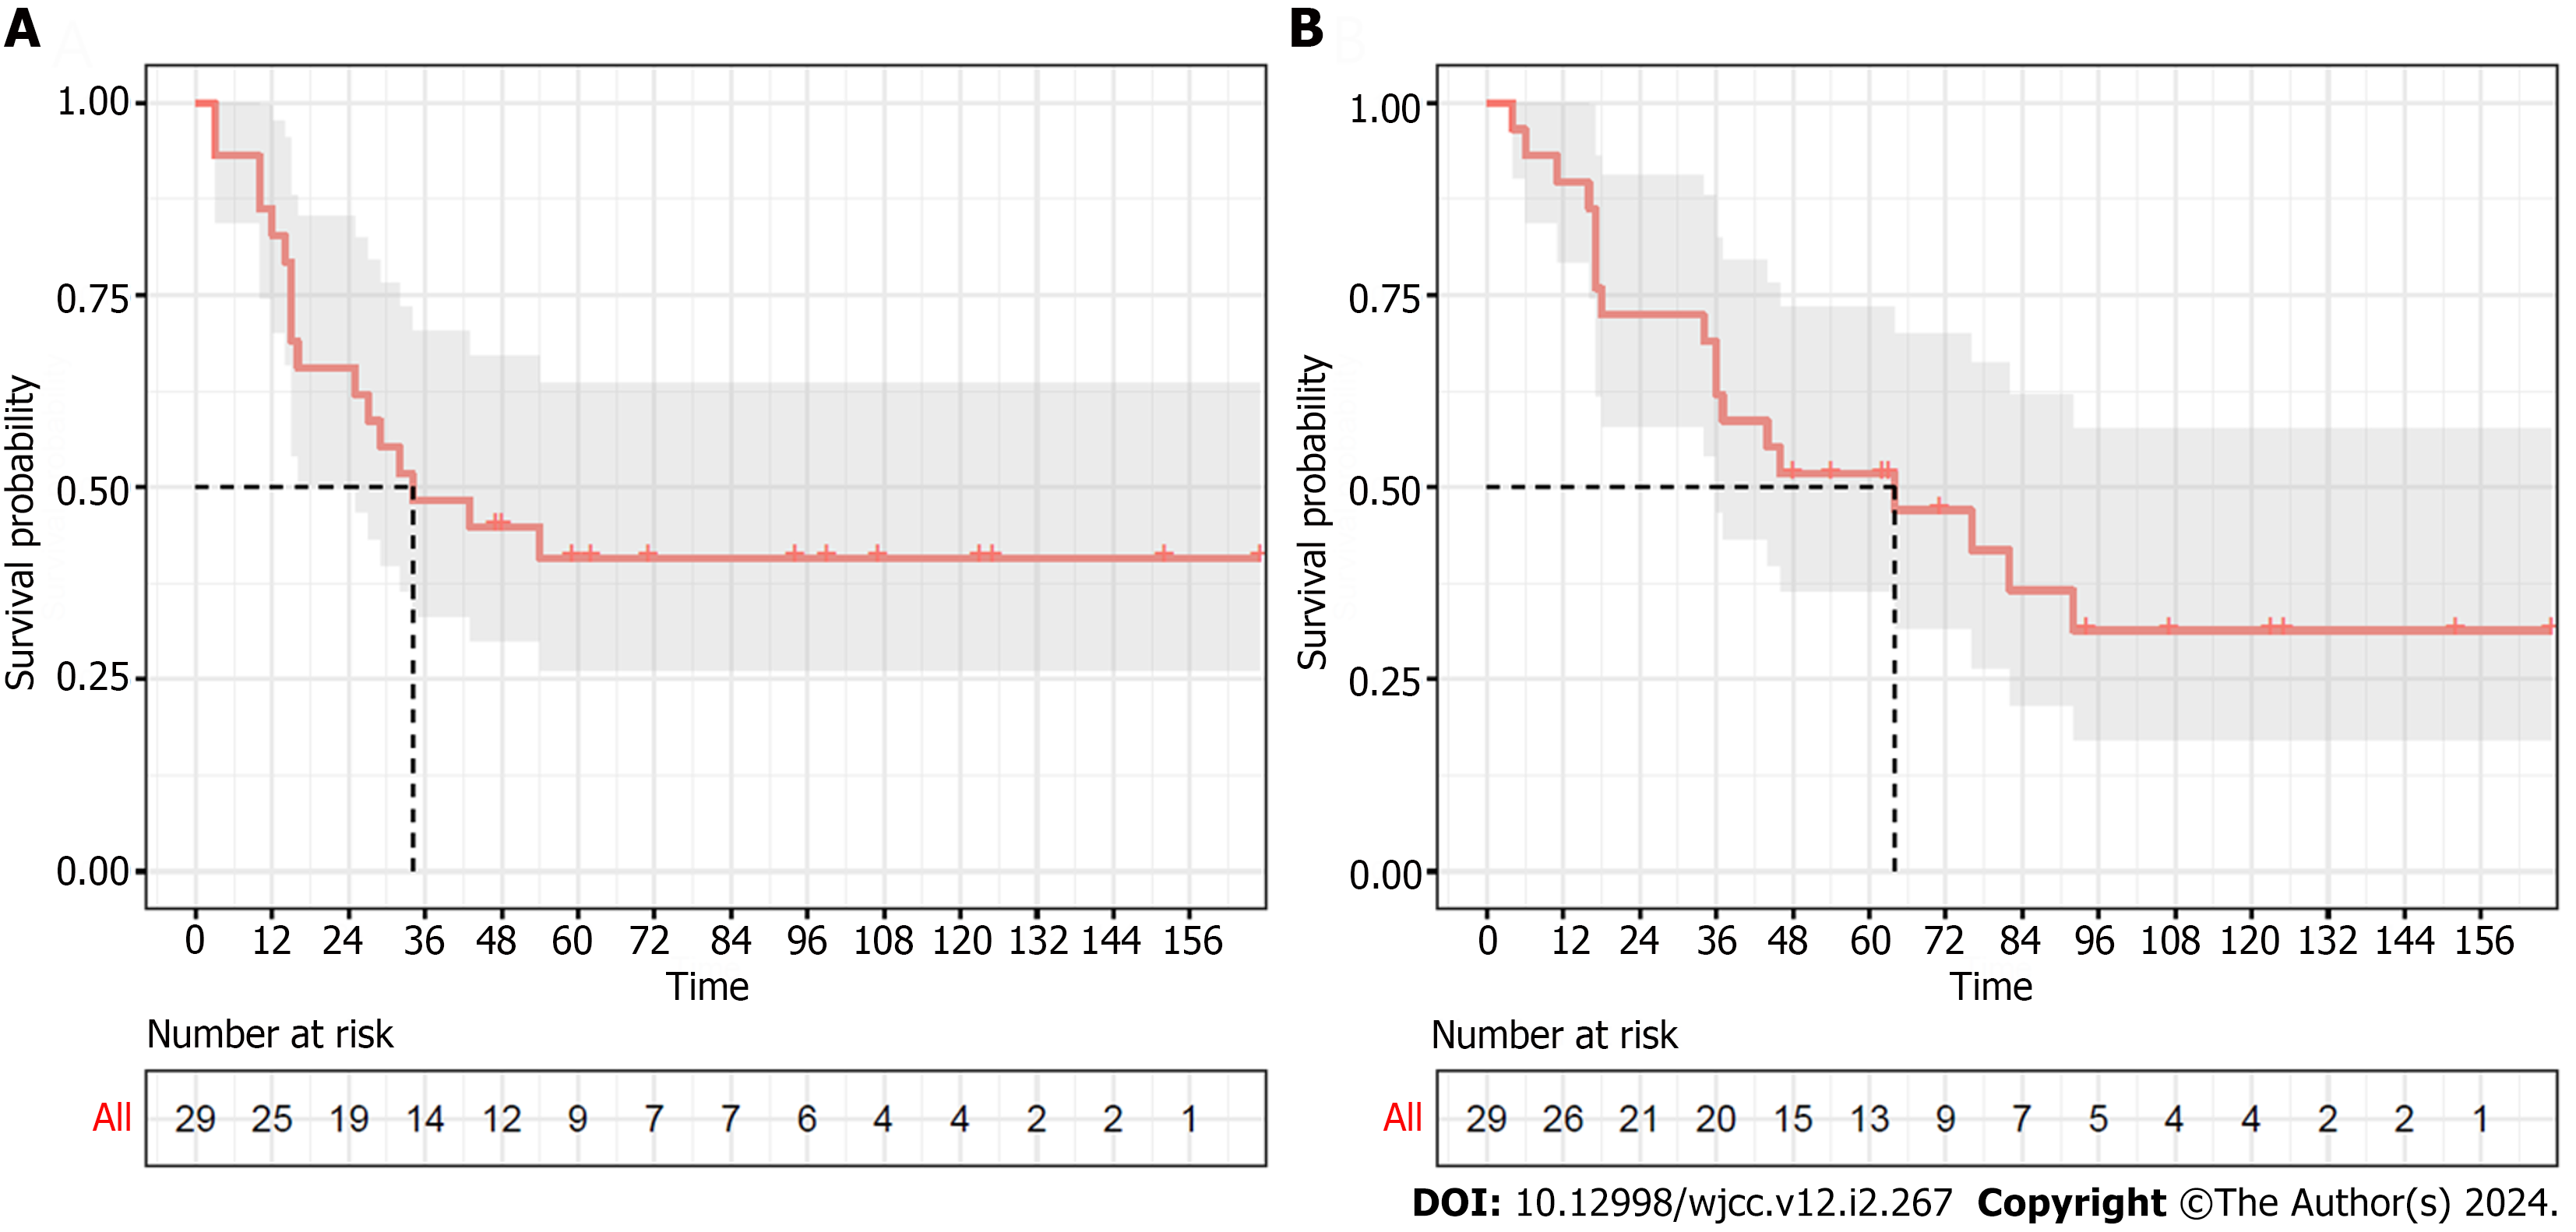
Figure 1 Kaplan-Meier curves of 29 AoV cancer patients.
A: Recurrence-free survival; B: Overall survival. The dashed line indicates the median survival time.
Figure 2 Kaplan-Meier curves between concurrent chemoradiotherapy (n = 11) and non-concurrent chemoradiotherapy groups (n = 18).
A: Recurrence-free survival; B: Overall survival. CCRT: Concurrent chemoradiotherapy.
- Citation: Kwon CH, Seo HI, Kim DU, Han SY, Kim S, Lee NK, Hong SB, Ahn JH, Park YM, Noh BG. Survival benefit of concurrent chemoradiotherapy for advanced ampulla of Vater cancer. World J Clin Cases 2024; 12(2): 267-275
- URL: https://www.wjgnet.com/2307-8960/full/v12/i2/267.htm
- DOI: https://dx.doi.org/10.12998/wjcc.v12.i2.267


