Copyright
©The Author(s) 2024.
World J Clin Cases. Jan 16, 2024; 12(2): 256-266
Published online Jan 16, 2024. doi: 10.12998/wjcc.v12.i2.256
Published online Jan 16, 2024. doi: 10.12998/wjcc.v12.i2.256
Figure 1 The blood pressure variability variations.
A: 24 h diastolic blood pressure variability; B: 24 h systolic blood pressure variability.
Figure 2 The baroreflex sensitivity variations.
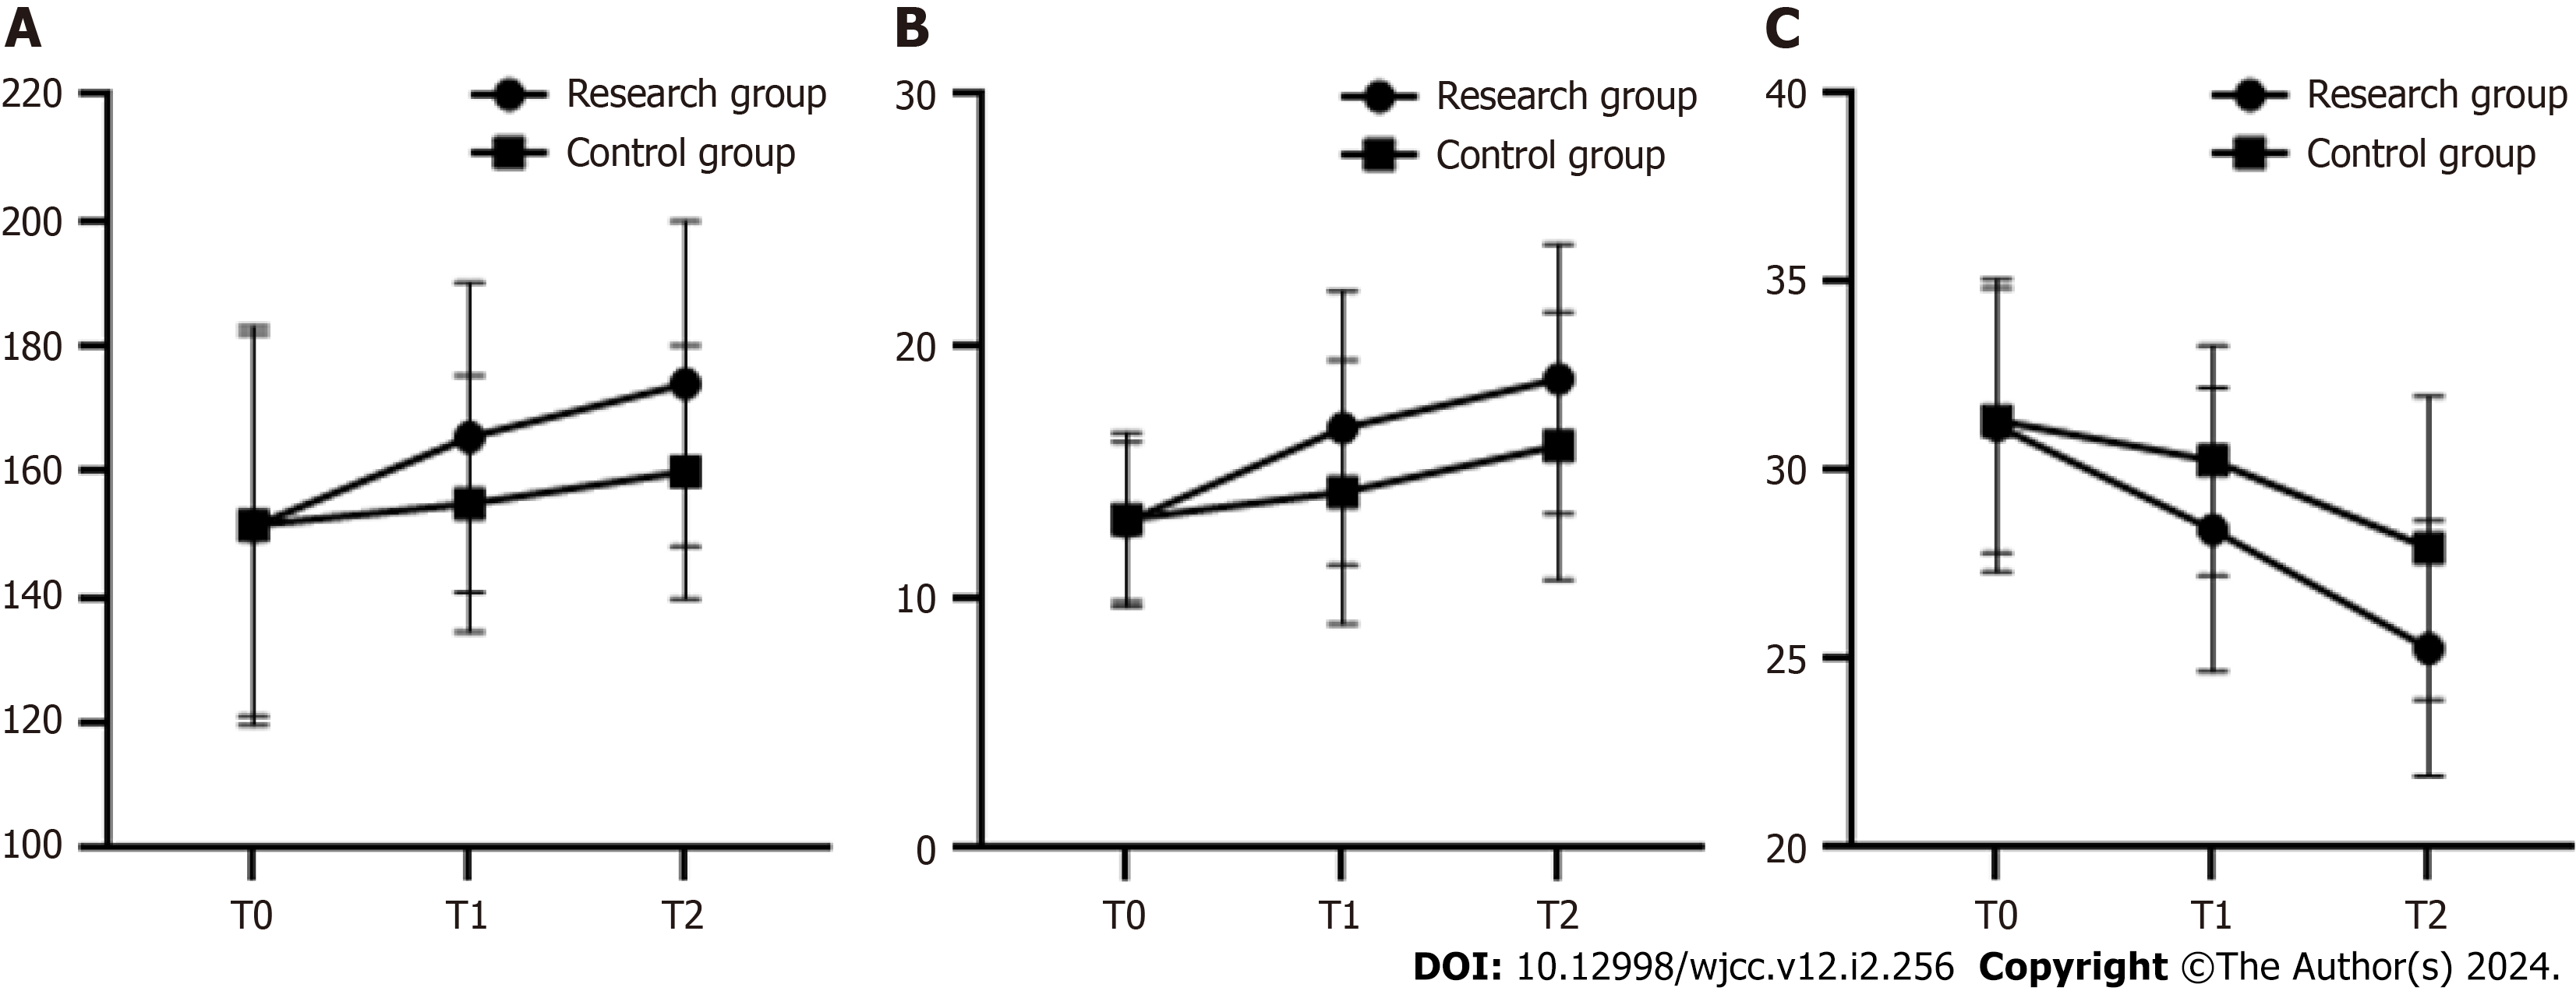
Figure 3 The changes in cardiopulmonary function indicators.
A: Peak heart rate and systolic blood pressure product; B: 1 min heart rate recovery; C: Carbon dioxide ventilation equivalent slope.
Figure 4 Incidence rate of adverse events after treatment.
- Citation: Liu HN, Gao B. Exploration of cardiac rehabilitation nursing for elderly patients with myocardial infarction based on individualized cardiac rehabilitation. World J Clin Cases 2024; 12(2): 256-266
- URL: https://www.wjgnet.com/2307-8960/full/v12/i2/256.htm
- DOI: https://dx.doi.org/10.12998/wjcc.v12.i2.256


