Copyright
©The Author(s) 2024.
World J Clin Cases. Jan 16, 2024; 12(2): 240-248
Published online Jan 16, 2024. doi: 10.12998/wjcc.v12.i2.240
Published online Jan 16, 2024. doi: 10.12998/wjcc.v12.i2.240
Figure 1 Ultrasonic imaging of the described case.
A: Ultrasound image of the fetus at 24+1 wk; B: Ultrasound image of the fetus at 30+4 wk; C: Ultrasound image of the fetus at 30+6 wk. The orange arrows indicate umbilical artery blood flow.
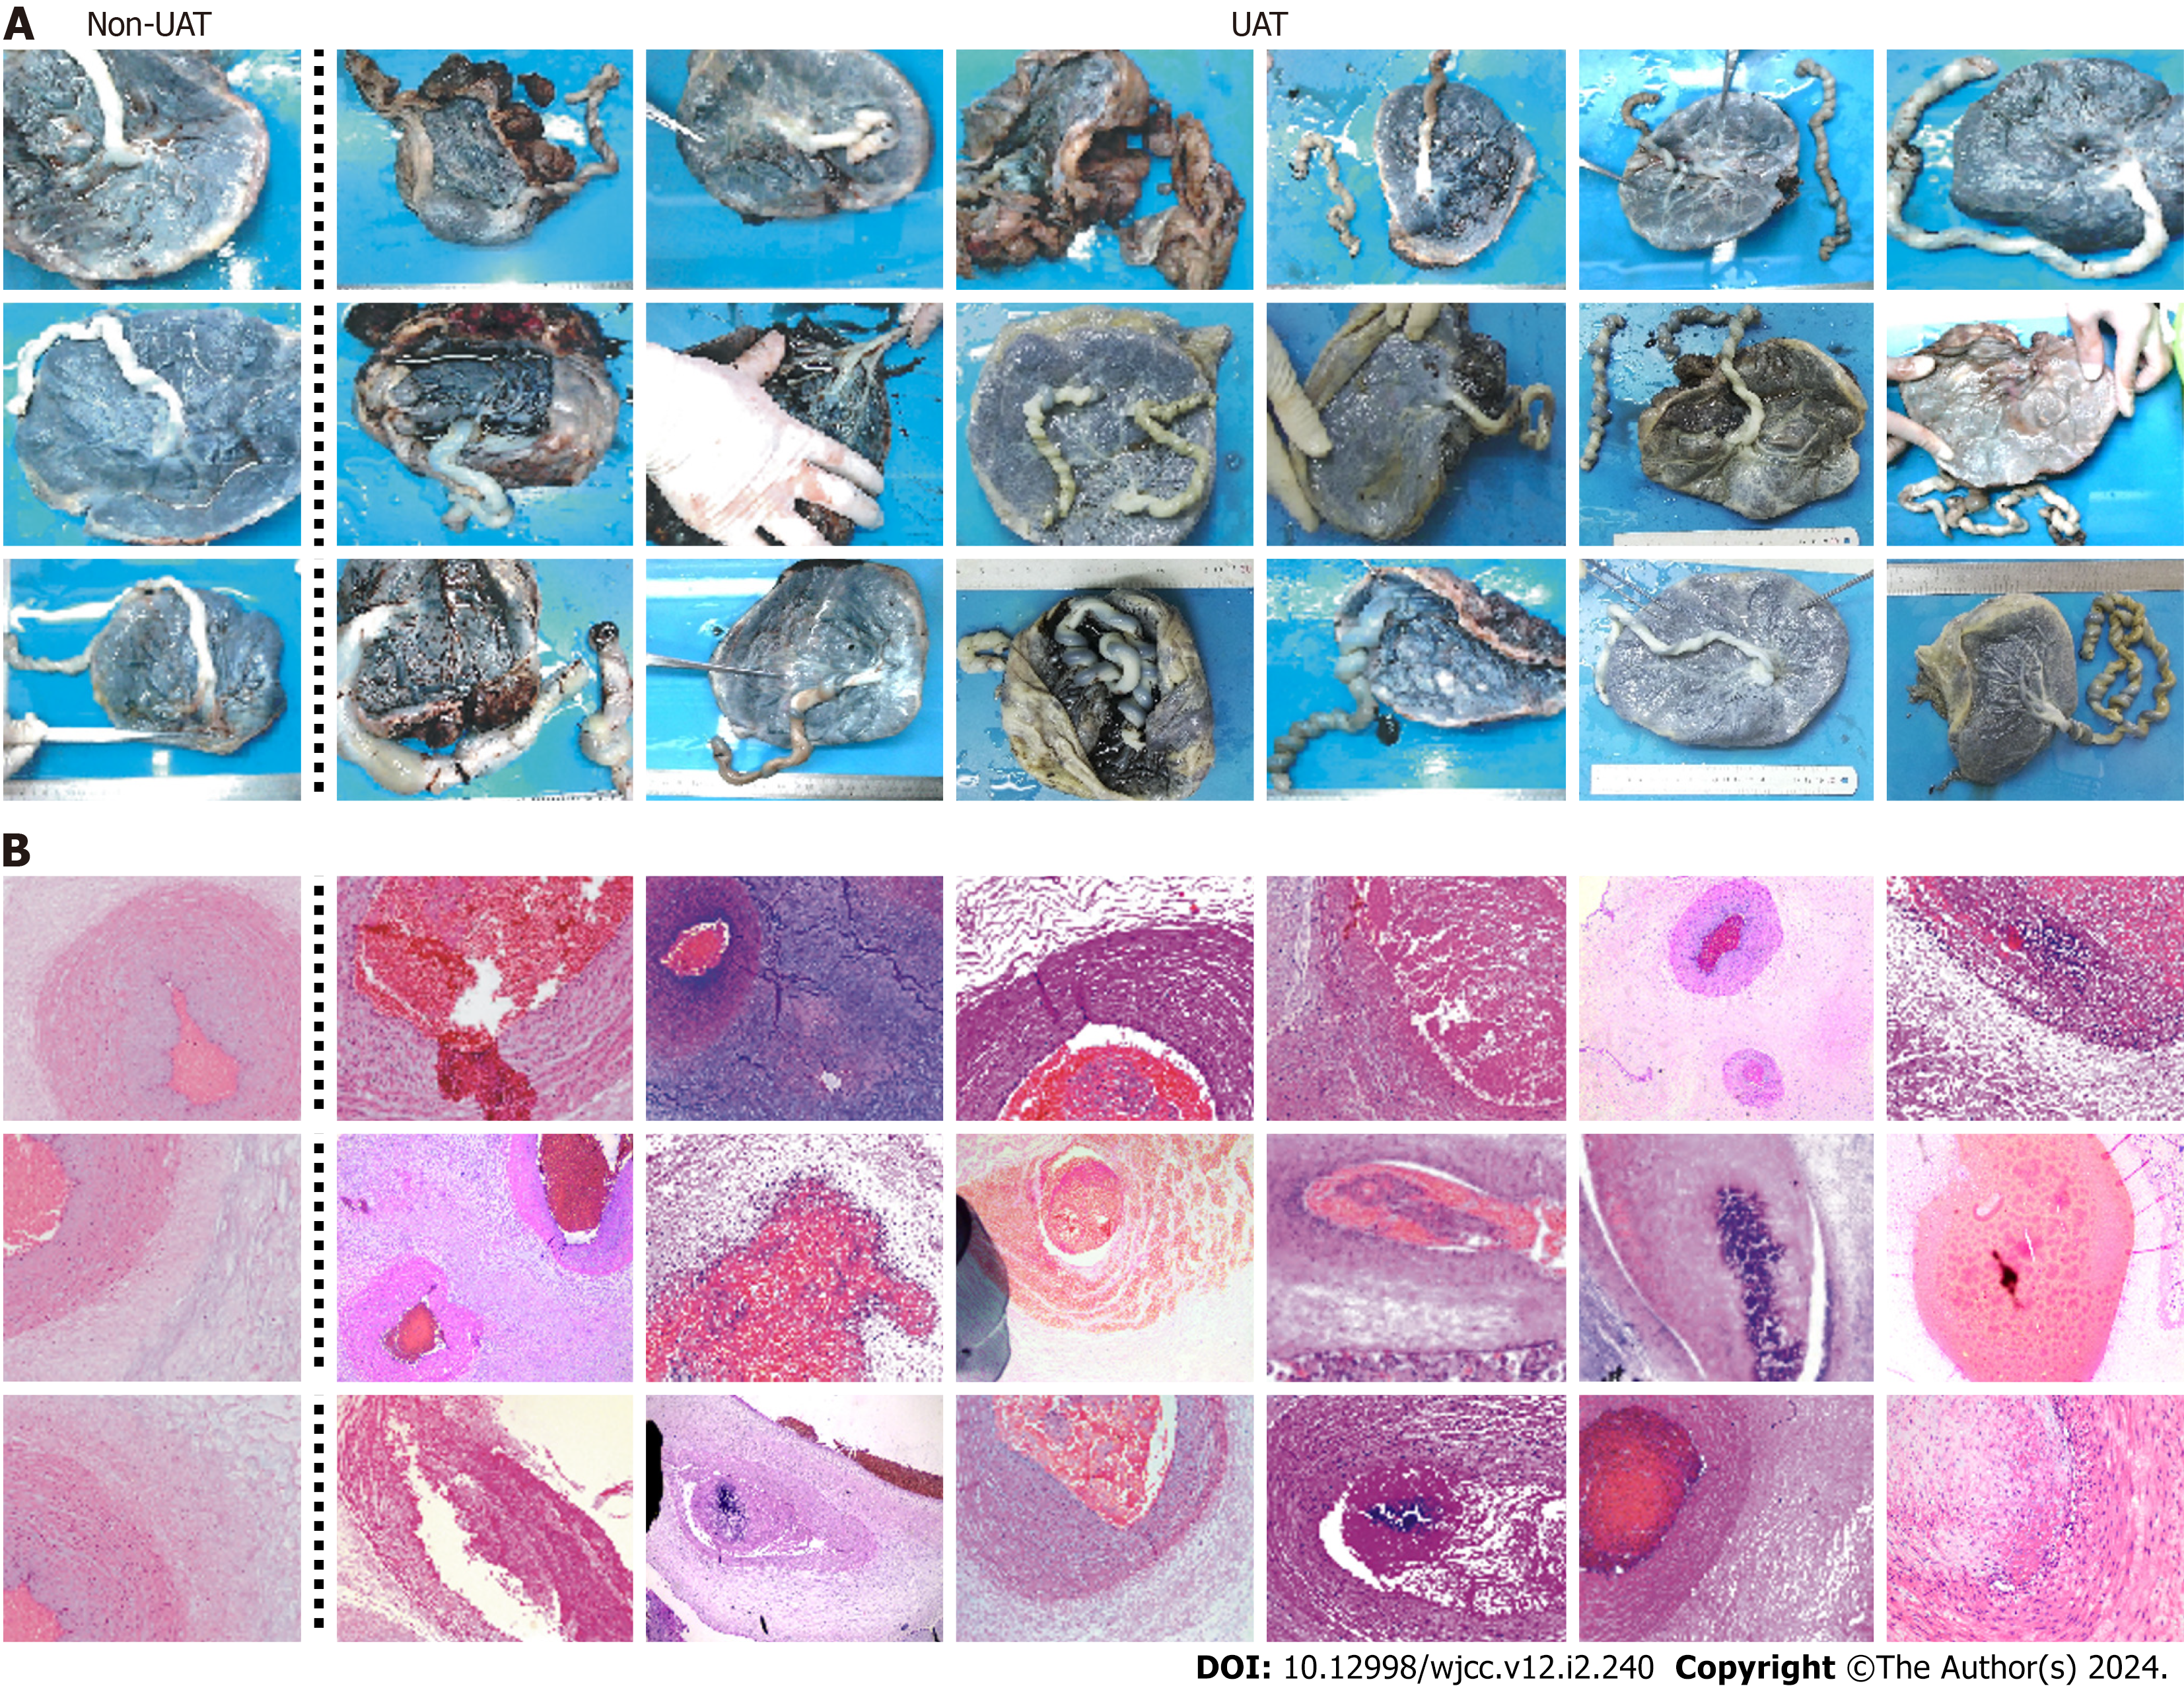
Figure 2 Pathological findings of umbilical artery thrombosis compared with normal umbilical artery.
A: Gross appearance of the umbilical cord; B: Pathological examination of the umbilical cord stained by hematoxylin and eosin.
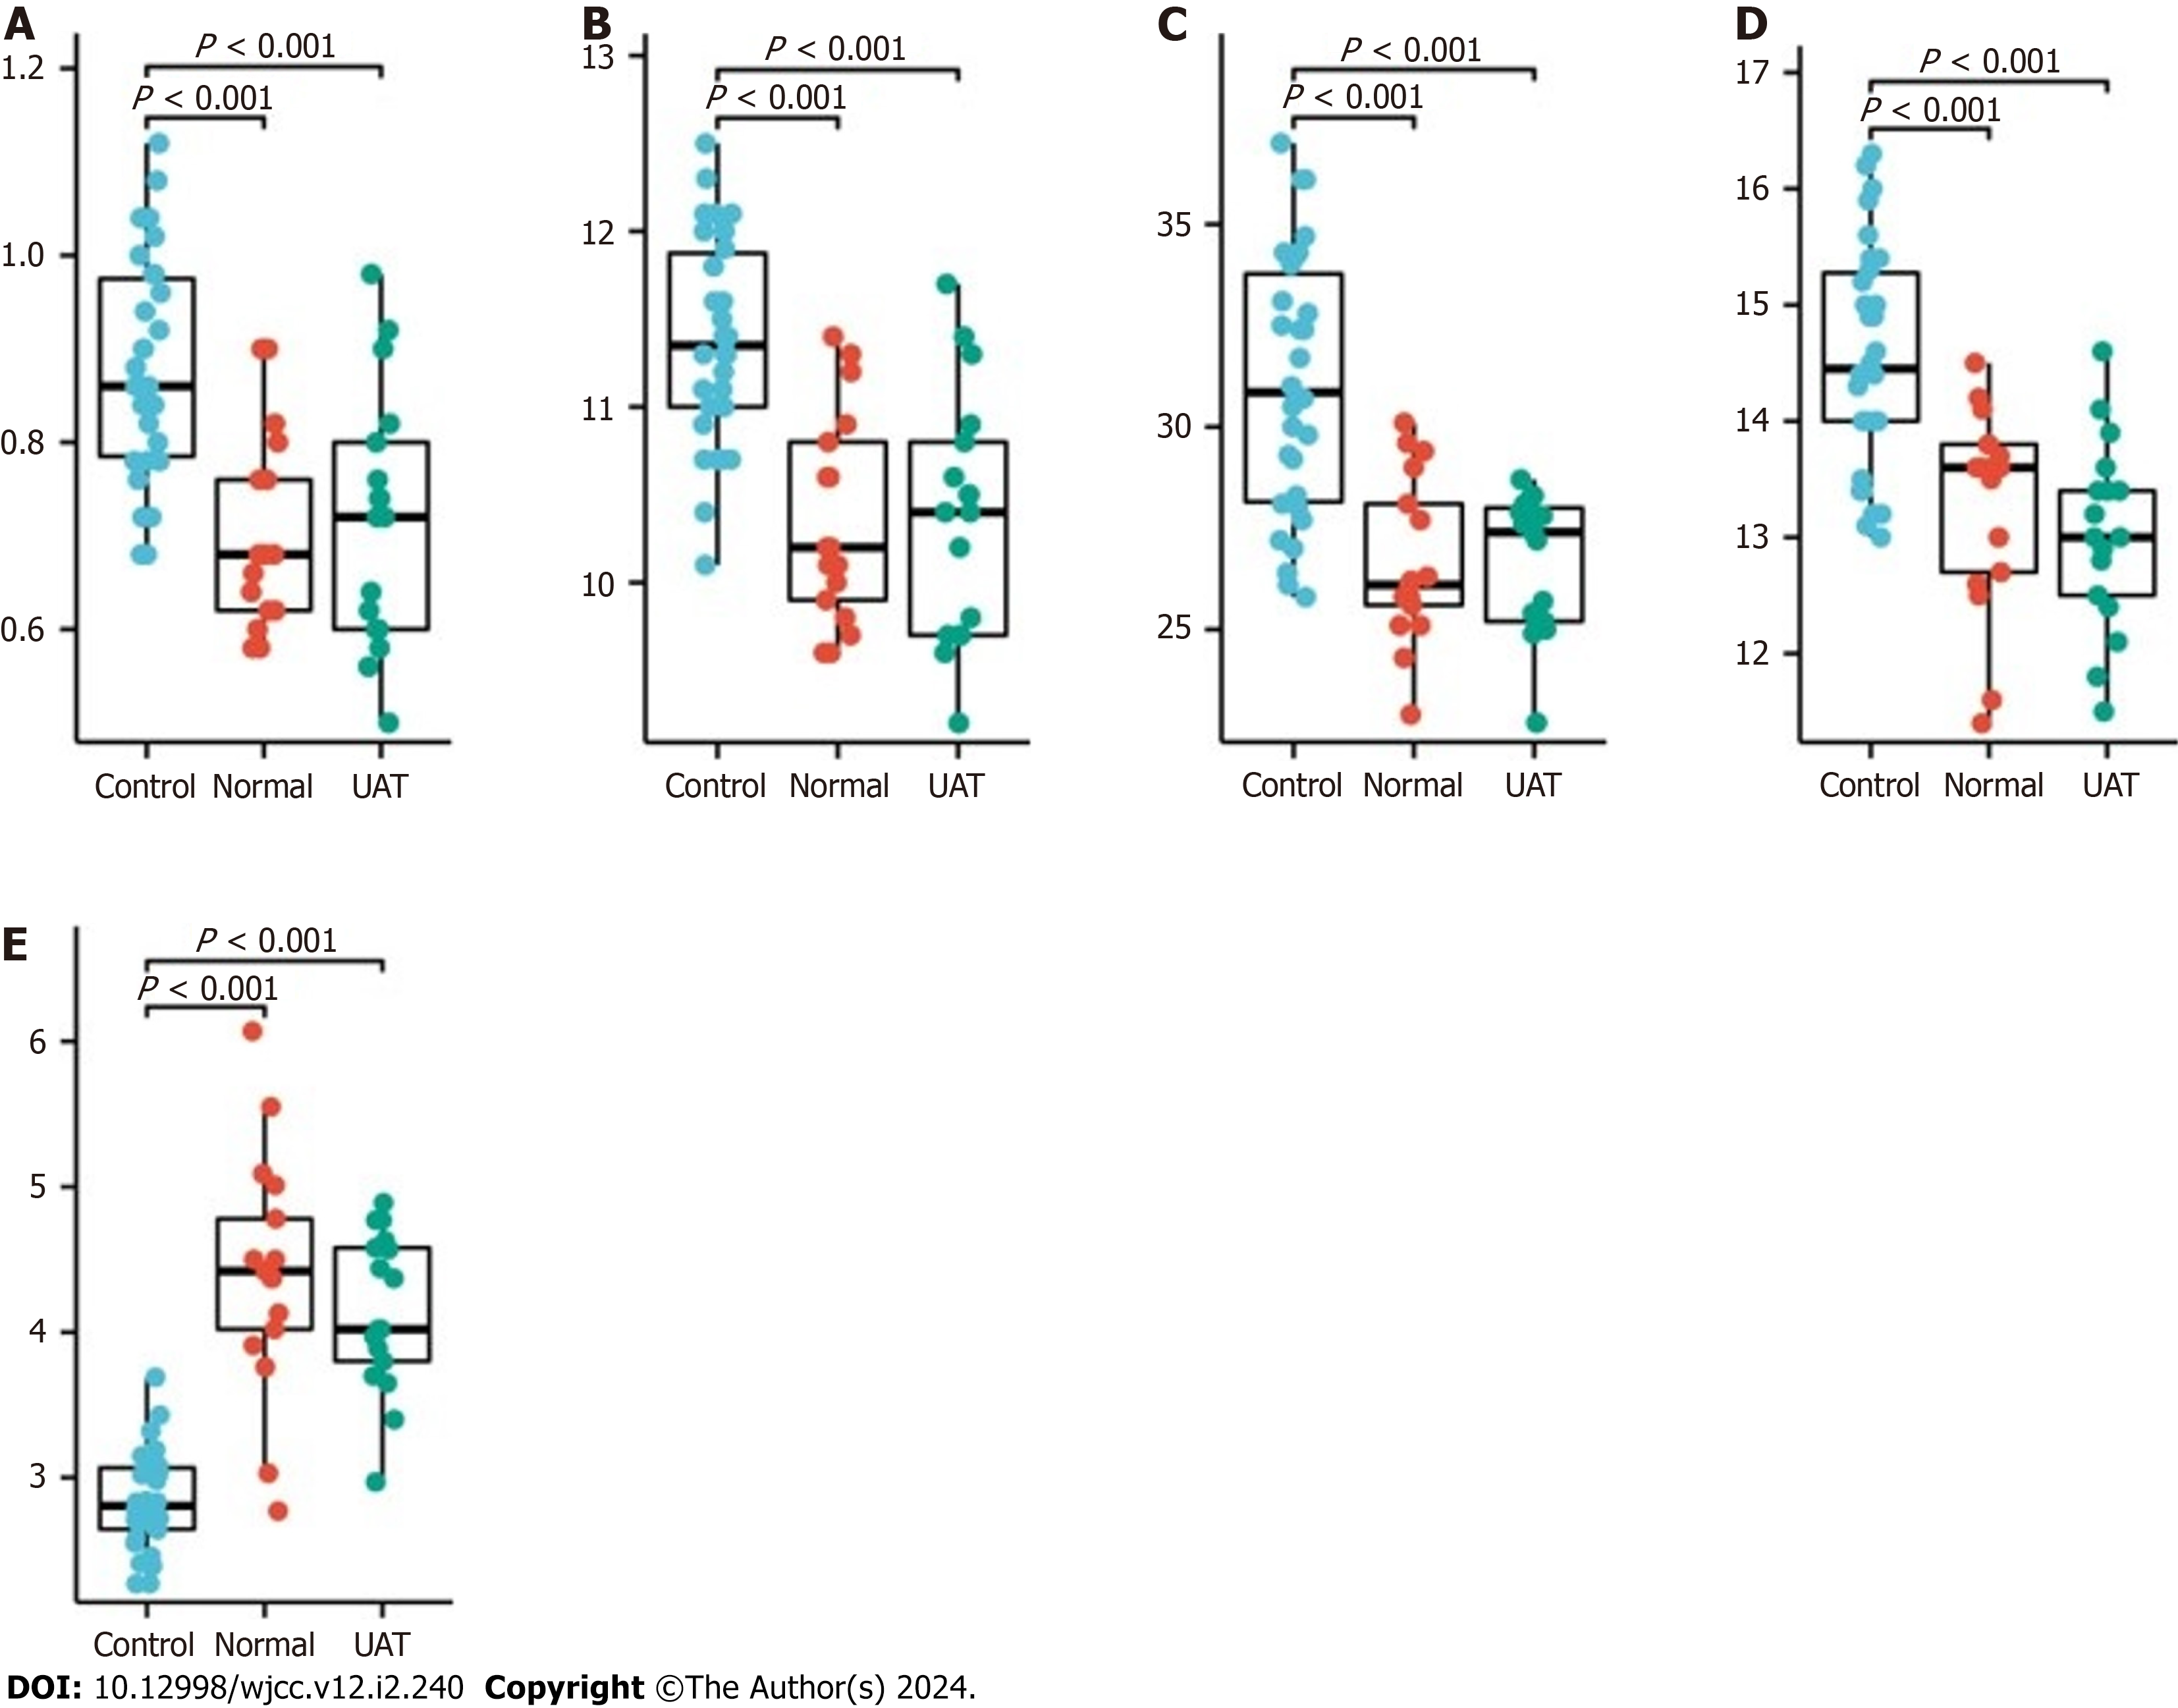
Figure 3 Coagulation data in control normal women (n = 30), pregnant women (n = 17) and pregnant women with umbilical artery thrombosis (n = 17).
A: Comparison of International Normalized Ratio among normal women (control), pregnant women (normal), and pregnant women with umbilical artery thrombosis (UAT) groups. B: Comparison of Prothrombin Time (s) among control, normal and UAT groups. C: Comparison of Activated Partial Thromboplastin Time (s) among control, normal and UAT groups. D: Comparison of Thrombin Time (s) among control, normal and UAT groups. E: Comparison of Fibrinogen (g/L) among control, normal and UAT groups. The P-values indicates significant differences.
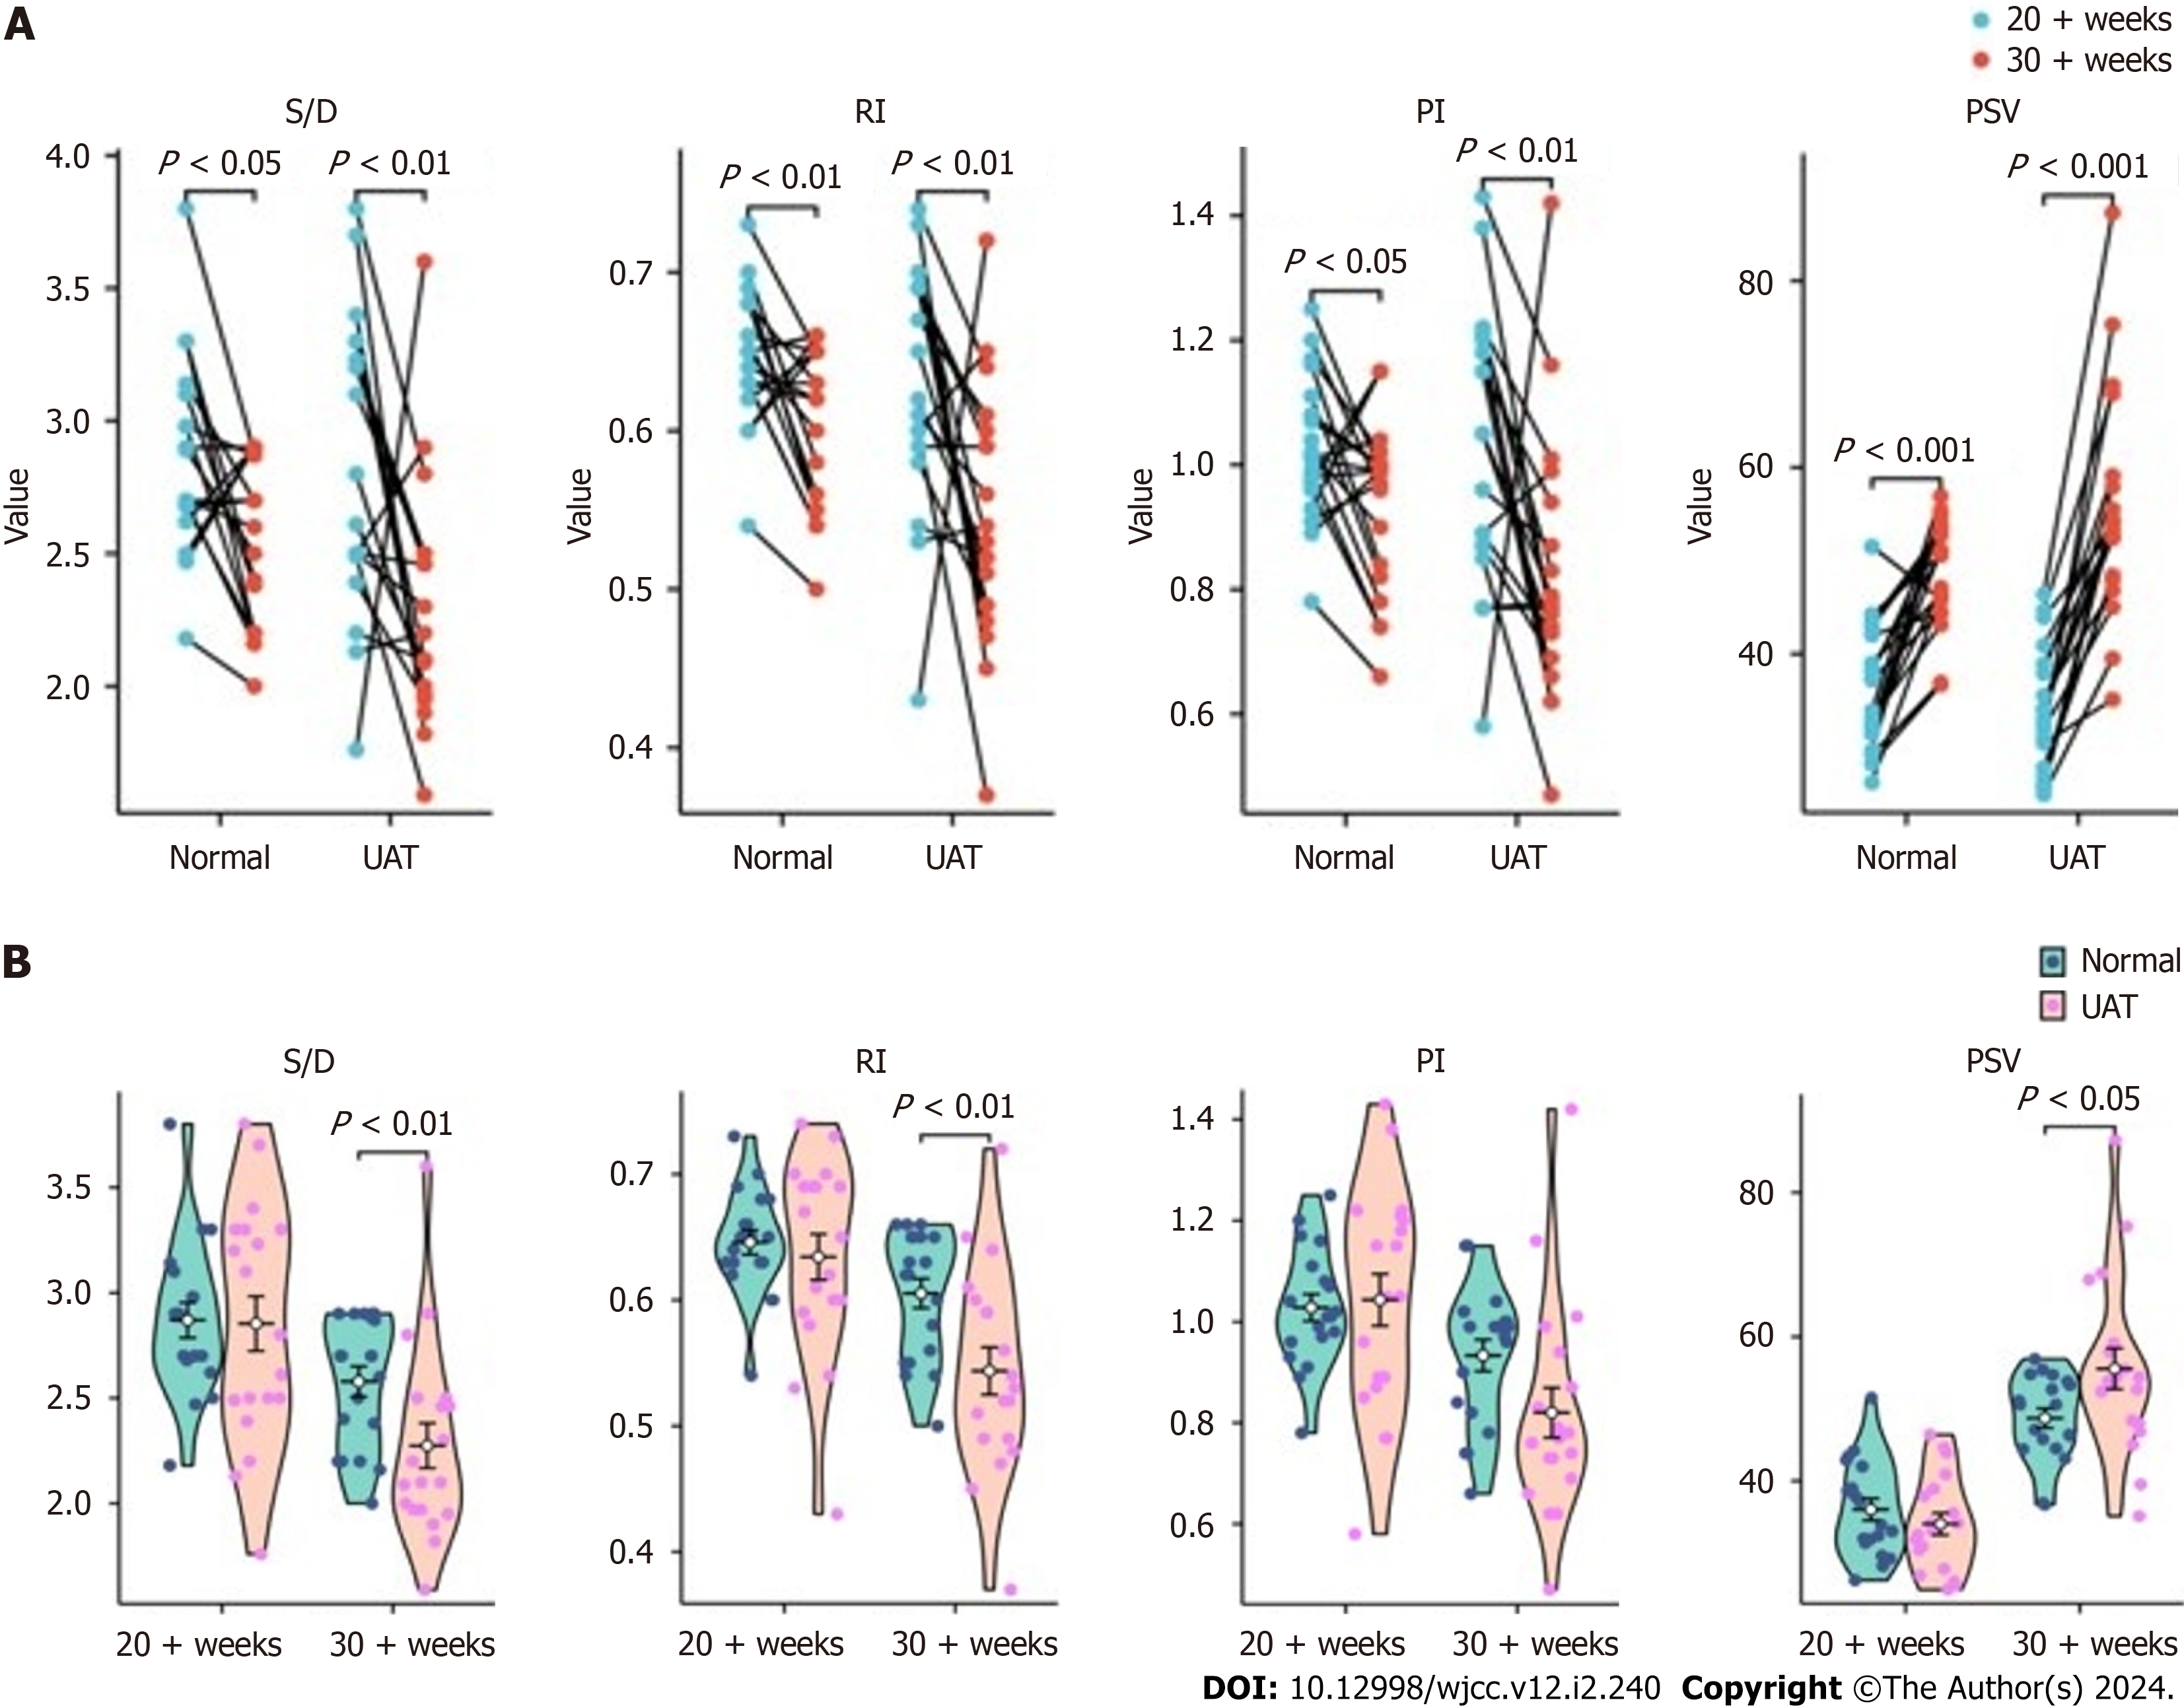
Figure 4 Statistical analysis of umbilical artery blood flow ultrasound indices of patients with umbilical artery thrombosis (n = 19) vs non-umbilical artery thrombosis women (n = 19).
A: Second trimester vs third trimester; B: Umbilical artery thrombosis (UAT) patients vs non-UAT women. UAT: Umbilical artery thrombosis; S/D: Systolic-diastolic duration ratio; RI: Resistance index; PI: Pulsatility index; PSV: Peak systolic velocity.
- Citation: Hong SJ, Hong LW, He XQ, Zhong XH. Ultrasound blood flow characteristics changes in fetal umbilical artery thrombosis: A retrospective analysis. World J Clin Cases 2024; 12(2): 240-248
- URL: https://www.wjgnet.com/2307-8960/full/v12/i2/240.htm
- DOI: https://dx.doi.org/10.12998/wjcc.v12.i2.240


