Copyright
©The Author(s) 2024.
World J Clin Cases. Jun 26, 2024; 12(18): 3385-3394
Published online Jun 26, 2024. doi: 10.12998/wjcc.v12.i18.3385
Published online Jun 26, 2024. doi: 10.12998/wjcc.v12.i18.3385
Figure 1 Lasso regression analysis was used for variable selection to identify the most predictive clinical factors.
A: The Lasso weight coefficient distribution of the screened variables; B: Penalty coefficient (λ) and binomial deviation diagram; C: Venn diagram showing features selected by univariate Cox regression and Lasso regression.
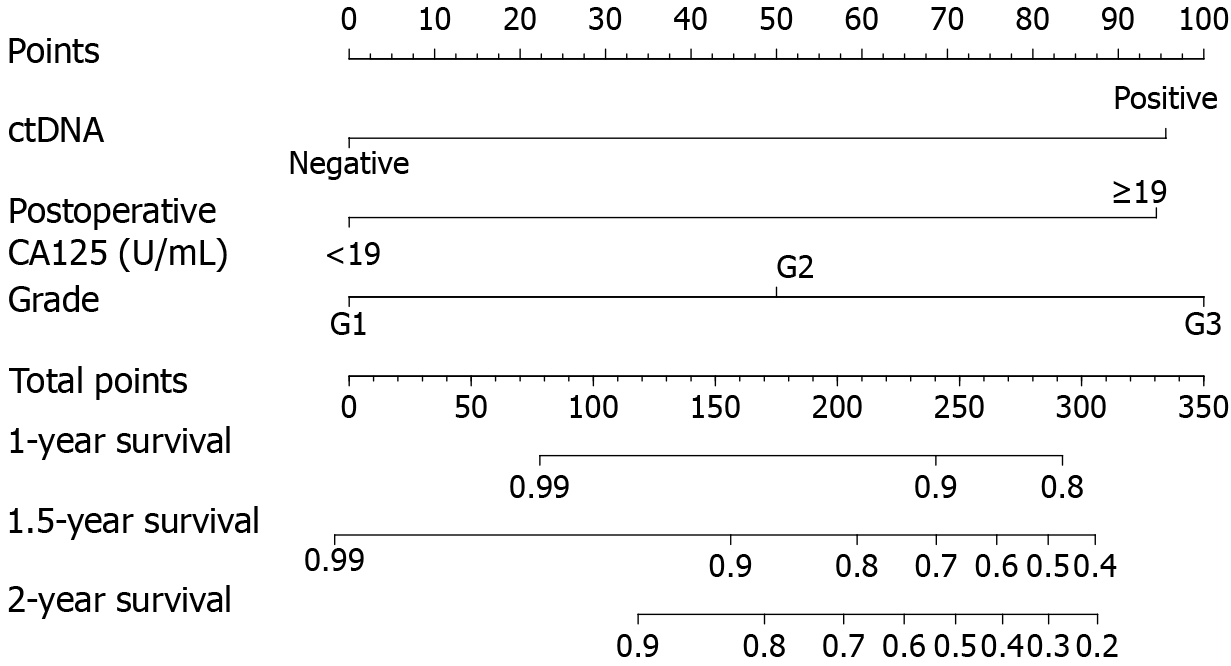
Figure 2 Prognostic nomogram used to predict the 1-year, 1.
5-year, and 2-year probability of postoperative recurrence-free survival in patients with endometrial cancer. ctDNA: Circulating tumor DNA; CA125: Carcinoembryonic antigen 125.
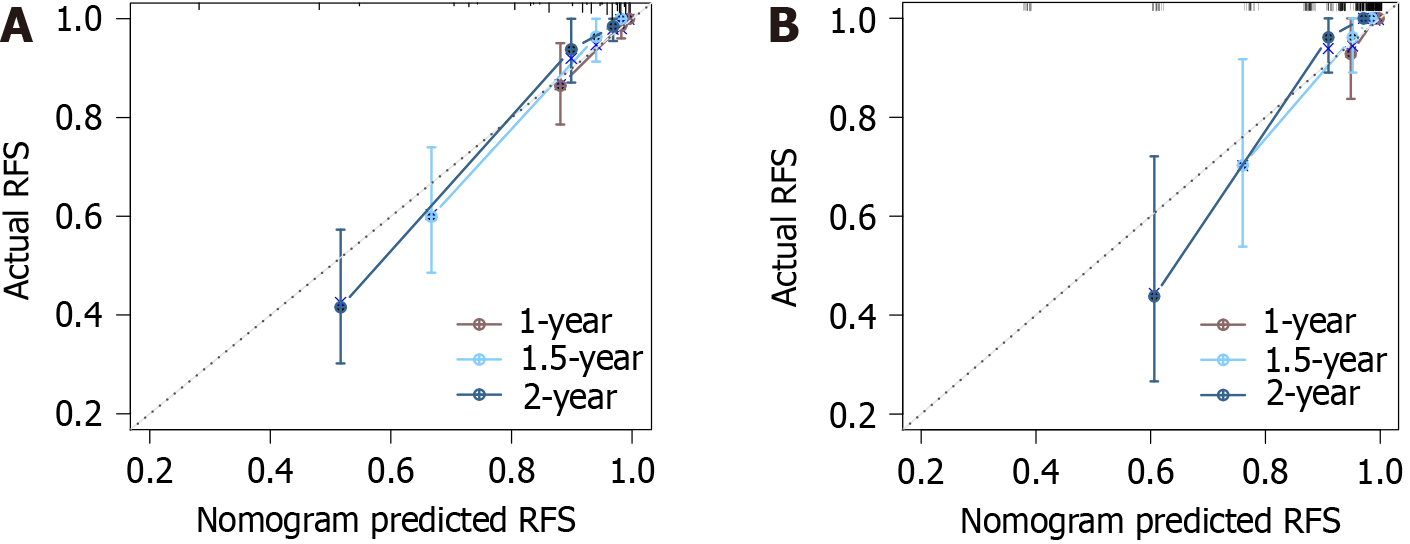
Figure 3 Calibration curves of the nomogram.
A: Training set; B: Validation set. RFS: Recurrence-free survival.
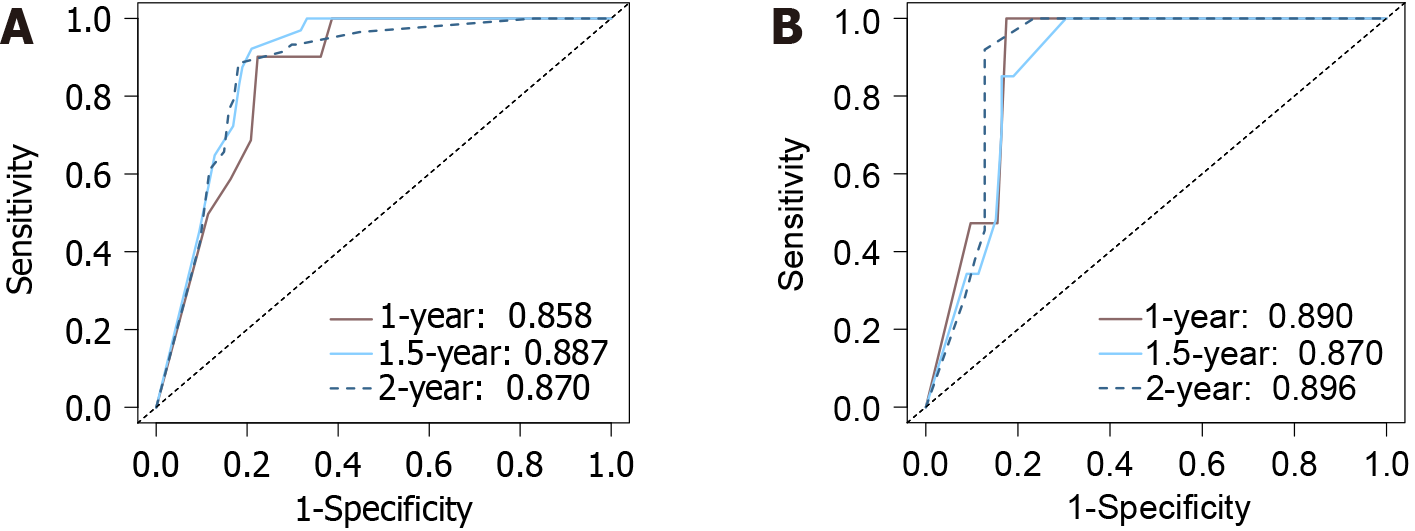
Figure 4 Receiver operating characteristic curves of the nomogram.
A: Training set; B: Validation set.
Figure 5 Decision curve analysis of the nomogram.
A: 1-year decision curve; B: 1.5-year decision curve; C: 2-year decision curve.
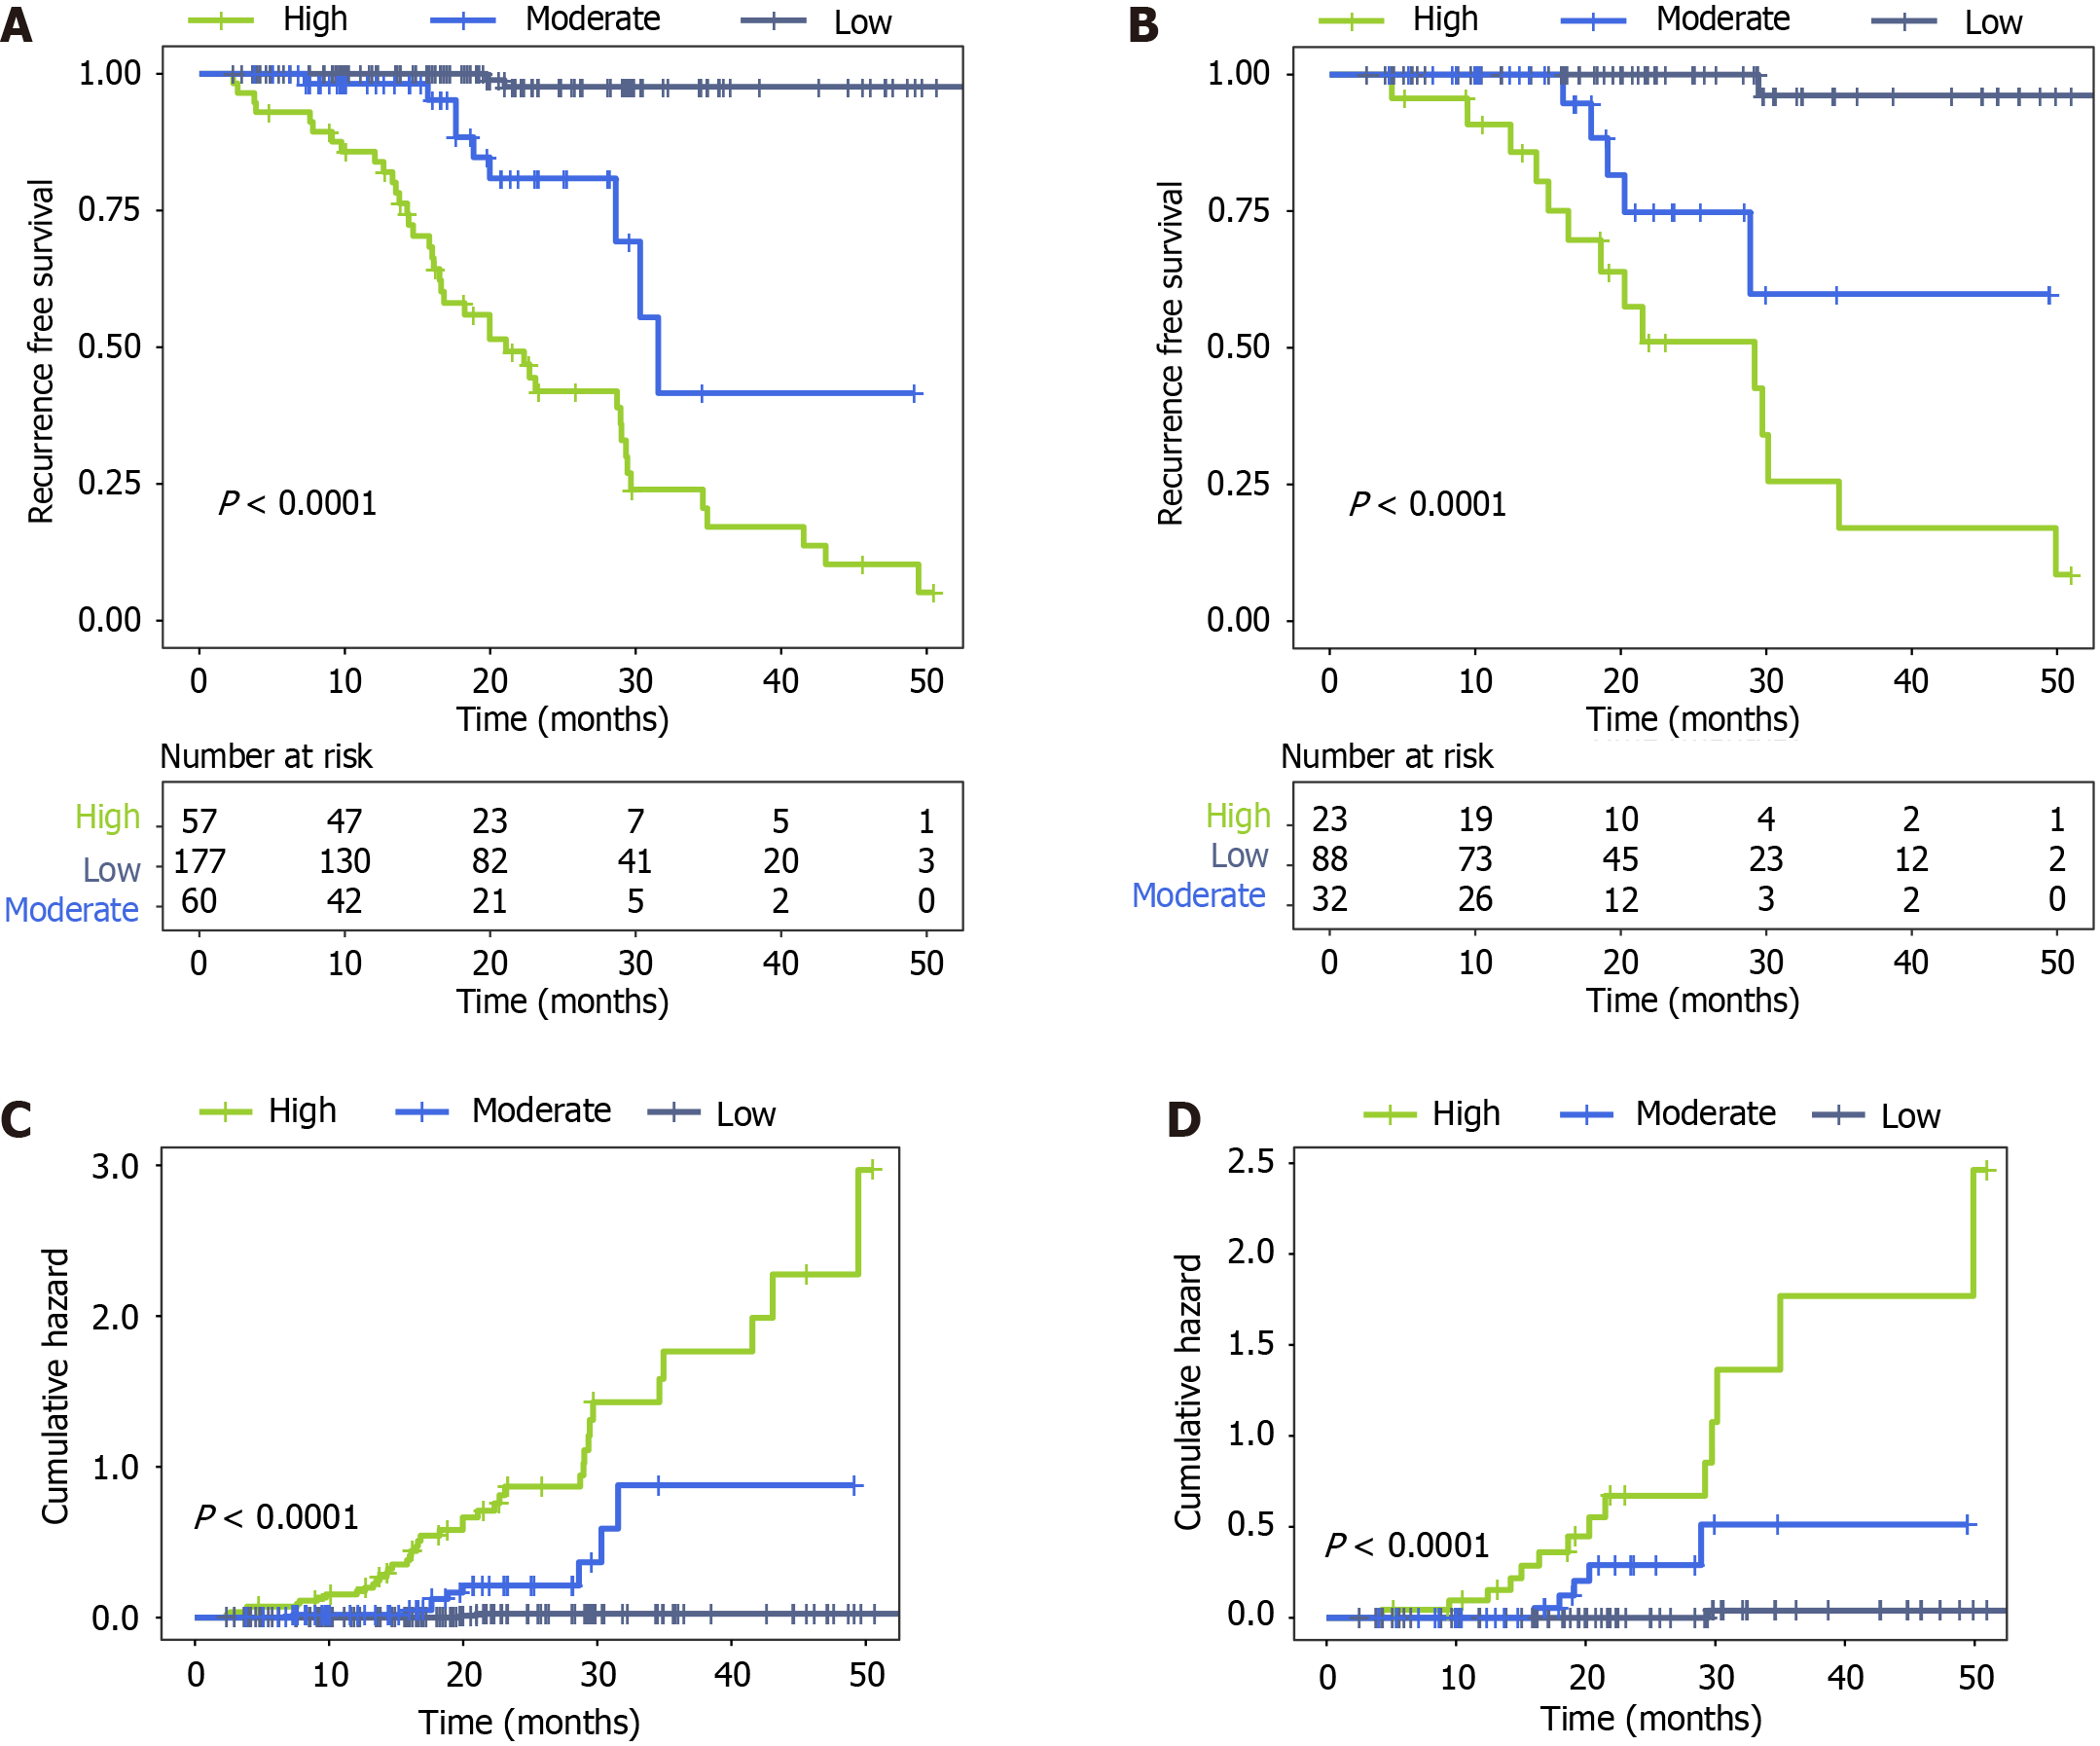
Figure 6 Survival analysis and cumulative hazard analysis of the training and validation sets.
A: Kaplan-Meier survival analysis curve for the training set; B: Kaplan-Meier survival analysis curve for the validation set; C: Cumulative hazard curve for the training set; D: Cumulative hazard curve for the validation set.
- Citation: Liu Y, Lu XN, Guo HM, Bao C, Zhang J, Jin YN. Development and validation of a circulating tumor DNA-based optimization-prediction model for short-term postoperative recurrence of endometrial cancer. World J Clin Cases 2024; 12(18): 3385-3394
- URL: https://www.wjgnet.com/2307-8960/full/v12/i18/3385.htm
- DOI: https://dx.doi.org/10.12998/wjcc.v12.i18.3385


