Copyright
©The Author(s) 2024.
World J Clin Cases. Jun 16, 2024; 12(17): 3105-3122
Published online Jun 16, 2024. doi: 10.12998/wjcc.v12.i17.3105
Published online Jun 16, 2024. doi: 10.12998/wjcc.v12.i17.3105
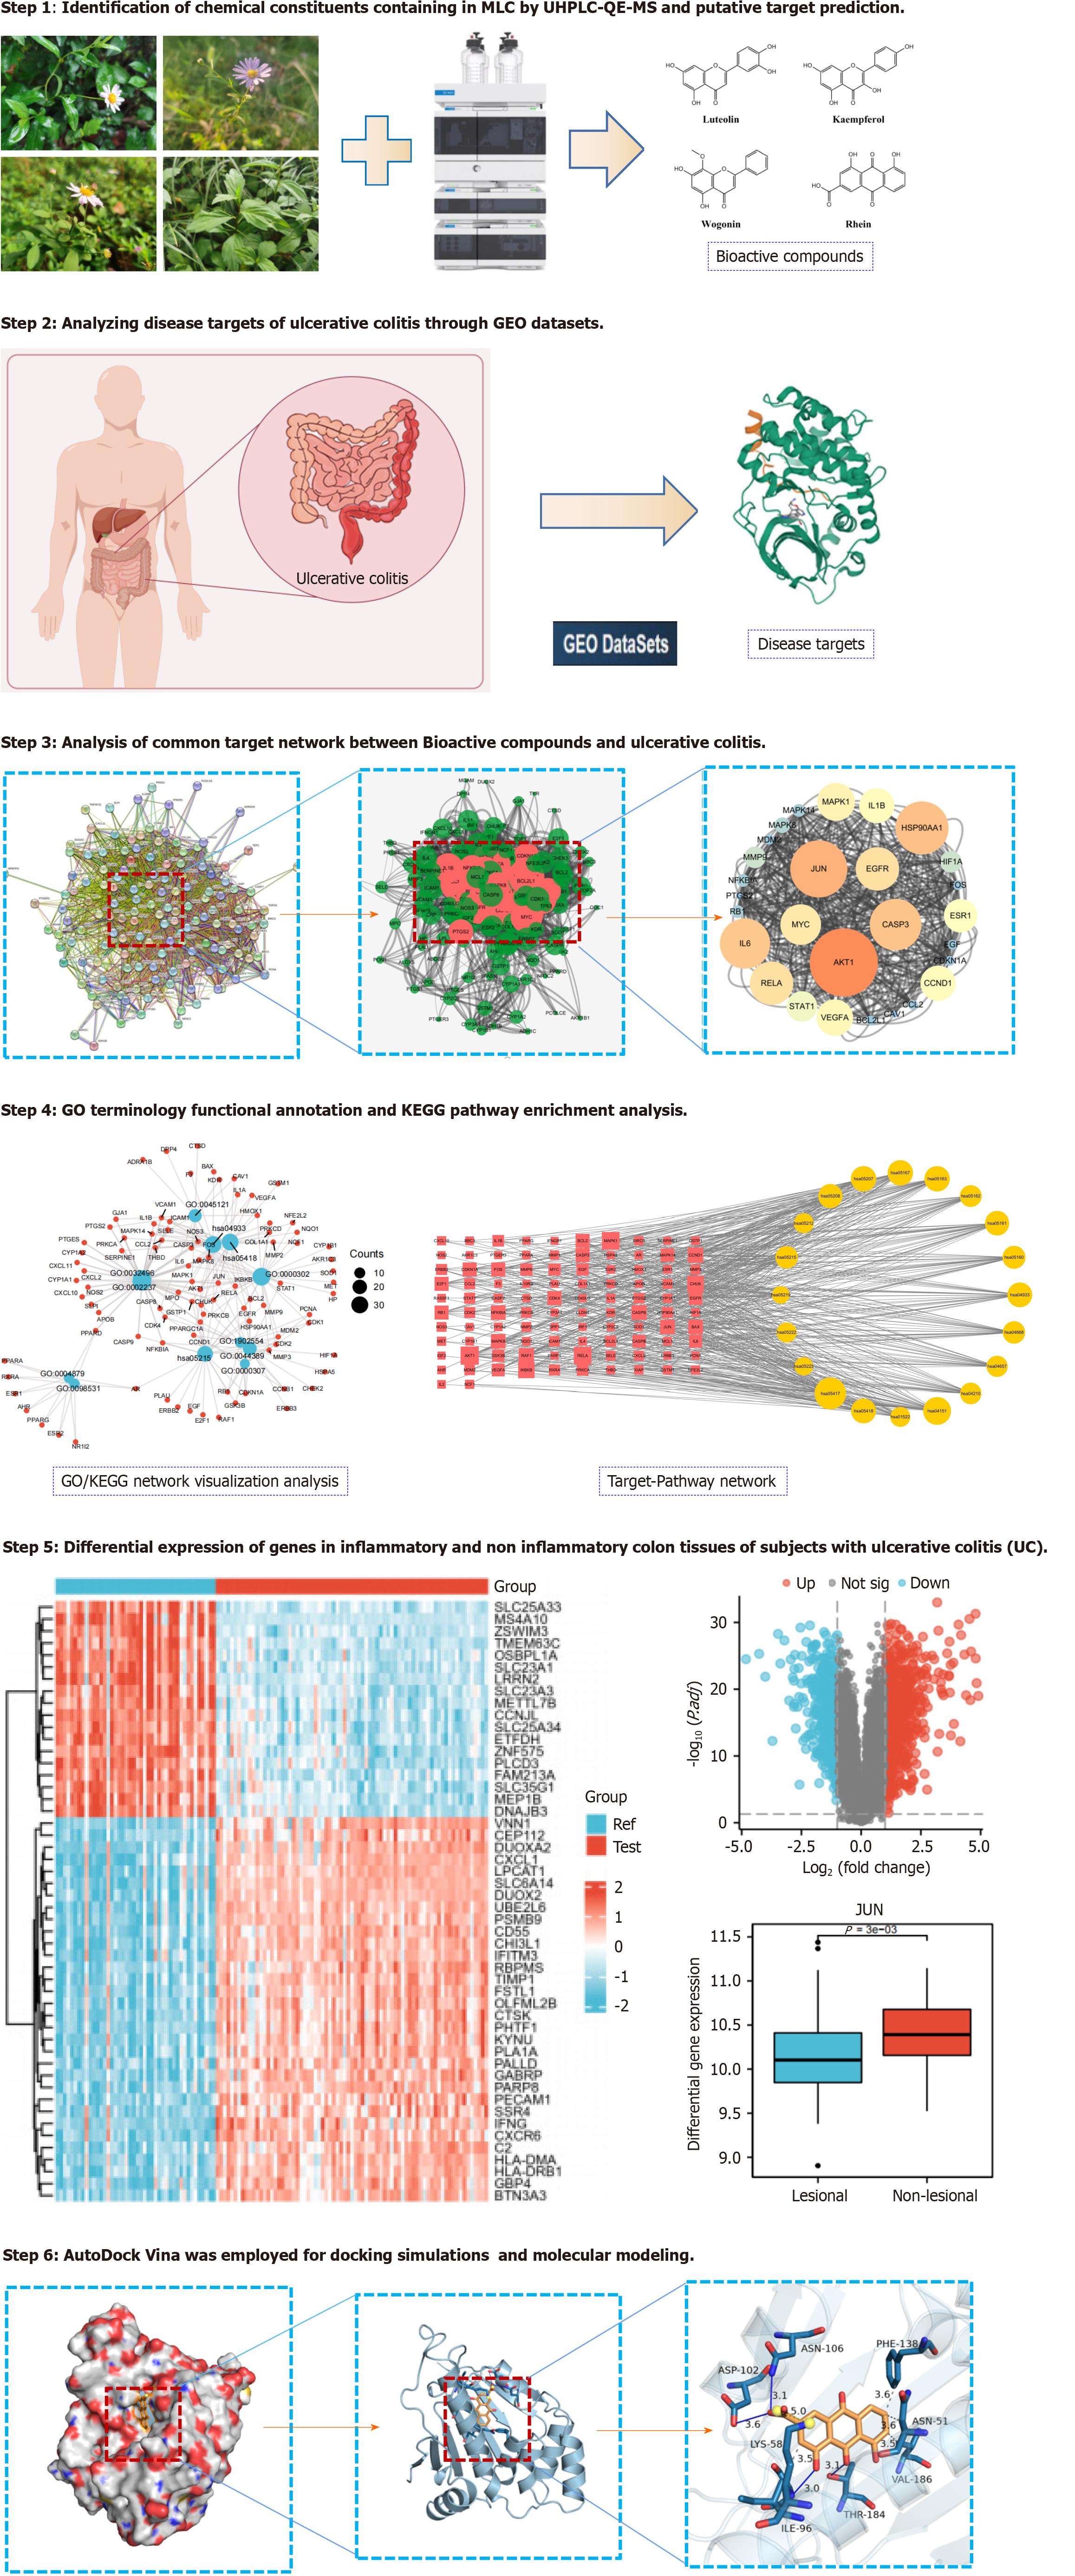
Figure 1 Technical roadmap of malancao in treating ulcerative colitis.
GEO: Gene Expression Omnibus; GO: Gene Ontology; KEGG: Kyoto Encyclopedia of Genes and Genomes; UC: Ulcerative colitis; UHPLC-QE-MS: Ultra-high-performance liquid chromatography coupled with exactive mass spectrometry; MLC: Malancao.
Figure 2 Morphological characteristics of malancao.
Malancao is a variety of Kalimeris indica (L) Sch-Bip.
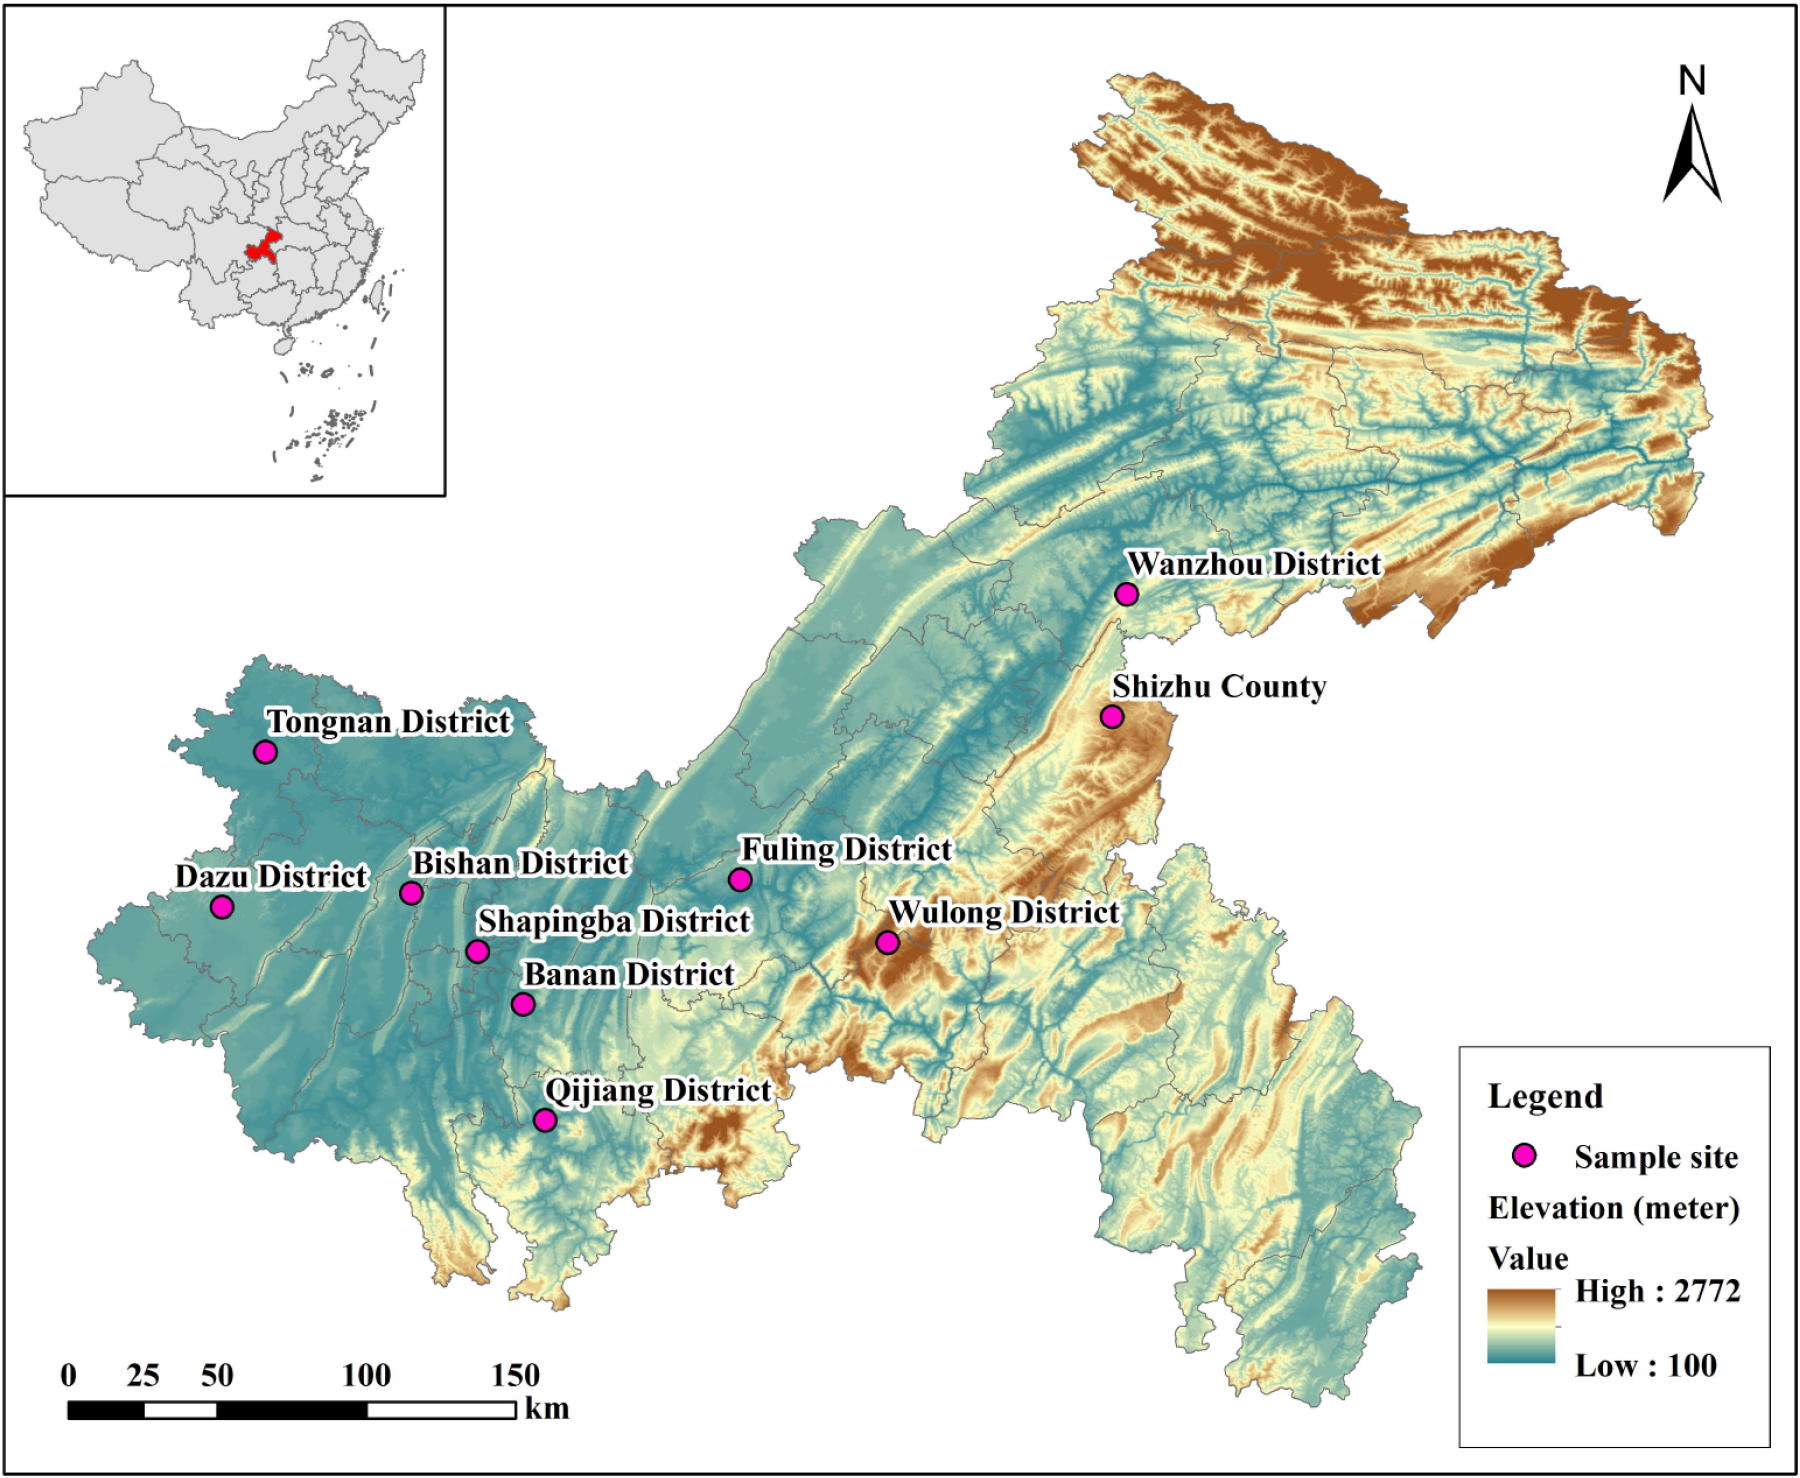
Figure 3 The distribution of ten main producing areas of malancao.
Sample site: The sampling locations are dispersed across multiple districts and counties within Chongqing, China.
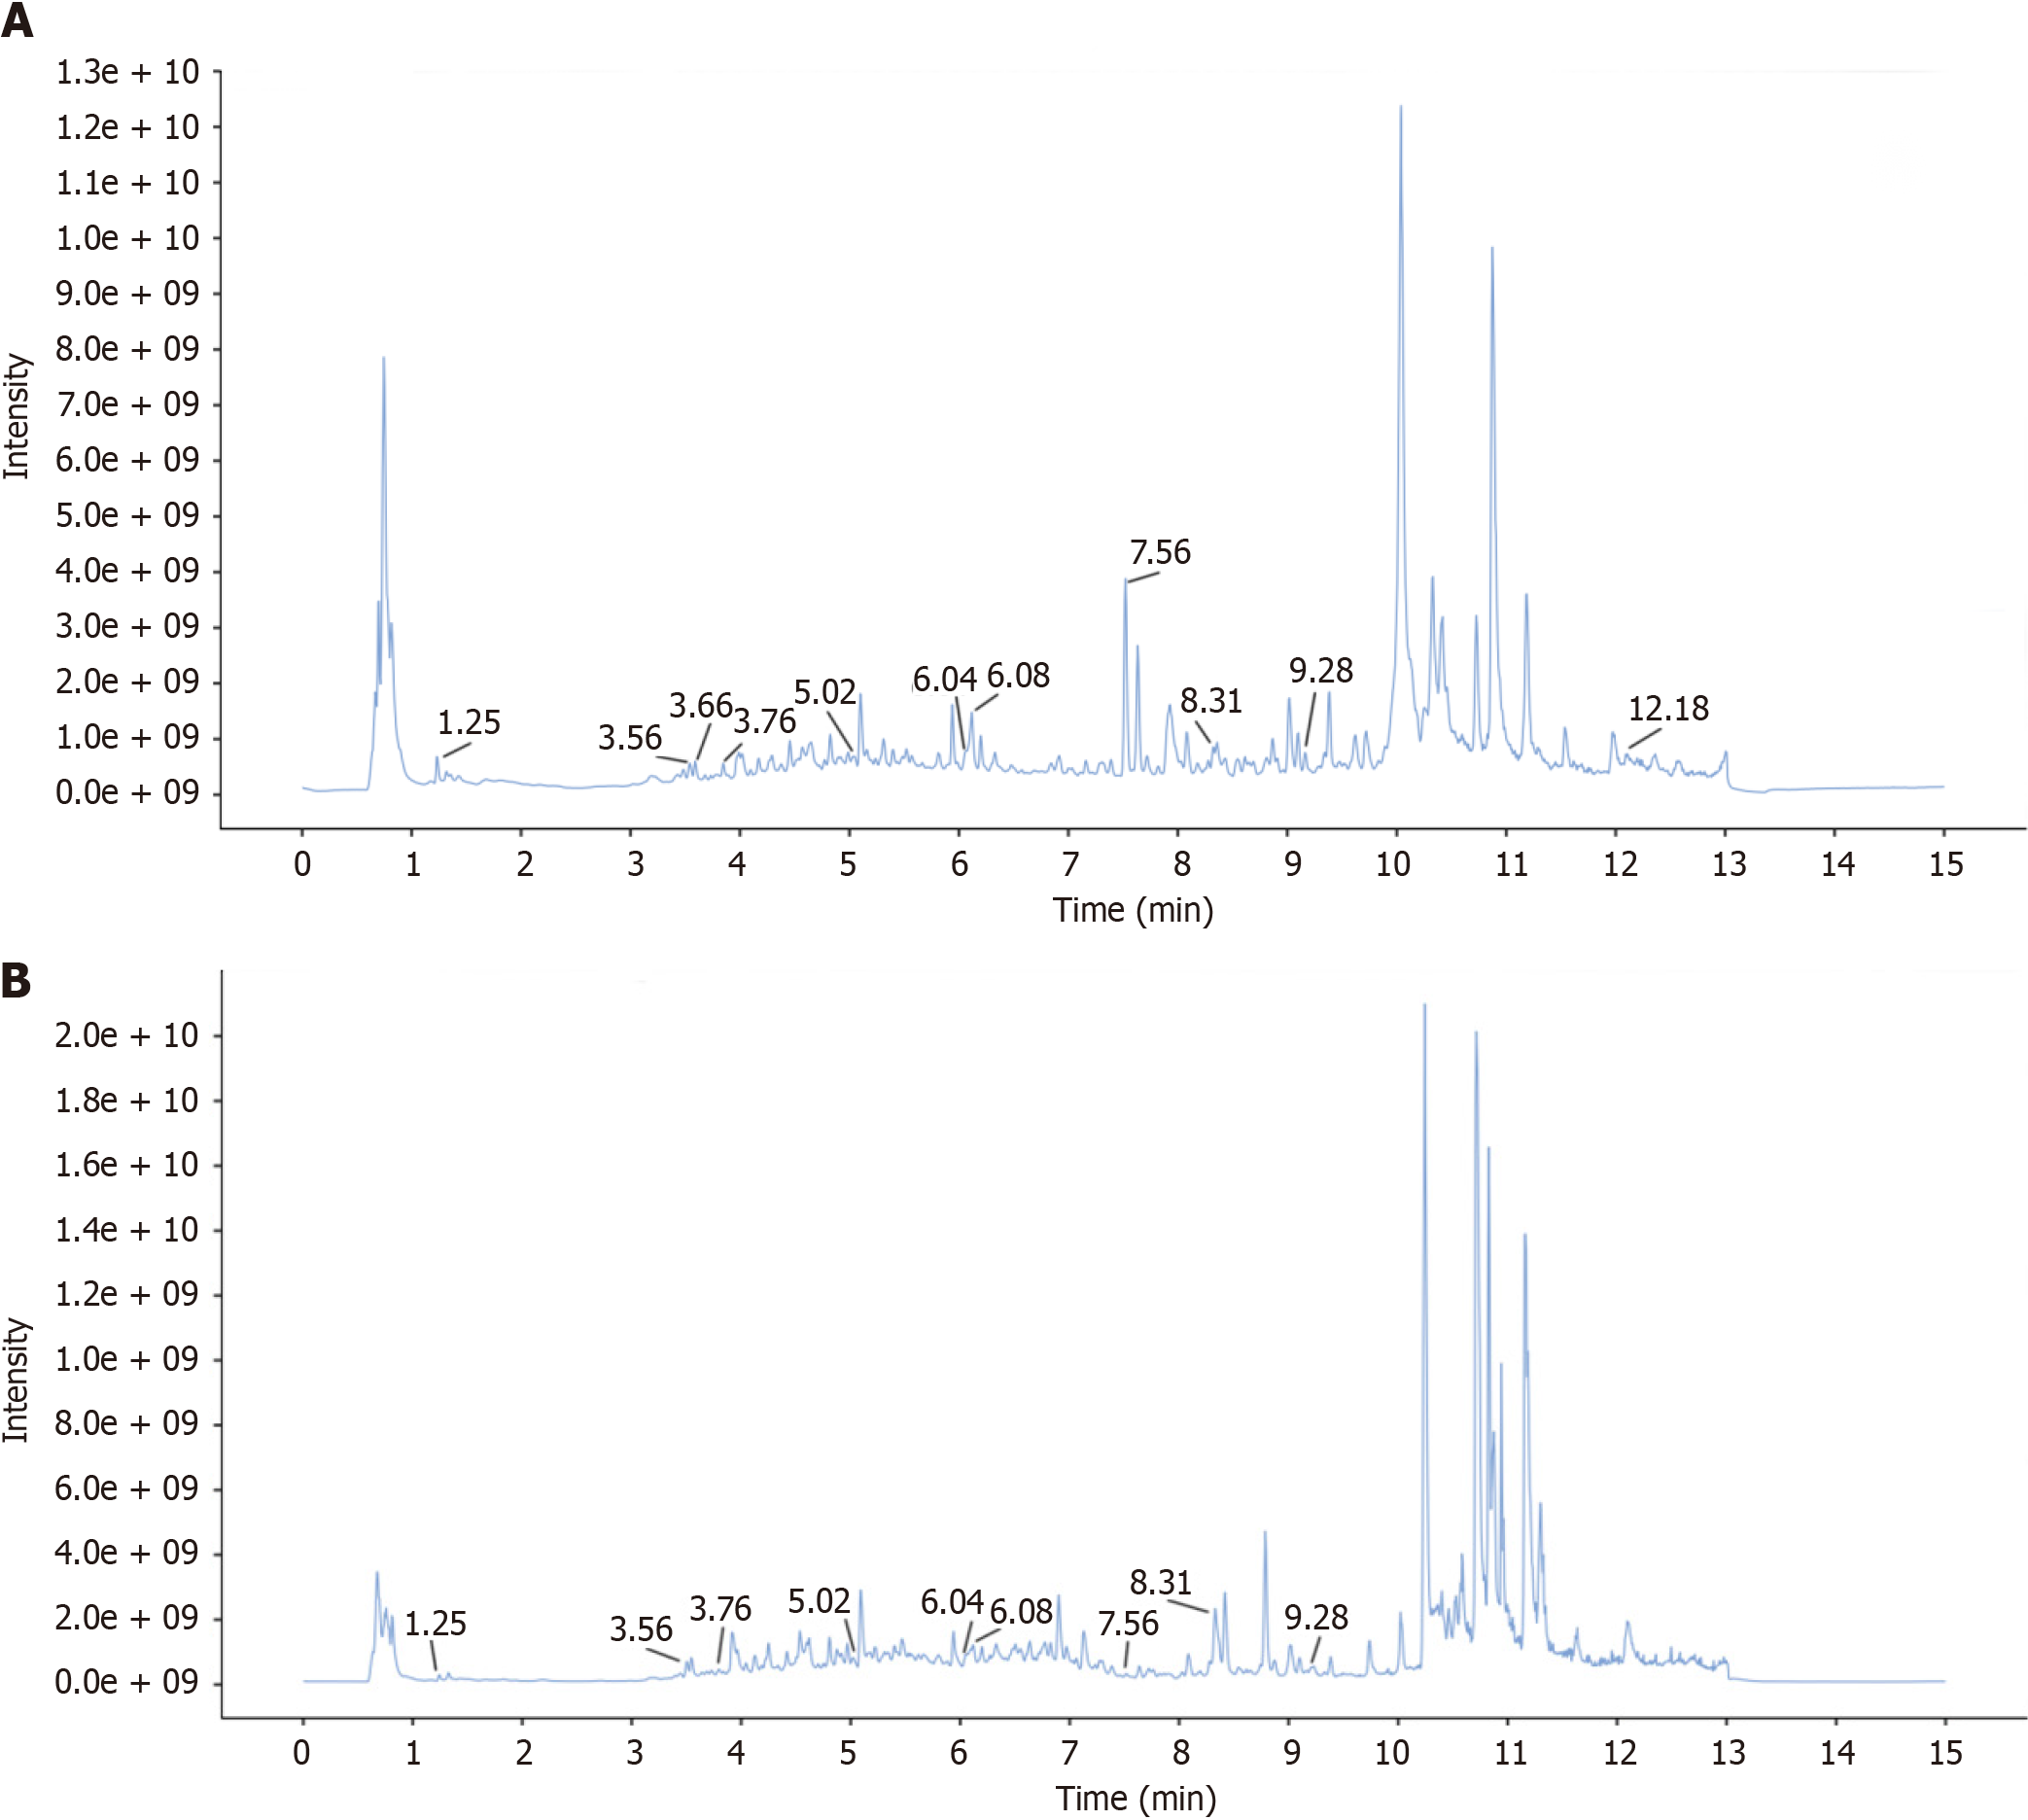
Figure 4 Total ion chromatogram plot of positive and negative ion modes of malancao detected by ultra-high-performance liquid chromatography coupled with exactive mass spectrometry.
A: Positive ion mode mass spectrometry; B: Negative ion mode mass spectrometry.
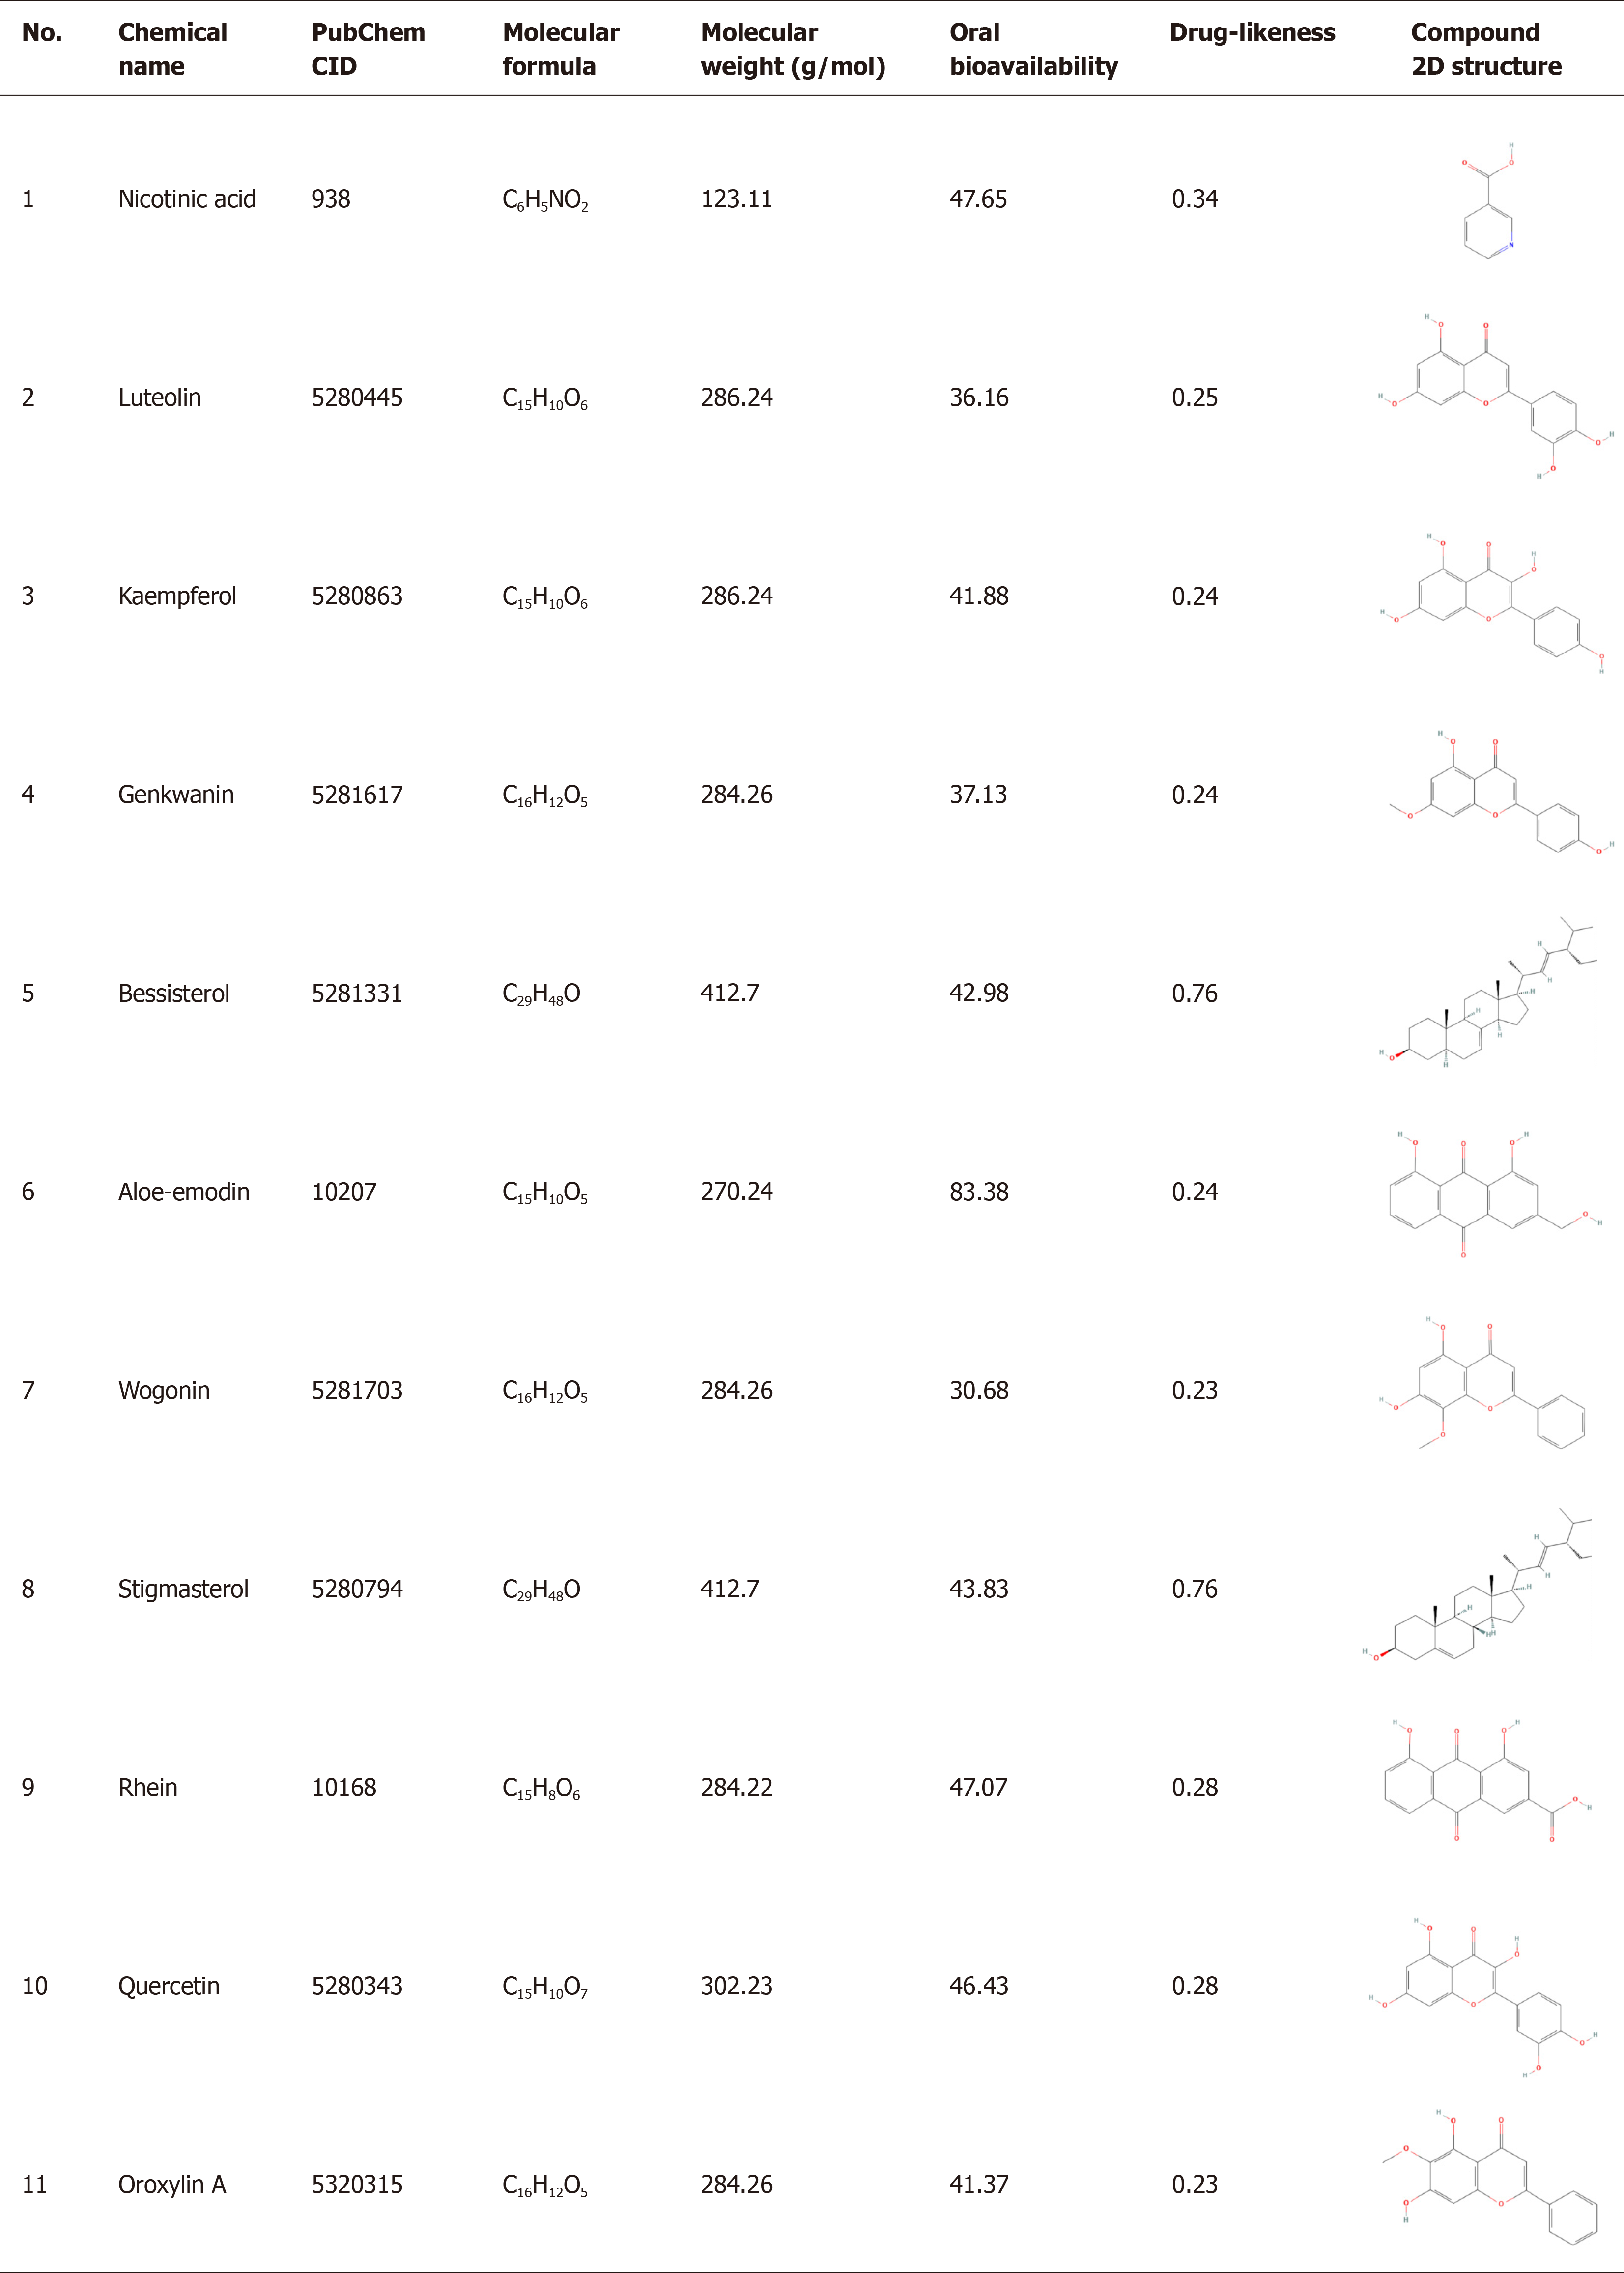
Figure 5 Bioactive Compouds of malancao, n (%).
CID: Pubchem's compound identifier, a non-zero integer for a unique chemical structure; 2D: Two-dimensional flat structures of compounds.
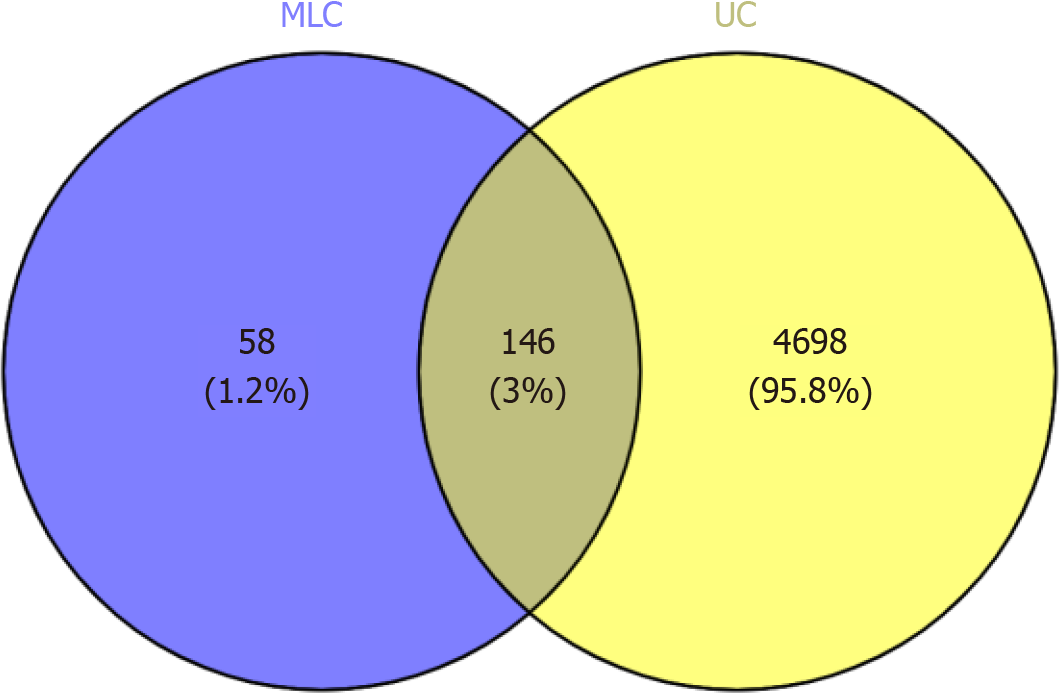
Figure 6 Venn diagram of active ingredient targets versus disease targets.
Blue area: Targets of the malancao 's action; Yellow area: Protein targets of ulcerative colitis. MLC: Malancao; UC: Ulcerative colitis.
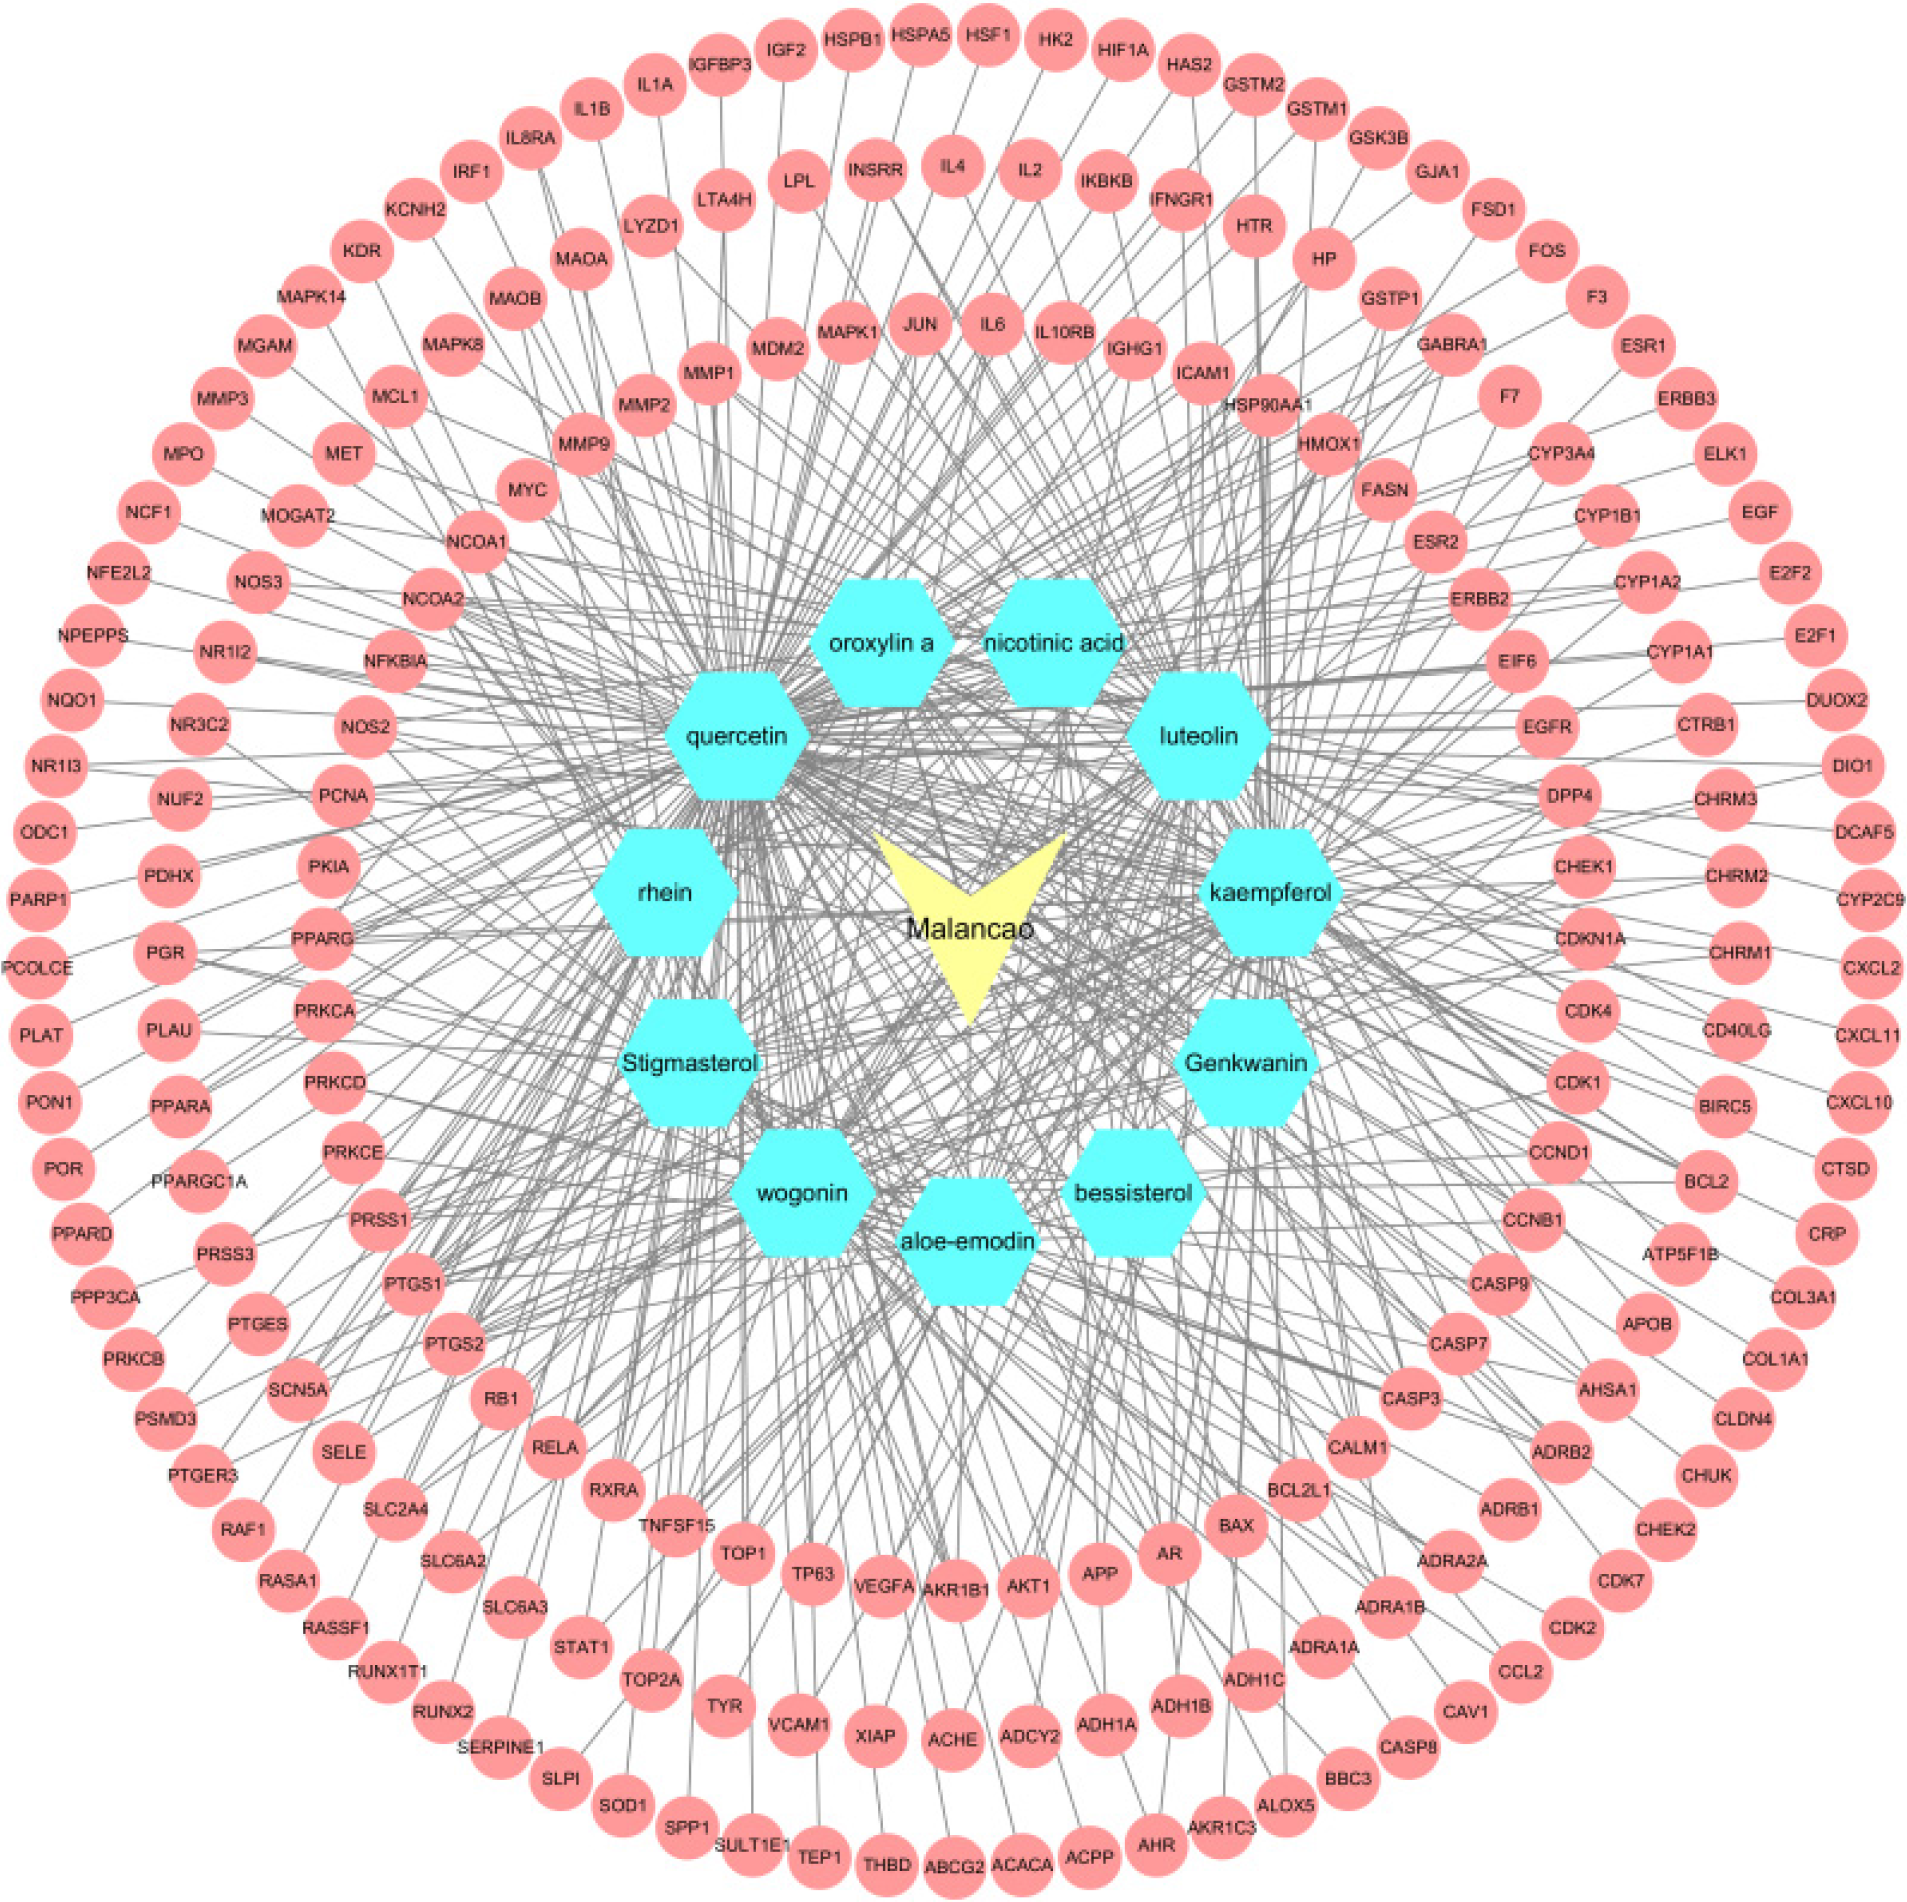
Figure 7 Drug-compound-target network of malancao against ulcerative colitis.
Yellow nodes: Drug; Blue nodes: Compounds; Red nodes: Protein targets.
Figure 8
Protein-protein interaction network between drug-disease related targets and core targets.
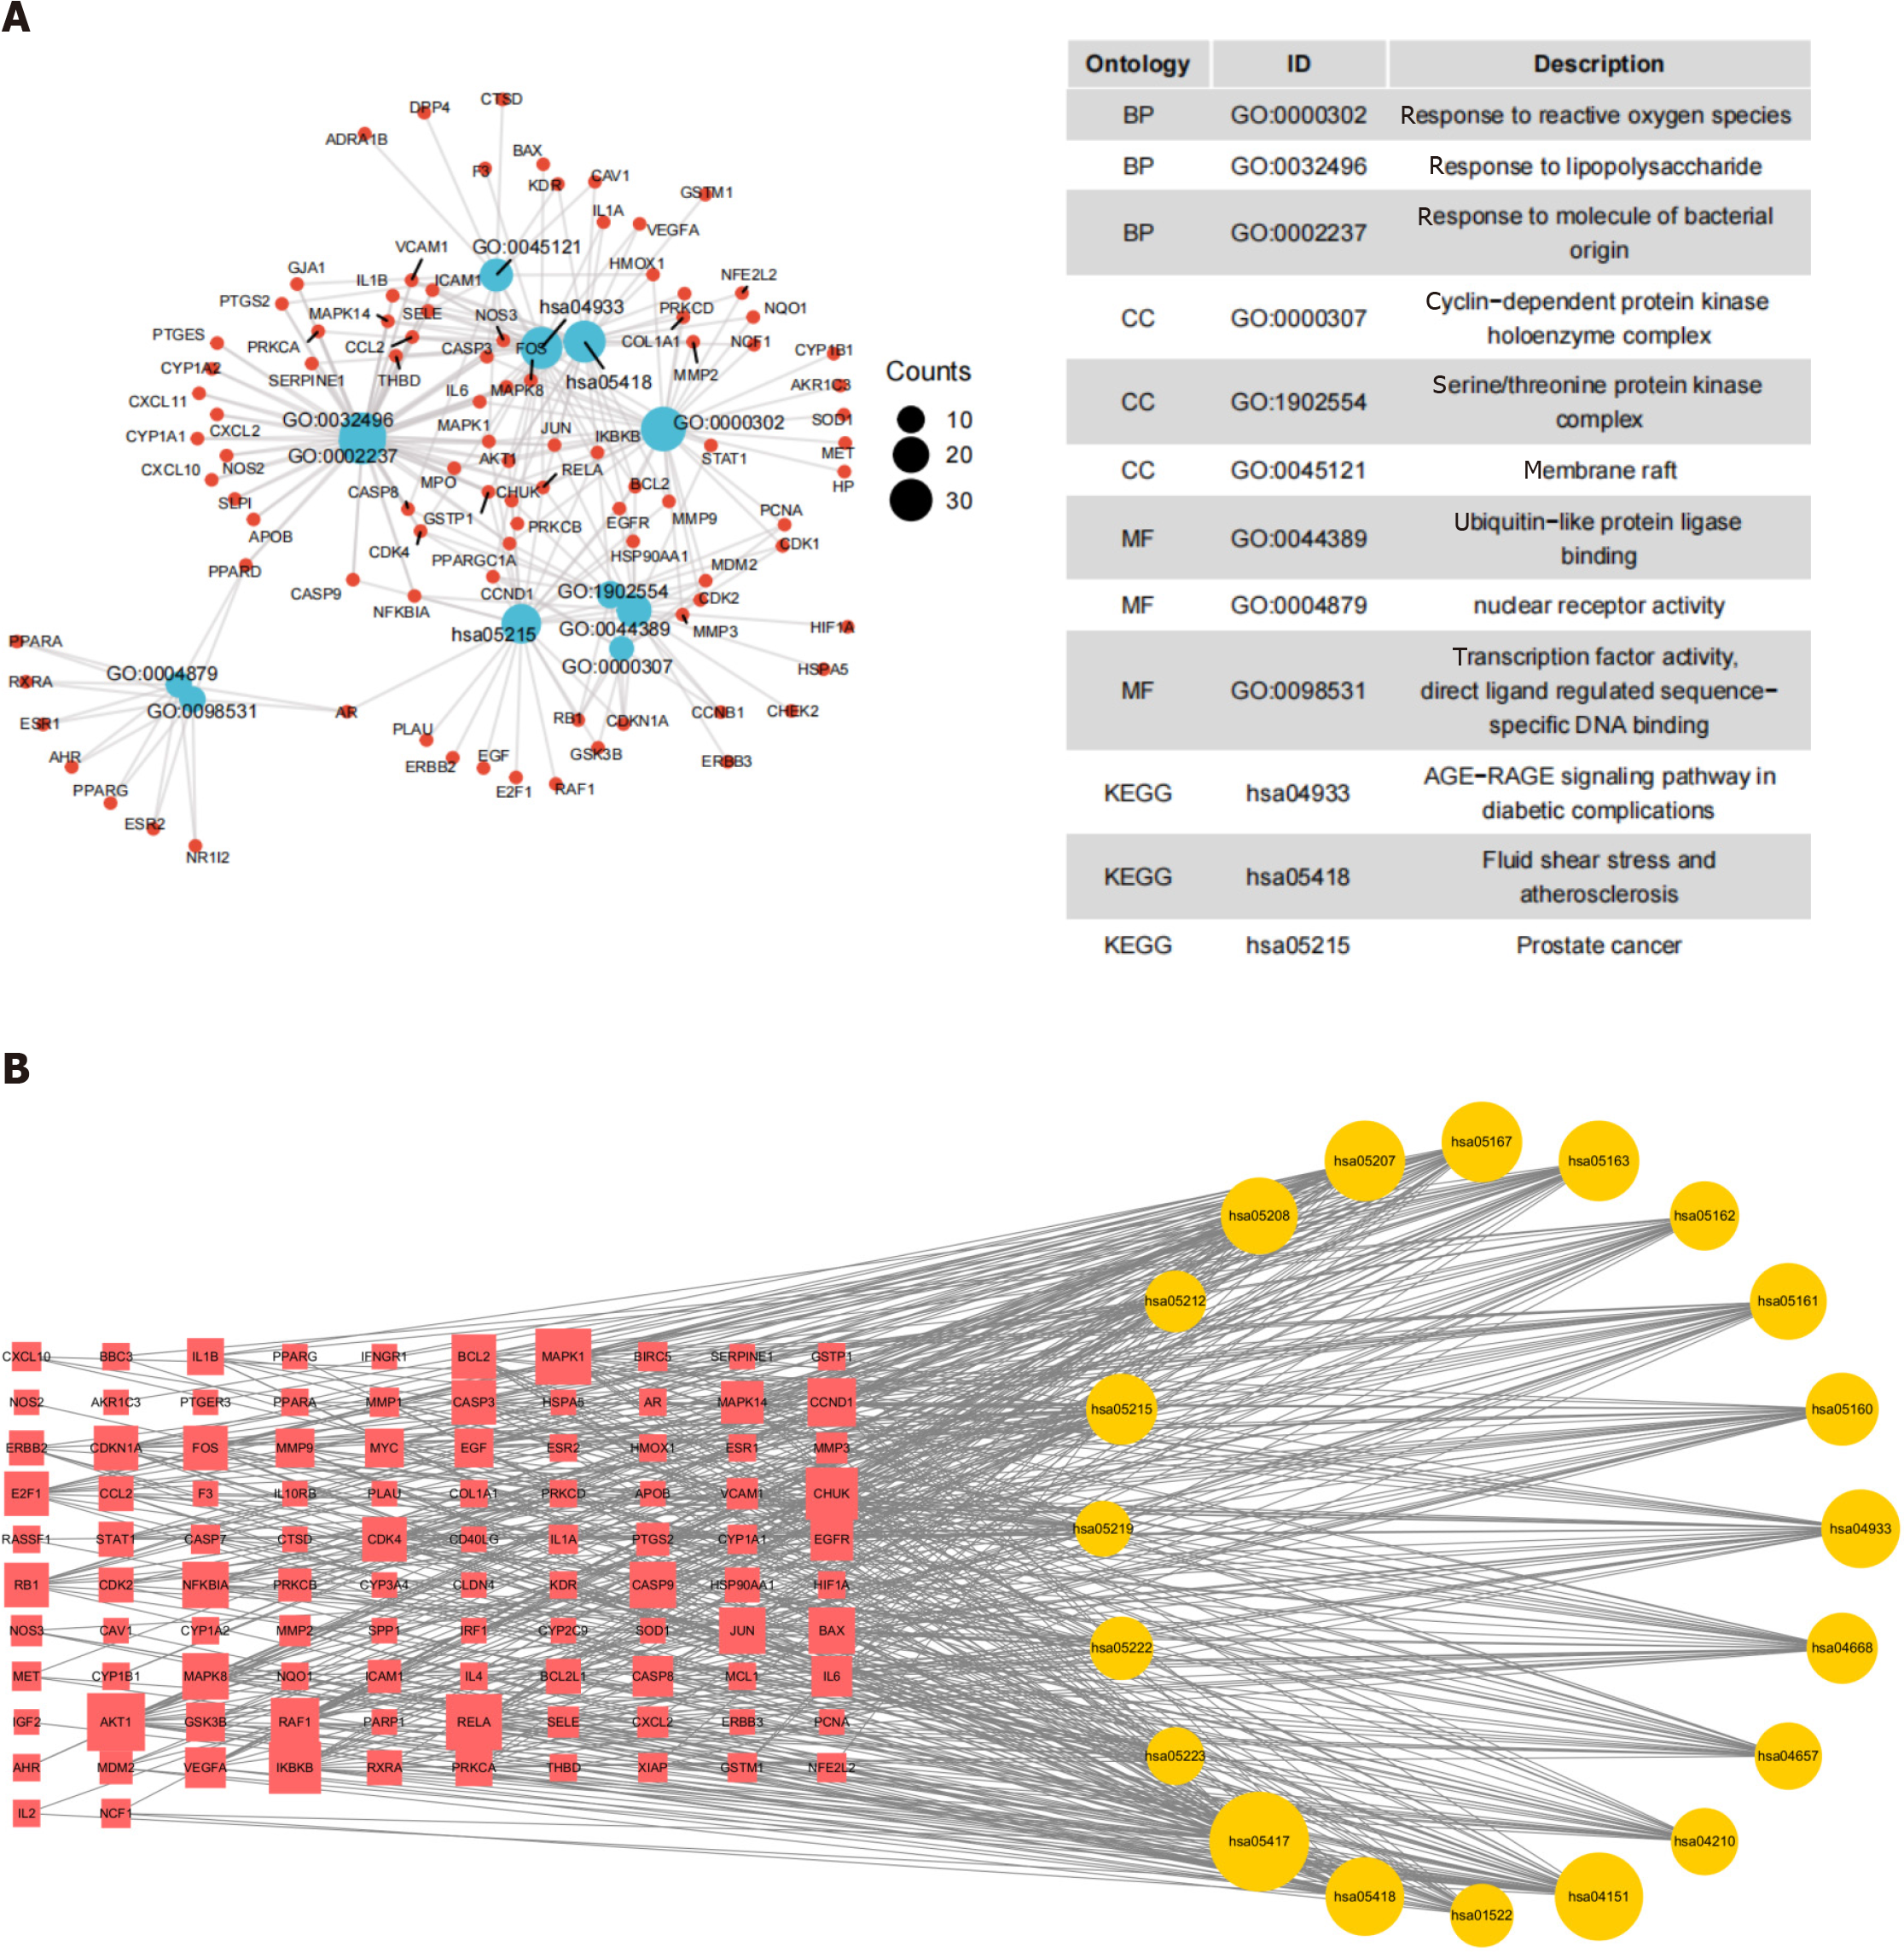
Figure 9 Visualization of Gene Ontology and Kyoto Encyclopedia of Genes and Genomes enrichment analysis.
A: Visualization of Gene Ontology classification annotation analysis; B: Visualization of Kyoto Encyclopedia of Genes and Genomes pathway enrichment analysis. A node between two lines symbolizes interaction, with larger nodes indicating stronger relationships.
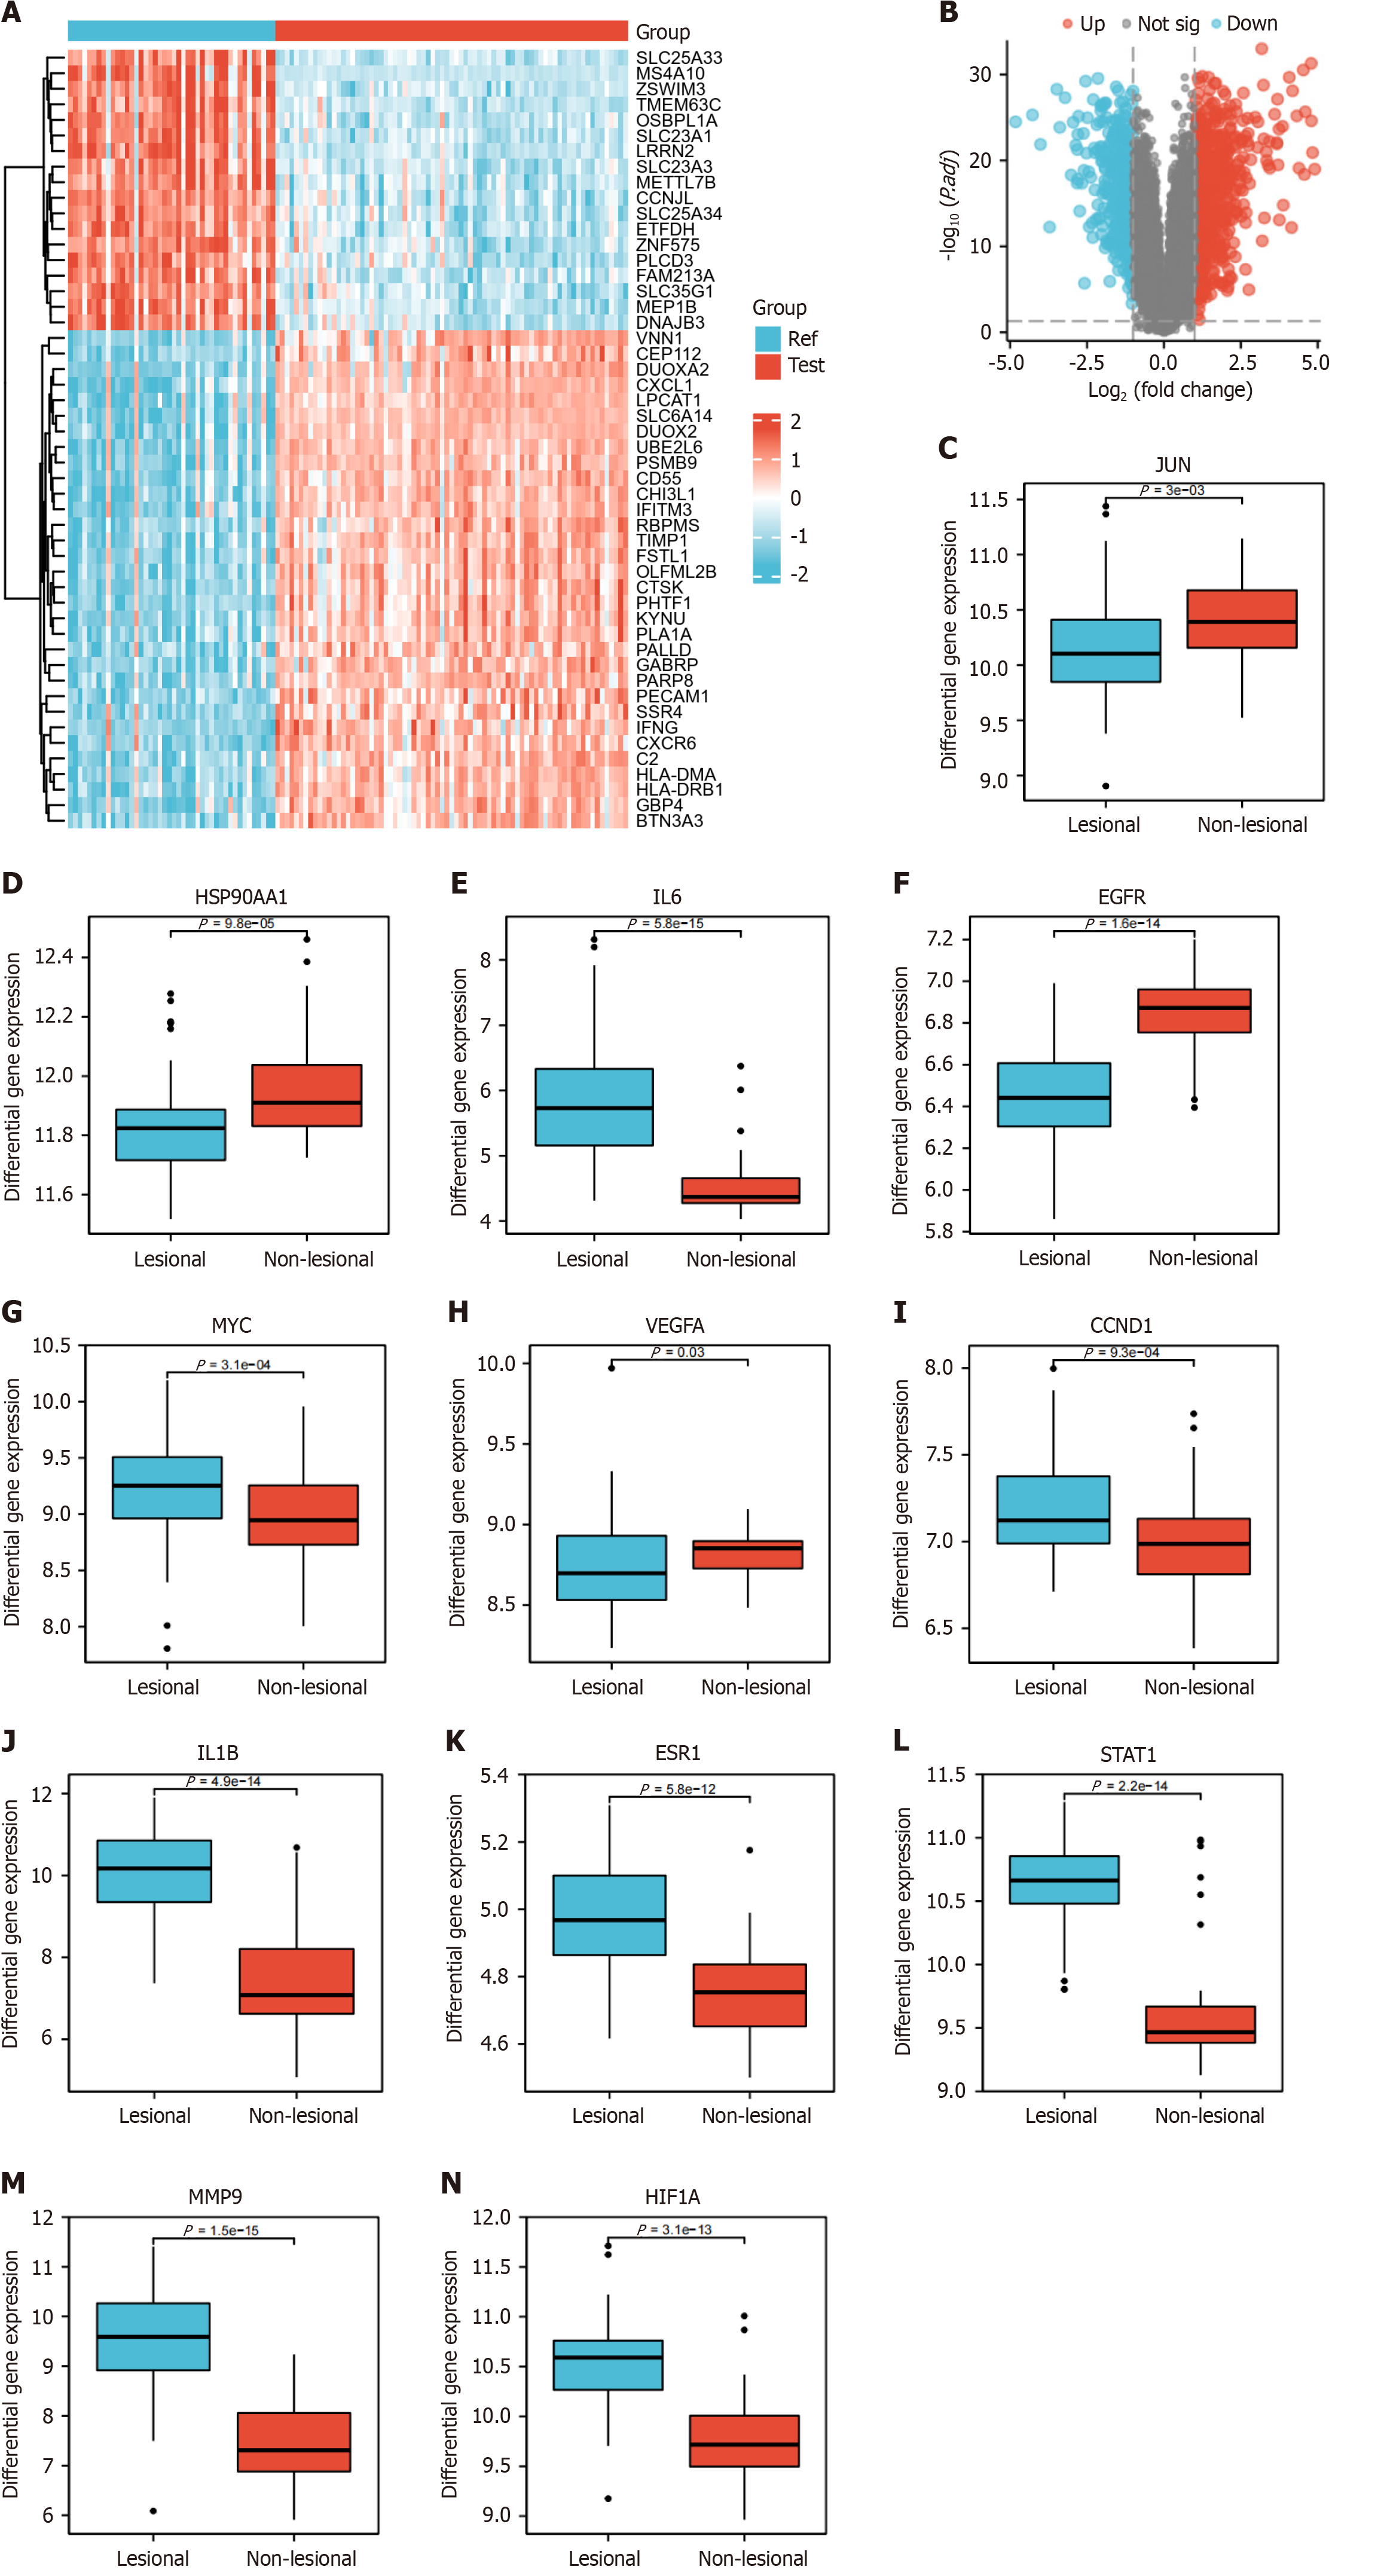
Figure 10 Disease differential analysis for ulcerative colitis in Gene Expression Omnibus database.
A: Heatmap; B: Volcano plot; C-N: Show the differential expression of degree's top 20 core target genes in inflamed and non-inflamed colonic tissues, respectively.
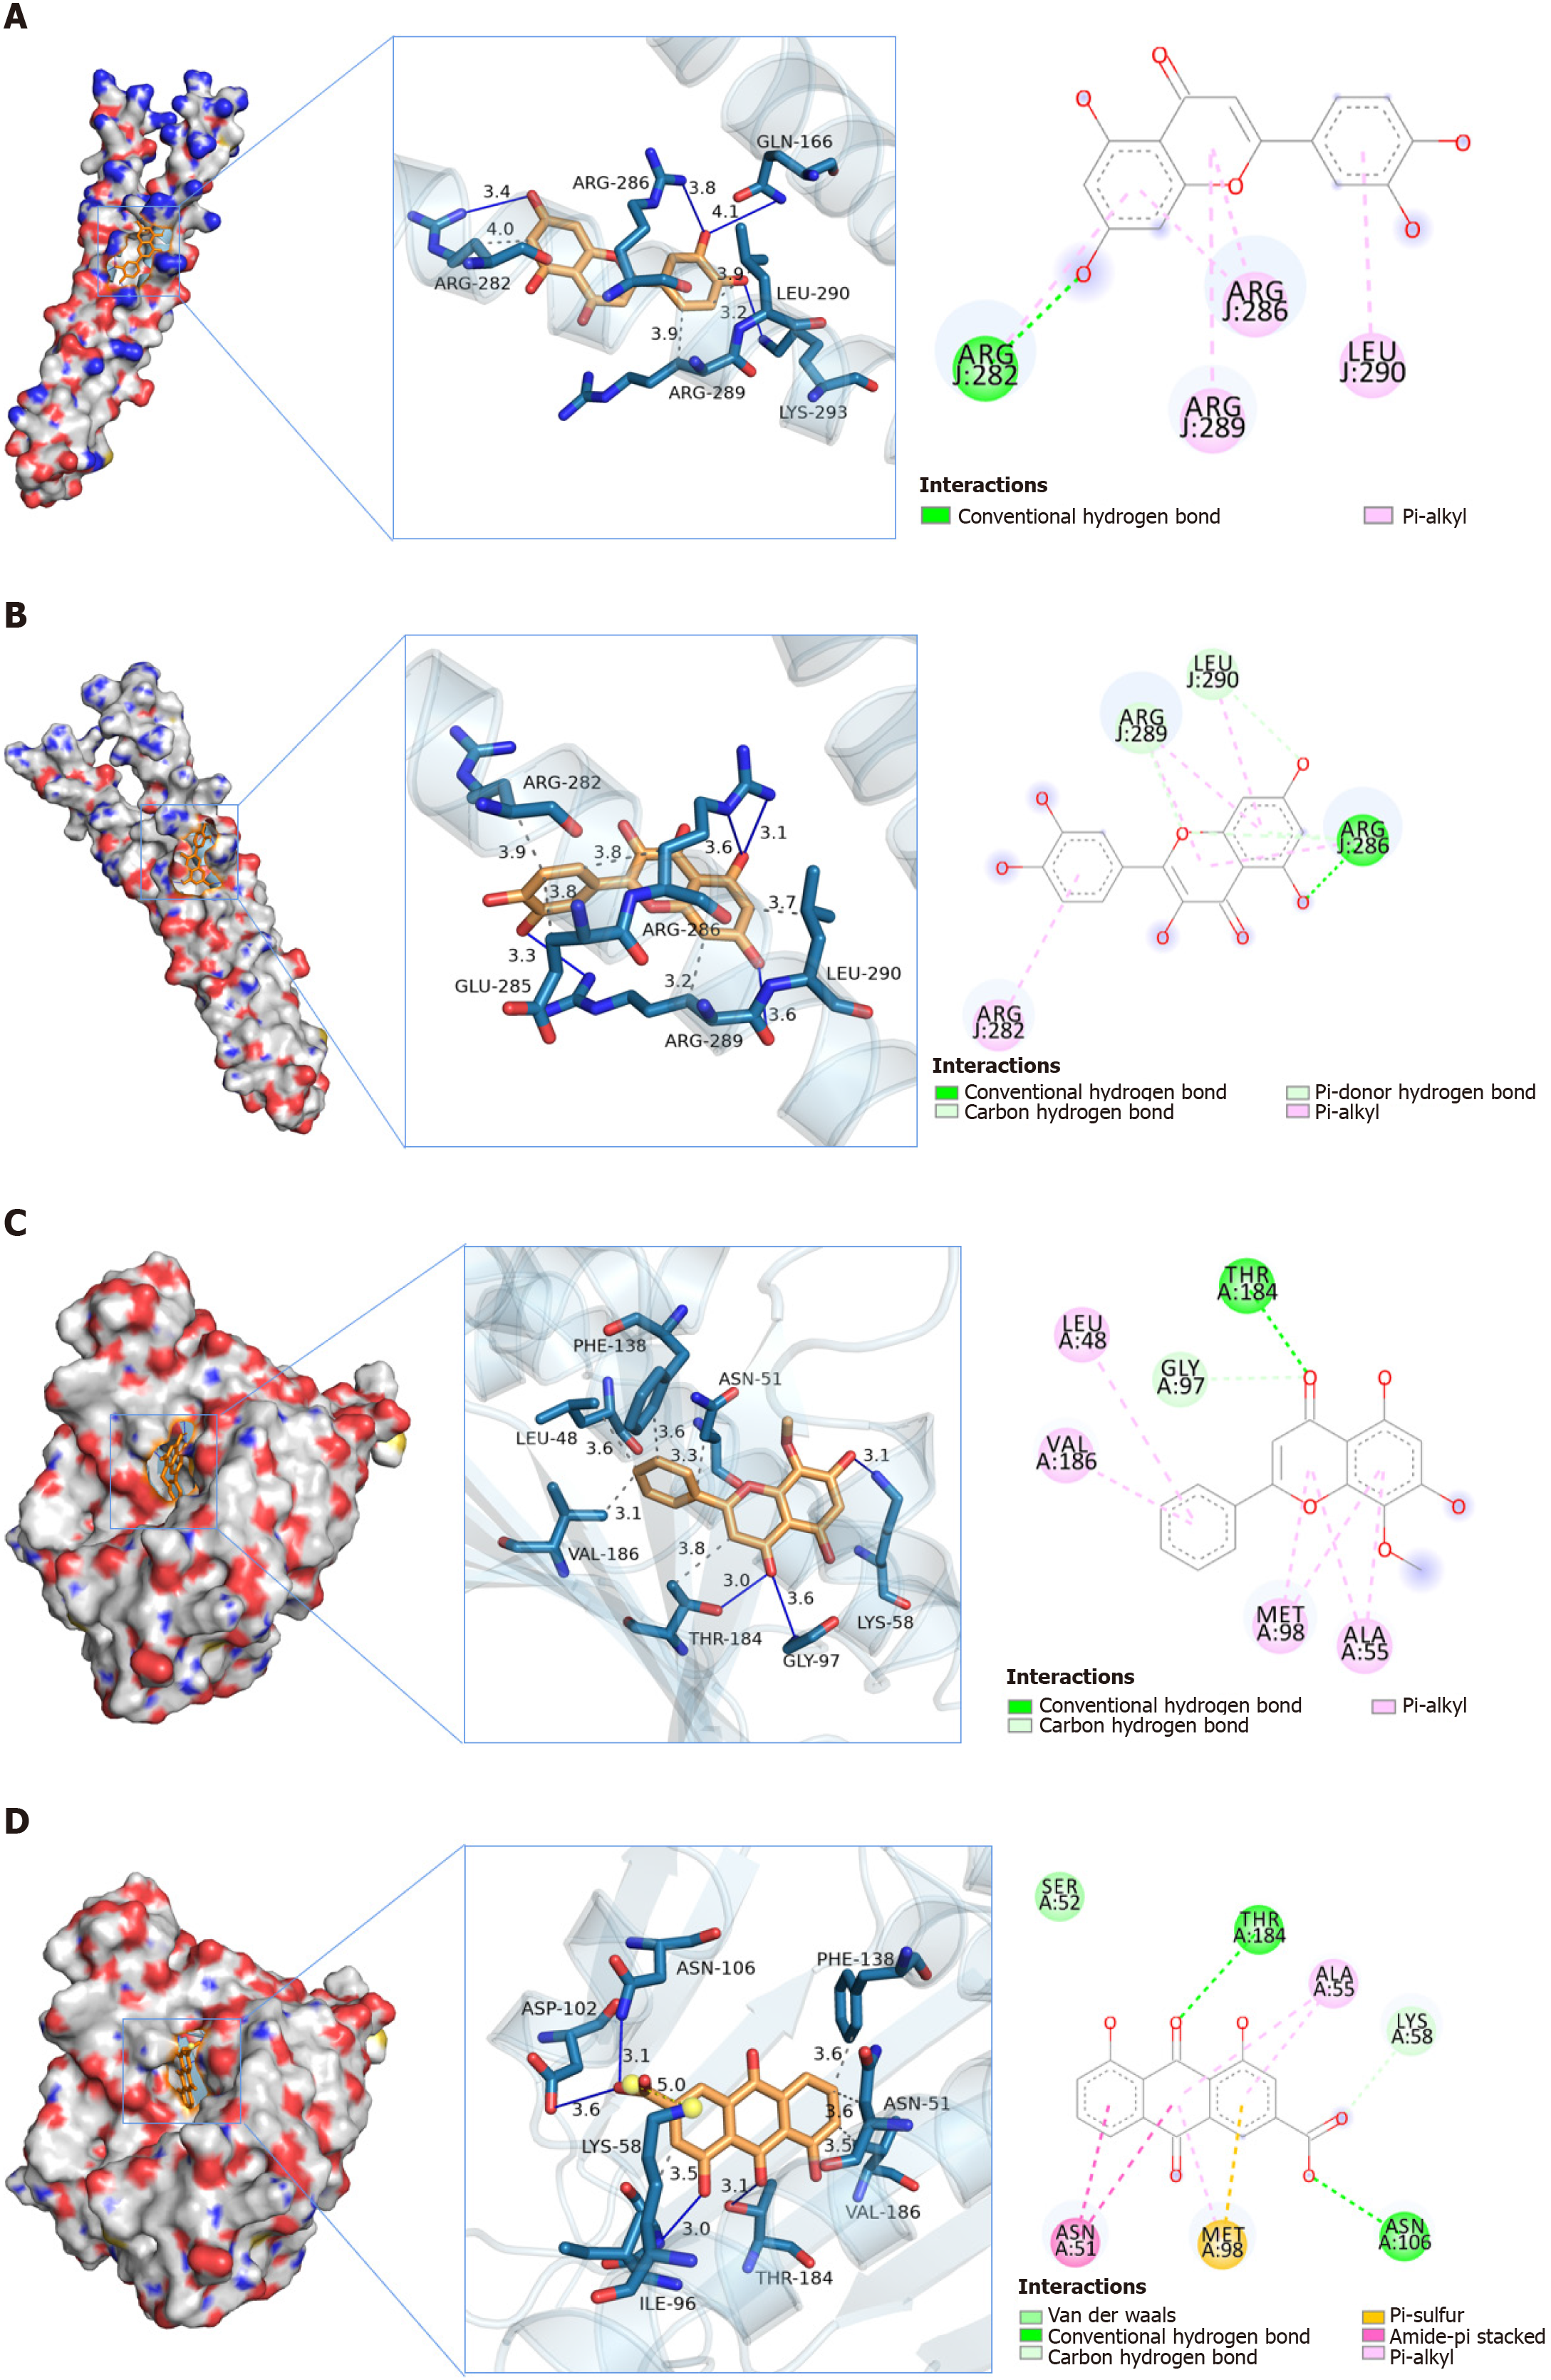
Figure 11 Molecular docking of some core targets with active ingredients.
A: Docking models for JUN-Luteolin; B: Docking models for JUN-Quercetin; C: Docking models for HSP90AA1-Wogonin; D: Docking models for HSP90AA1-Rhein.
- Citation: Huang XL, Wu LN, Huang Q, Zhou Y, Qing L, Xiong F, Dong HP, Zhou TM, Wang KL, Liu J. Unraveling the mechanism of malancao in treating ulcerative colitis: A multi-omics approach. World J Clin Cases 2024; 12(17): 3105-3122
- URL: https://www.wjgnet.com/2307-8960/full/v12/i17/3105.htm
- DOI: https://dx.doi.org/10.12998/wjcc.v12.i17.3105


