Copyright
©The Author(s) 2024.
World J Clin Cases. Jun 16, 2024; 12(17): 2995-3003
Published online Jun 16, 2024. doi: 10.12998/wjcc.v12.i17.2995
Published online Jun 16, 2024. doi: 10.12998/wjcc.v12.i17.2995
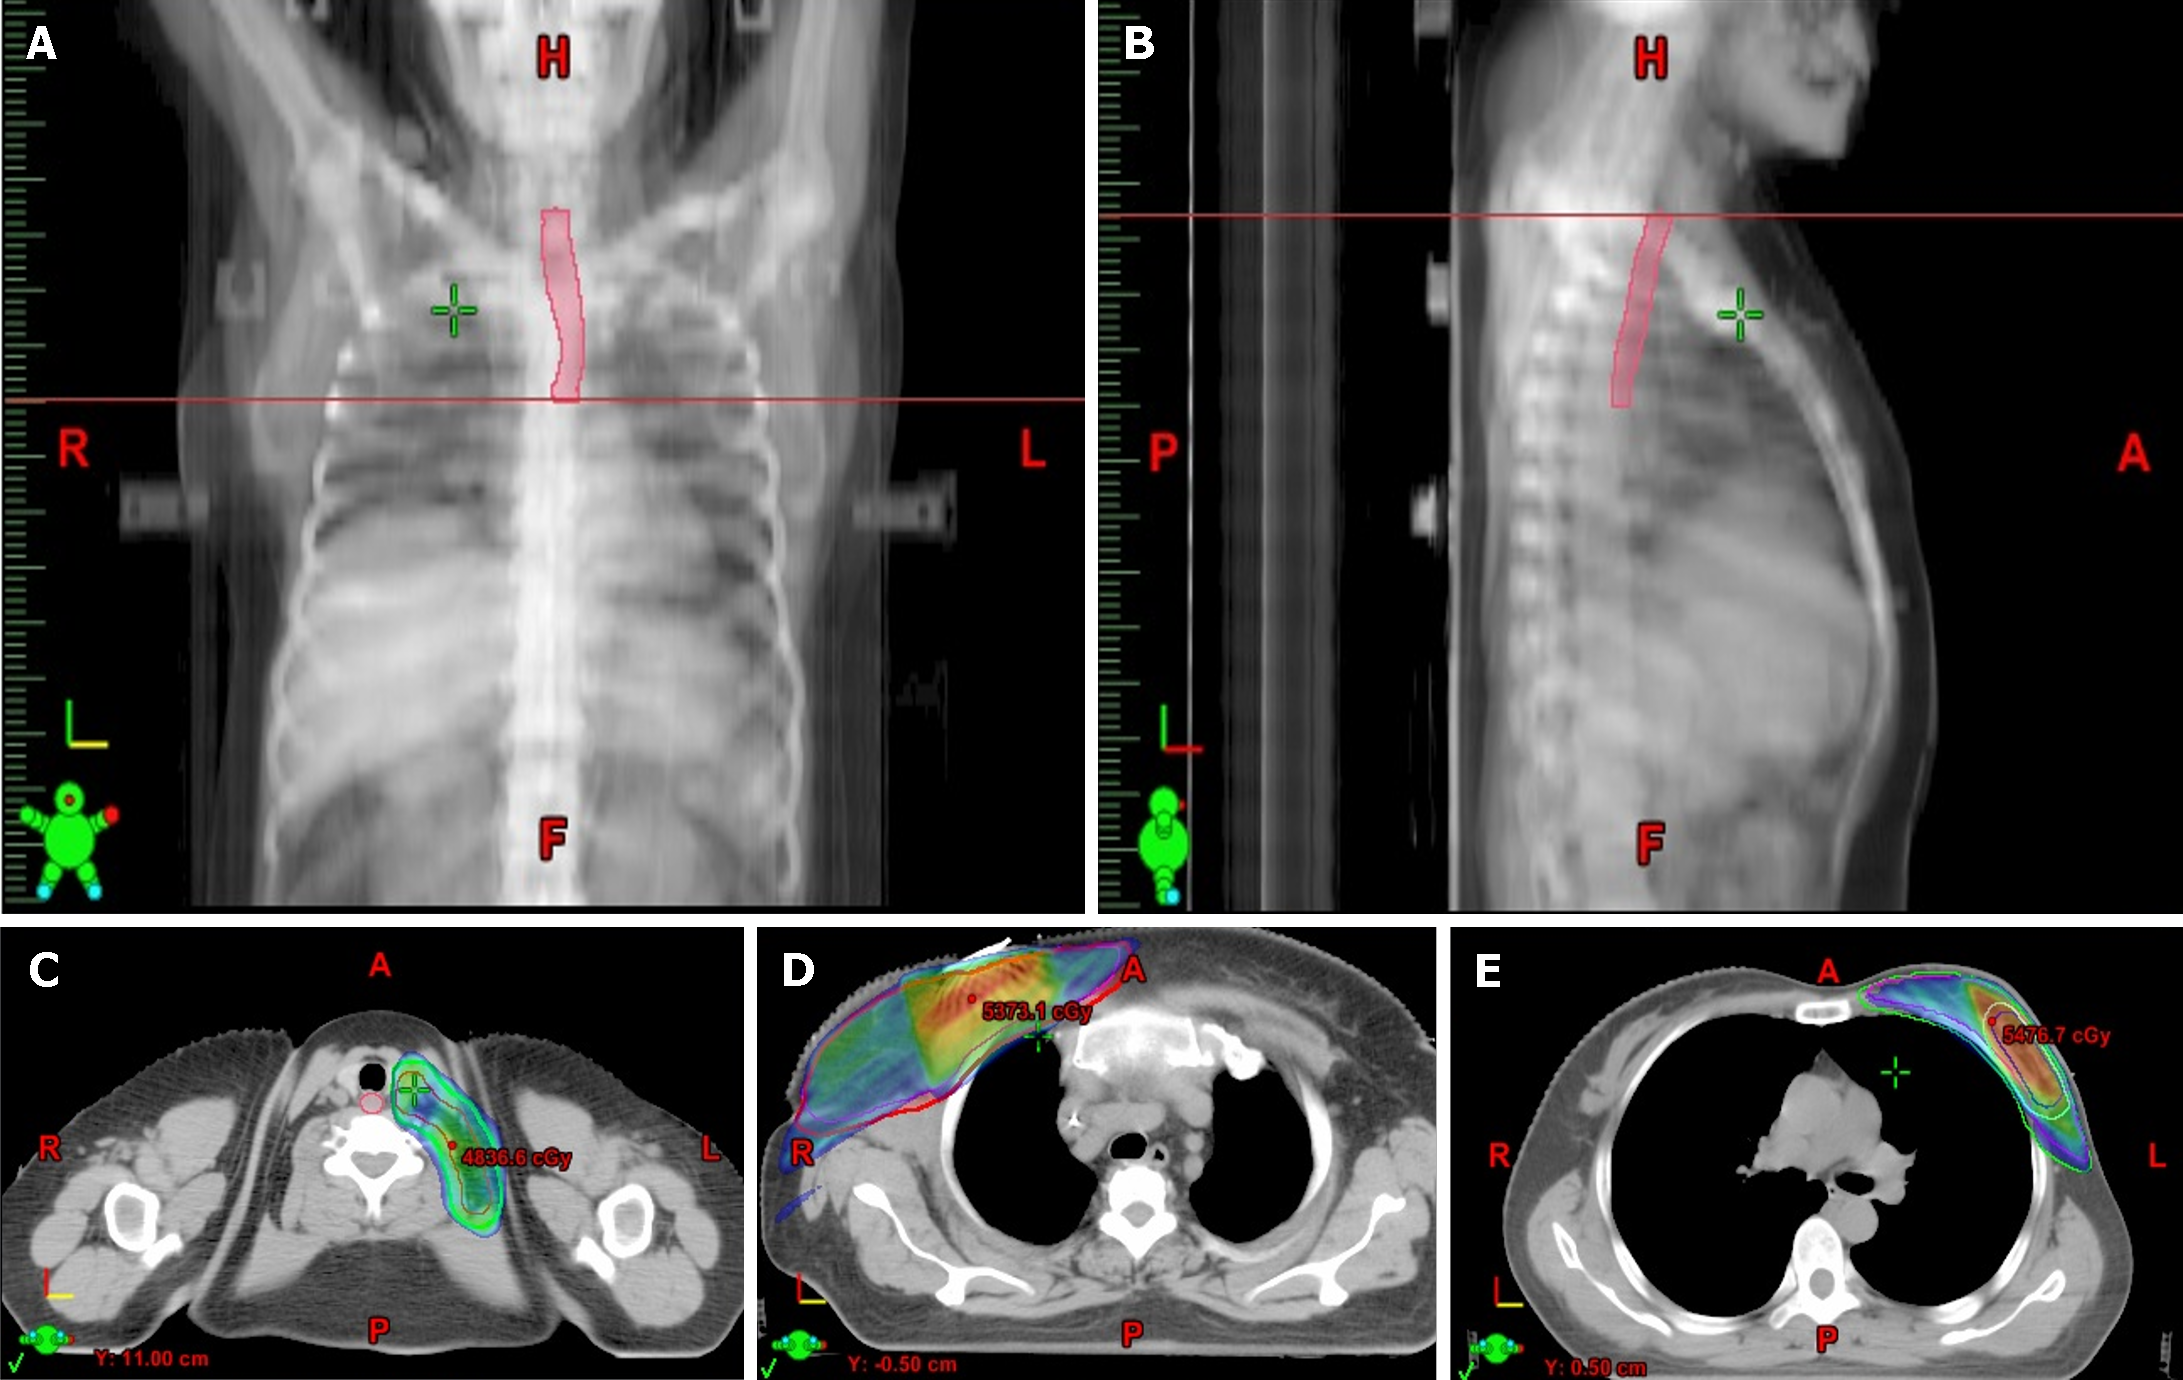
Figure 1 The esophageal area from the lower edge of the cricoid cartilage to the lower edge of the aortic arch.
A and B: The esophagus is outlined in the front and side view; C: An illustration of the supraclavicular nodal outlined and dose distribution; D: An illustration of the chest wall and axillary nodal outlined and dose distribution after mastectomy; E: An illustration of the breast/tumor bed outlined and dose distribution after breast-conserving surgery. The colors corresponding to the prescription dose from low to high are blue, green, yellow, and red.
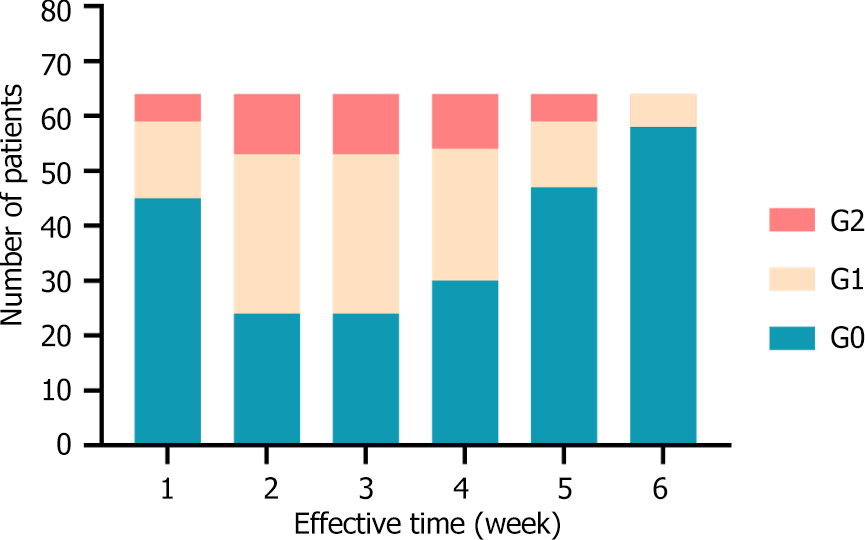
Figure 2 Proportion of patients with radiation esophagitis over time.
G0: No radiation oesophagitis; G1: Grade 1 radiation oesophagitis; G2: Grade 2 radiation oesophagitis.
- Citation: Ji MC, Li ZJ, Li K, Wang YX, Yang B, Lv LL, Su Y, Zhang ZW, Huo ZC, Qi Q, Lu YC, Cui ZQ, Liu YB. Dosimetric risk factors for radiation esophagitis in patients with breast cancer following regional nodal radiation. World J Clin Cases 2024; 12(17): 2995-3003
- URL: https://www.wjgnet.com/2307-8960/full/v12/i17/2995.htm
- DOI: https://dx.doi.org/10.12998/wjcc.v12.i17.2995


