Copyright
©The Author(s) 2024.
World J Clin Cases. Jun 6, 2024; 12(16): 2894-2903
Published online Jun 6, 2024. doi: 10.12998/wjcc.v12.i16.2894
Published online Jun 6, 2024. doi: 10.12998/wjcc.v12.i16.2894
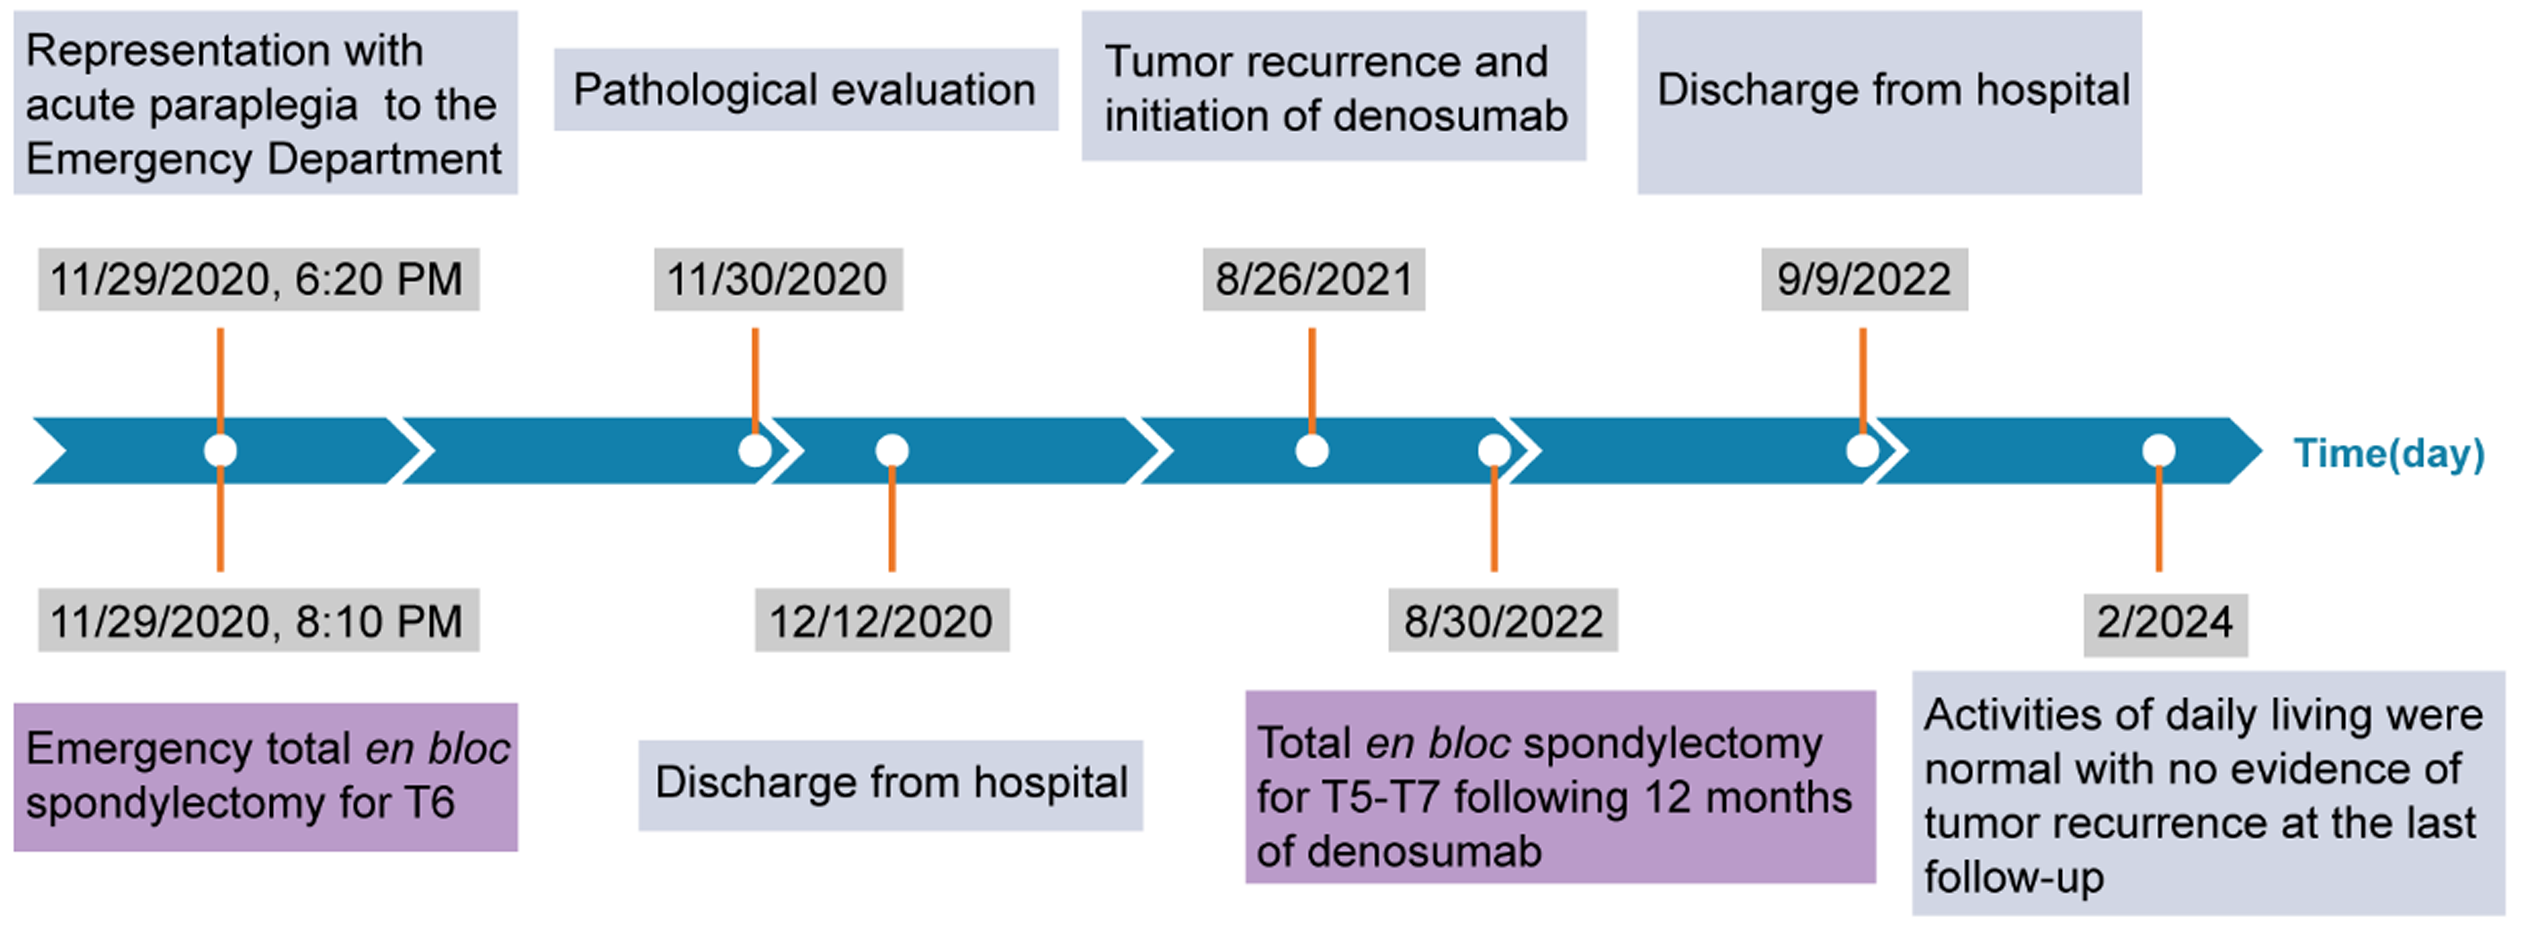
Figure 1 Timeline of the occurrence of major clinical events during the treatment and follow-up.
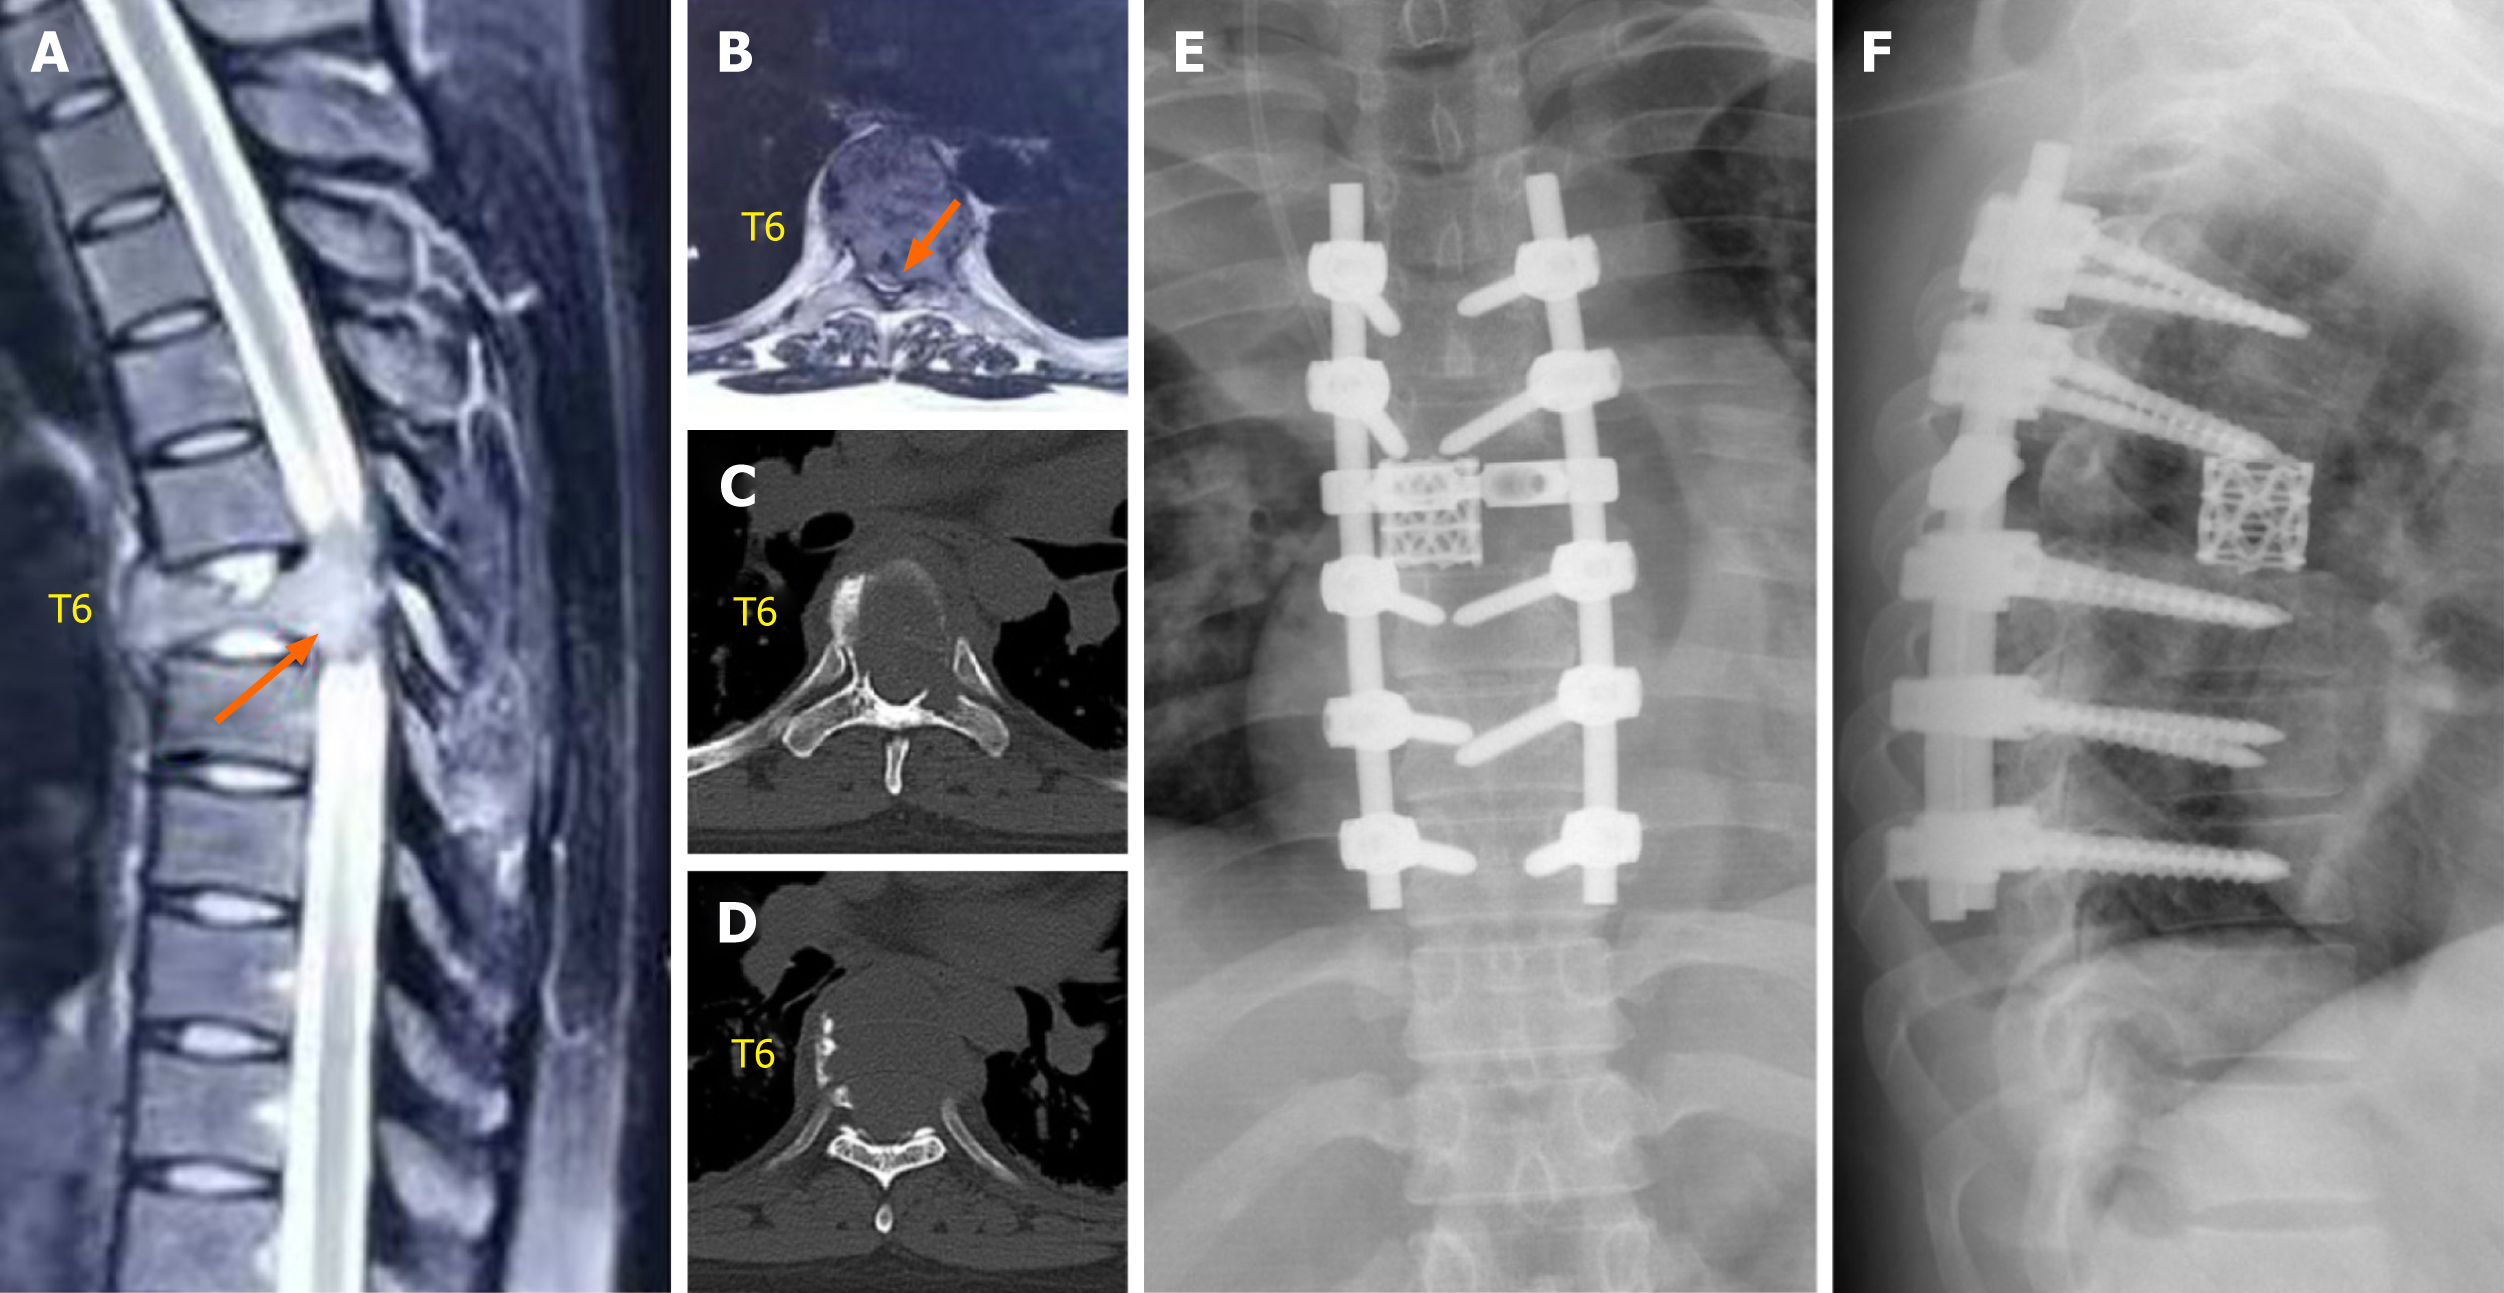
Figure 2 Preoperative and postoperative imaging of the first emergency total enbloc spondylectomy.
A and B: Magnetic resonance imaging before the first emergency total en bloc spondylectomy (arrow, tumor); C and D: Computed tomography before the first emergency total en bloc spondylectomy; E and F: Anteroposterior and lateral radiographs showing a good implant position at 1 wk after the first total en bloc spondylectomy.
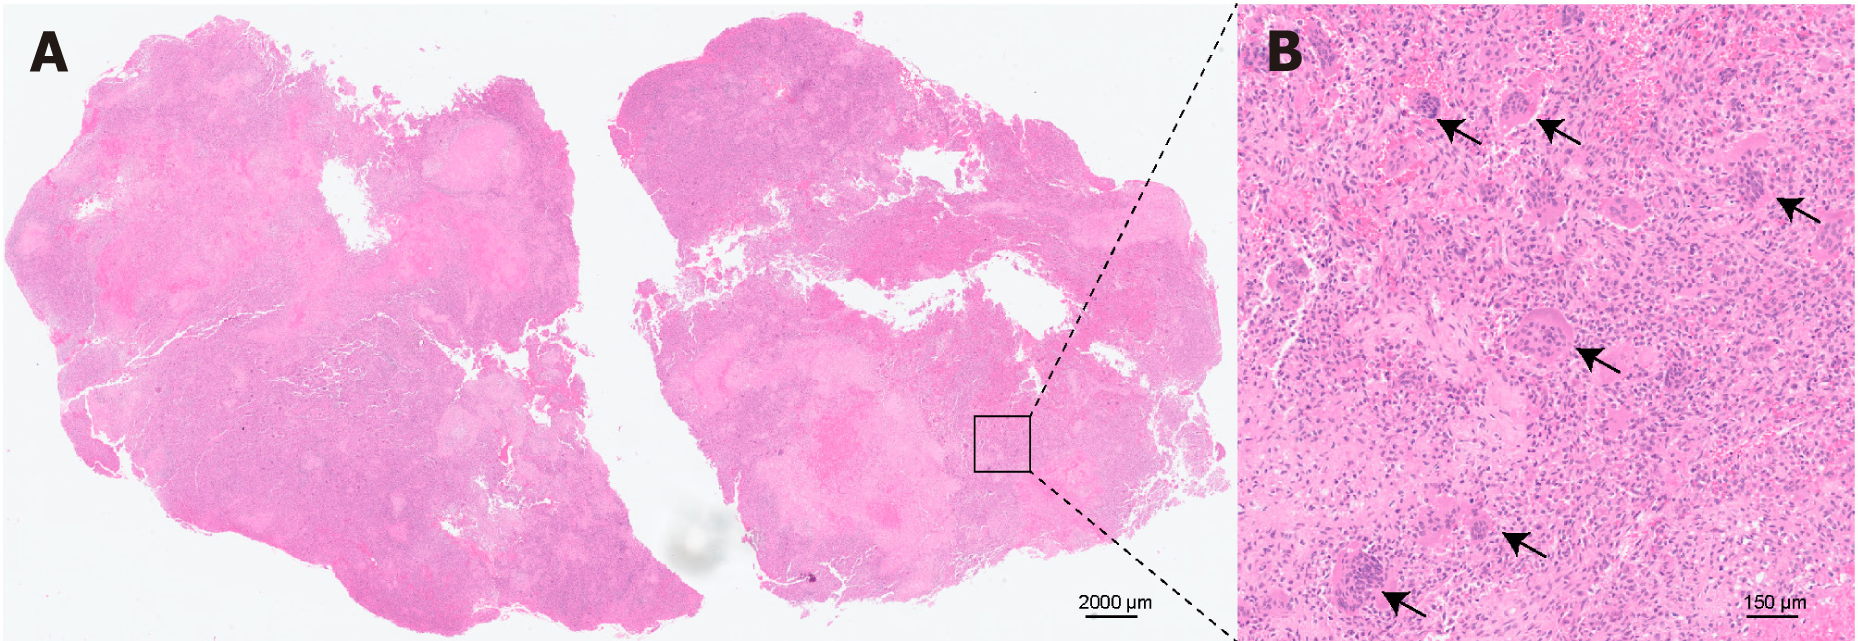
Figure 3 Histological analysis of the entire resected tumor (T6).
A: Hematoxylin and eosin staining of the entire resected tumor (T6); B: Multinucleate giant cells were visible (black arrows) in local magnification of hematoxylin and eosin staining, surrounded by neoplastic stromal cells, and the diagnosis of a giant cell tumor was confirmed.
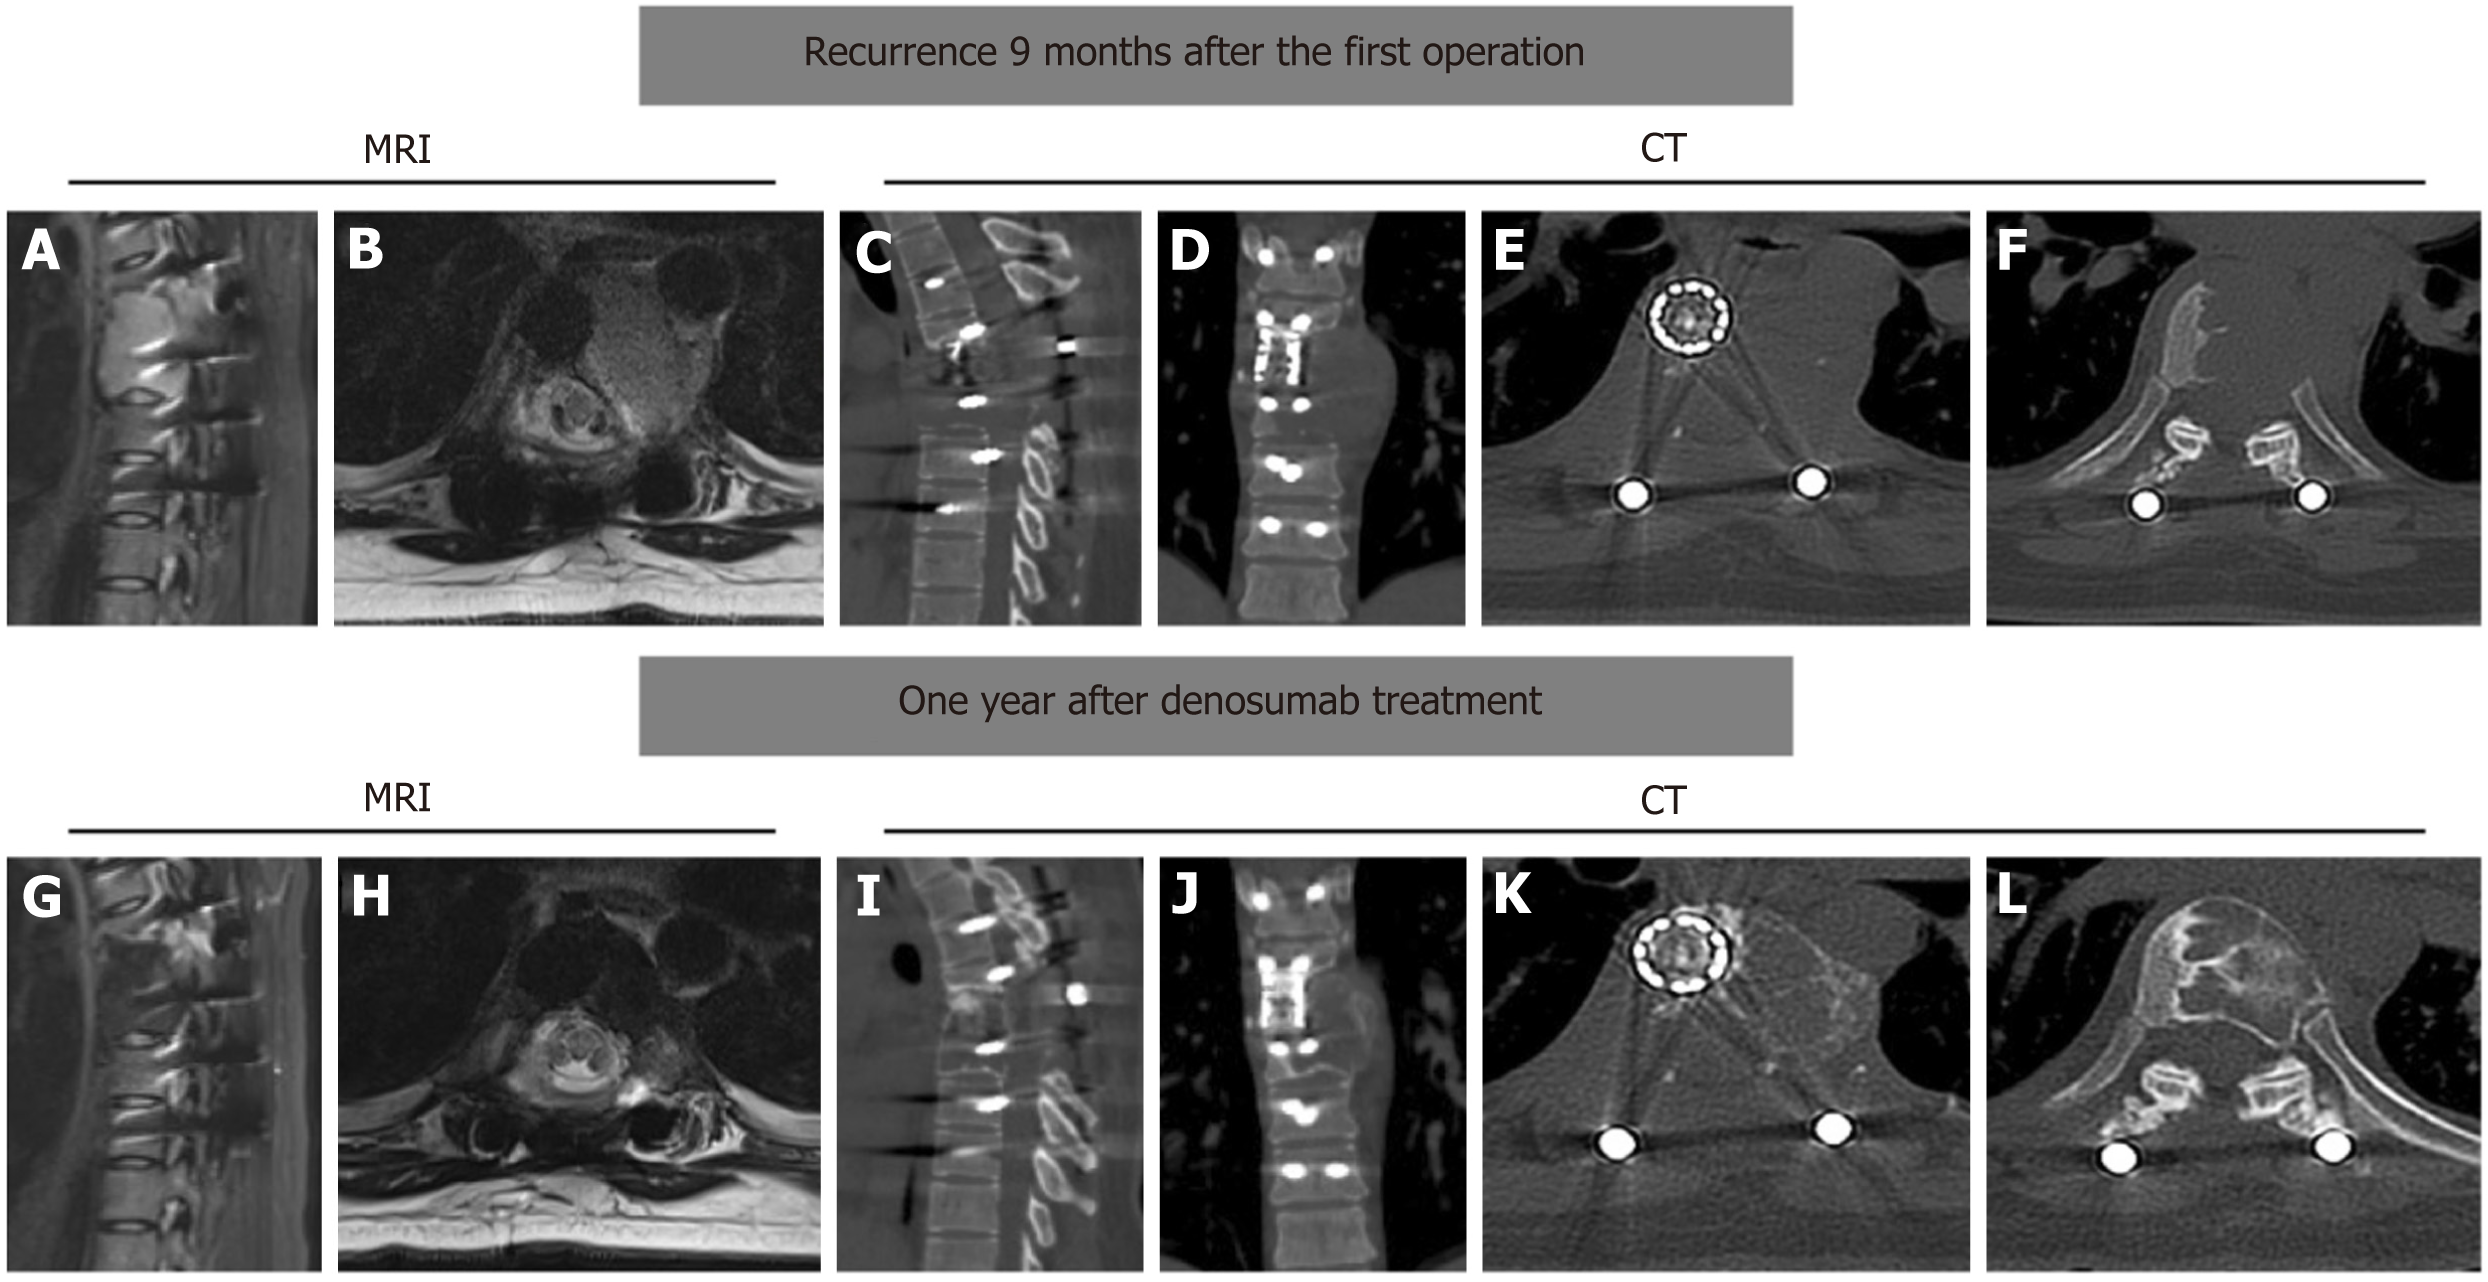
Figure 4 Tumor imaging changes before and after denosumab treatment.
A-F: Magnetic resonance imaging (MRI) (A and B) and computed tomography (CT) (C-F) show giant cell tumor recurrence 9 months after the first total en bloc spondylectomy; G-L: MRI (G and H) and CT (I-L) shows a reduction in tumor size and tumor calcification after 1 year of denosumab treatment.
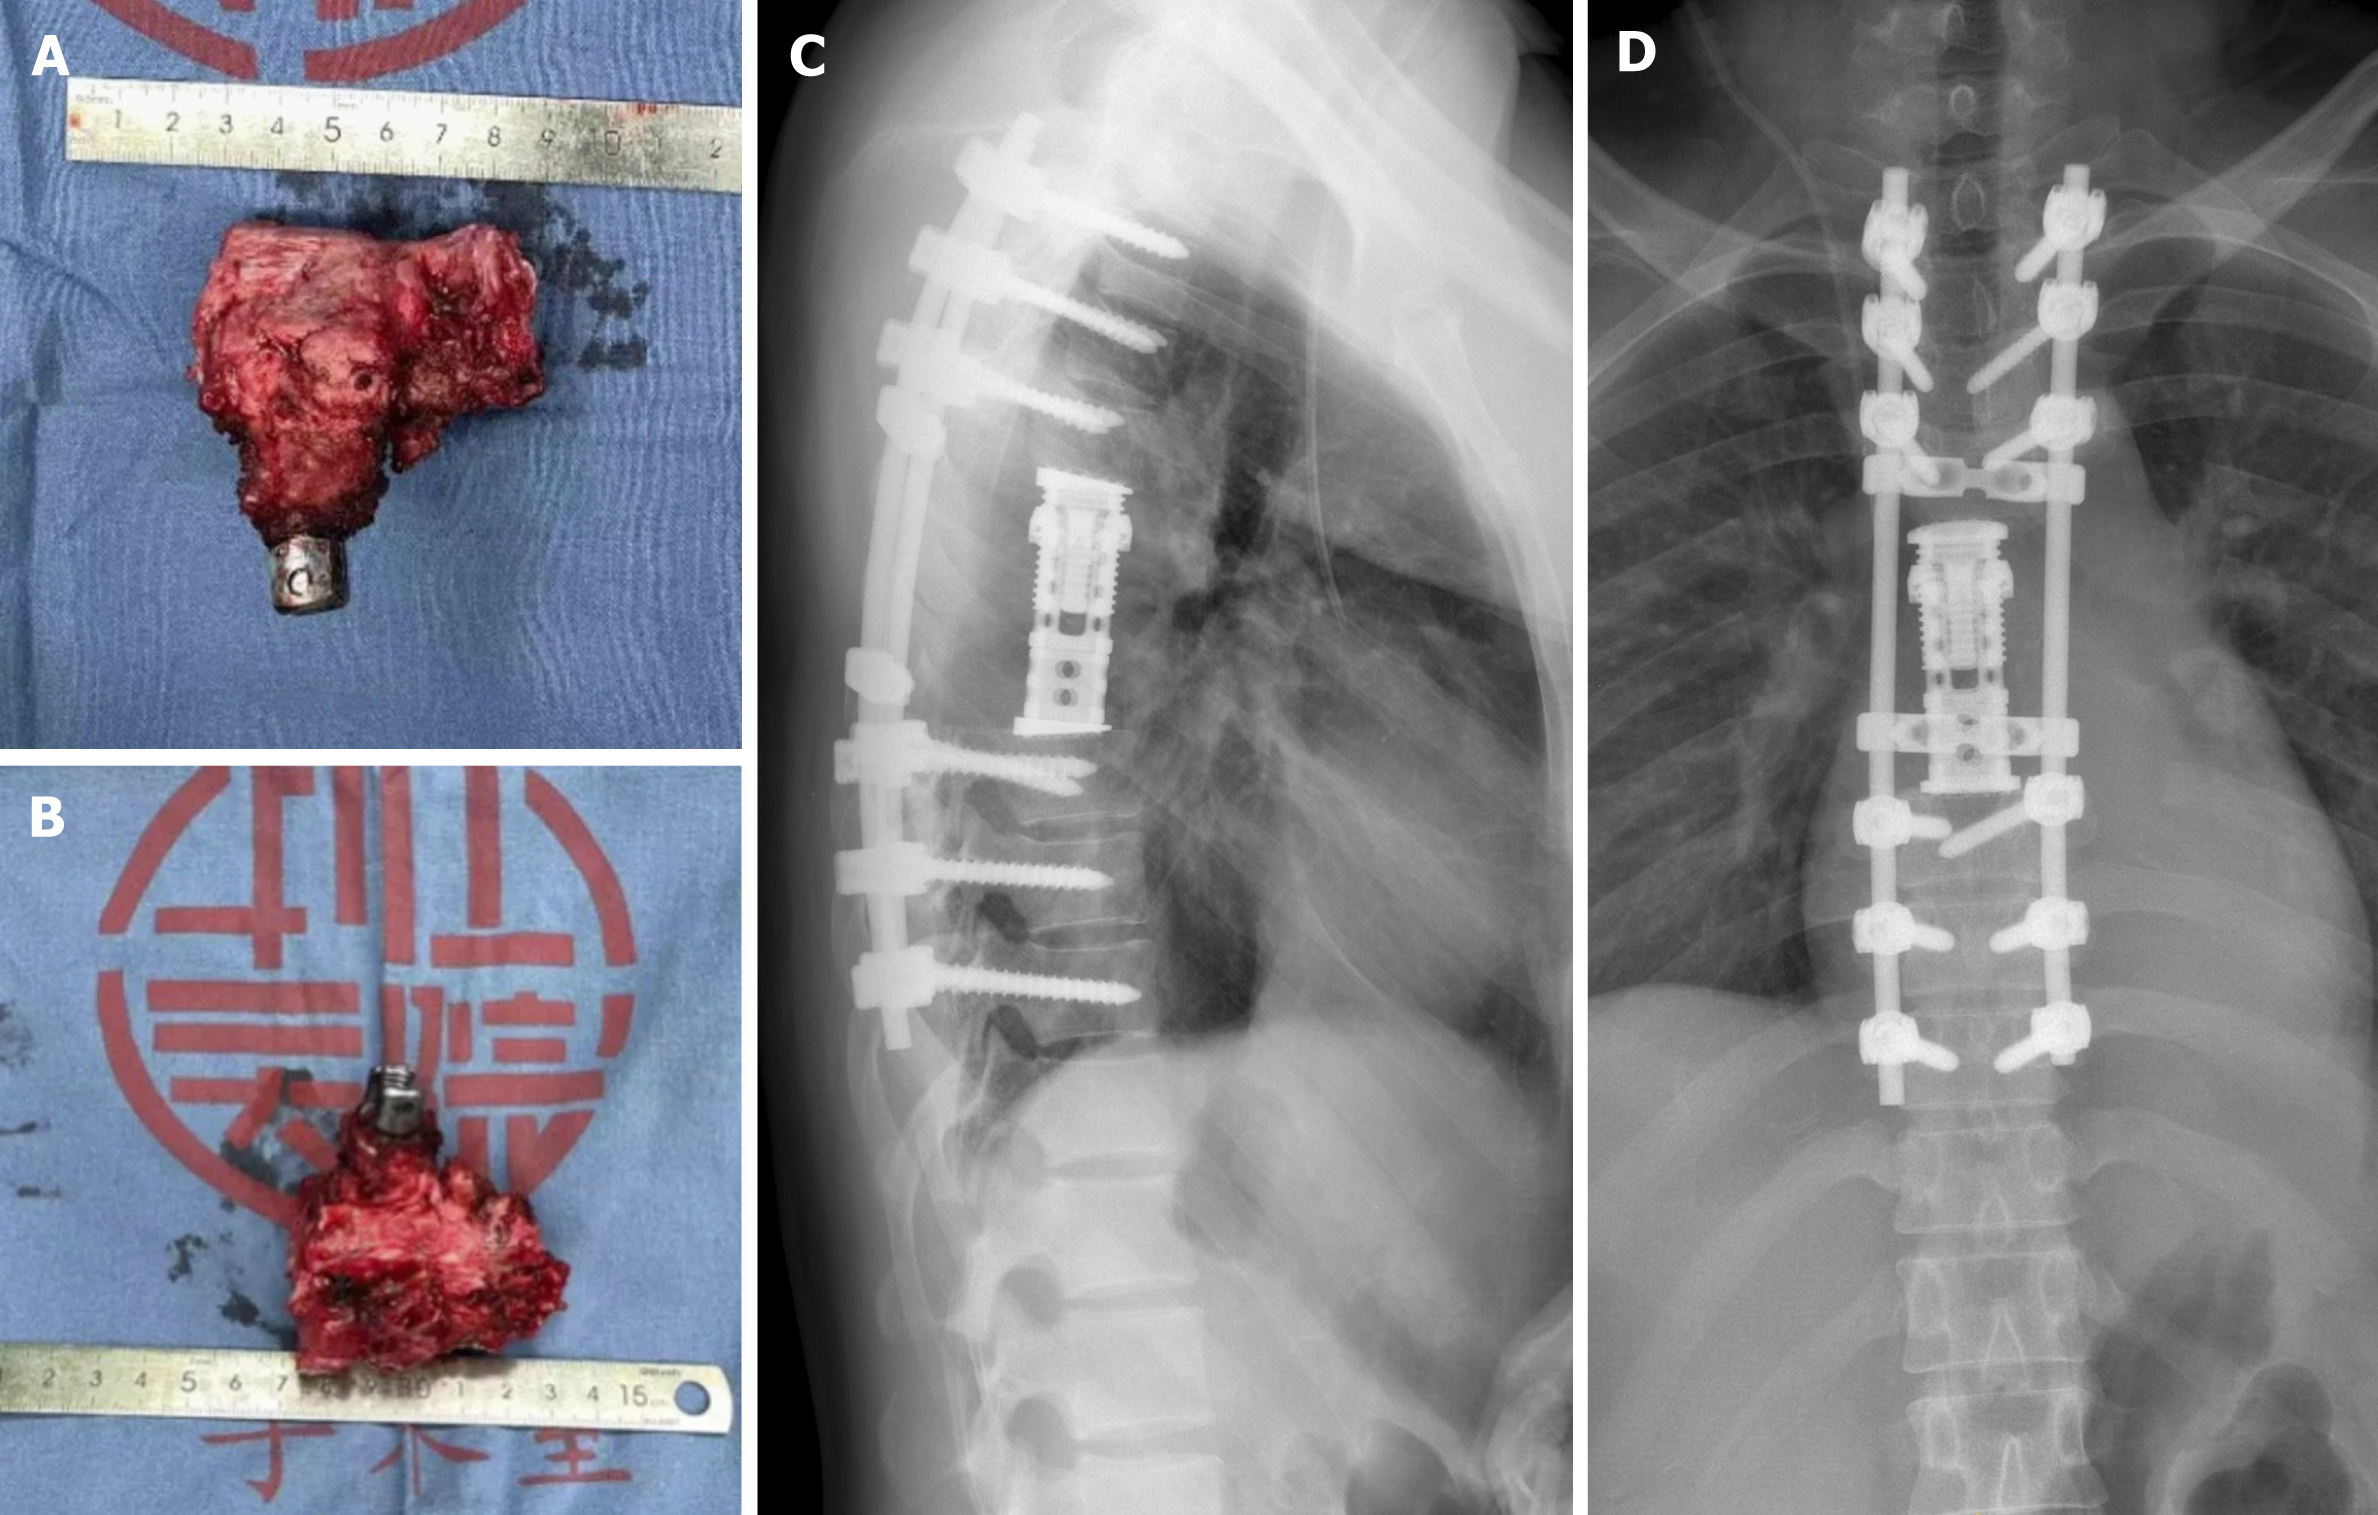
Figure 5 Specimen photographs and postoperative radiographs of the second three-level total enbloc spondylectomy.
A and B: Specimen of the en bloc resected spinal giant cell tumor involving T5, T6, and T7; C and D: Anteroposterior and lateral radiographs showing a good implant position at 1 wk after the second three-level total en bloc spondylectomy.
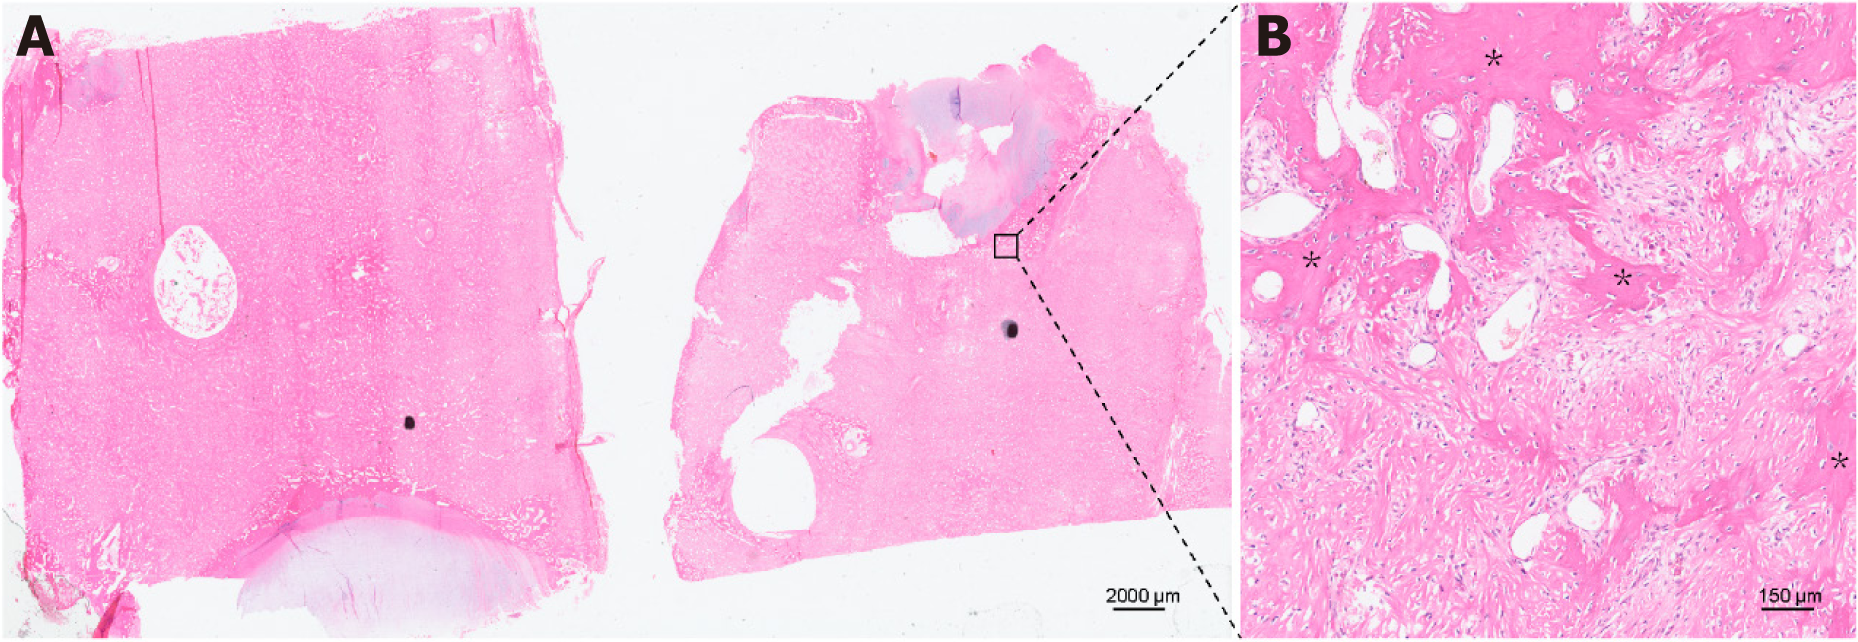
Figure 6 Histological analysis of the entire resected vertebral body (coronal sectional-image).
A: After 12 months of denosumab therapy, fibrosis and prominent, peripheral ossification of the tumor was identified in hematoxylin and eosin staining, indicating a good response to denosumab treatment; B: Multinucleated giant cells were not detected in local magnification of hematoxylin and eosin staining. Asterisk: Woven bone.
Figure 7 The 15-month follow-up imaging of the patient after the second three-level total enbloc spondylectomy.
The images show a stable construct, biological fusion, and no local recurrence at the 15-month follow-up after the second three-level total en bloc spondylectomy. A and B: Anteroposterior and lateral radiographs; C-E: Three-dimensional computed tomography scan images; F: Magnetic resonance imaging.
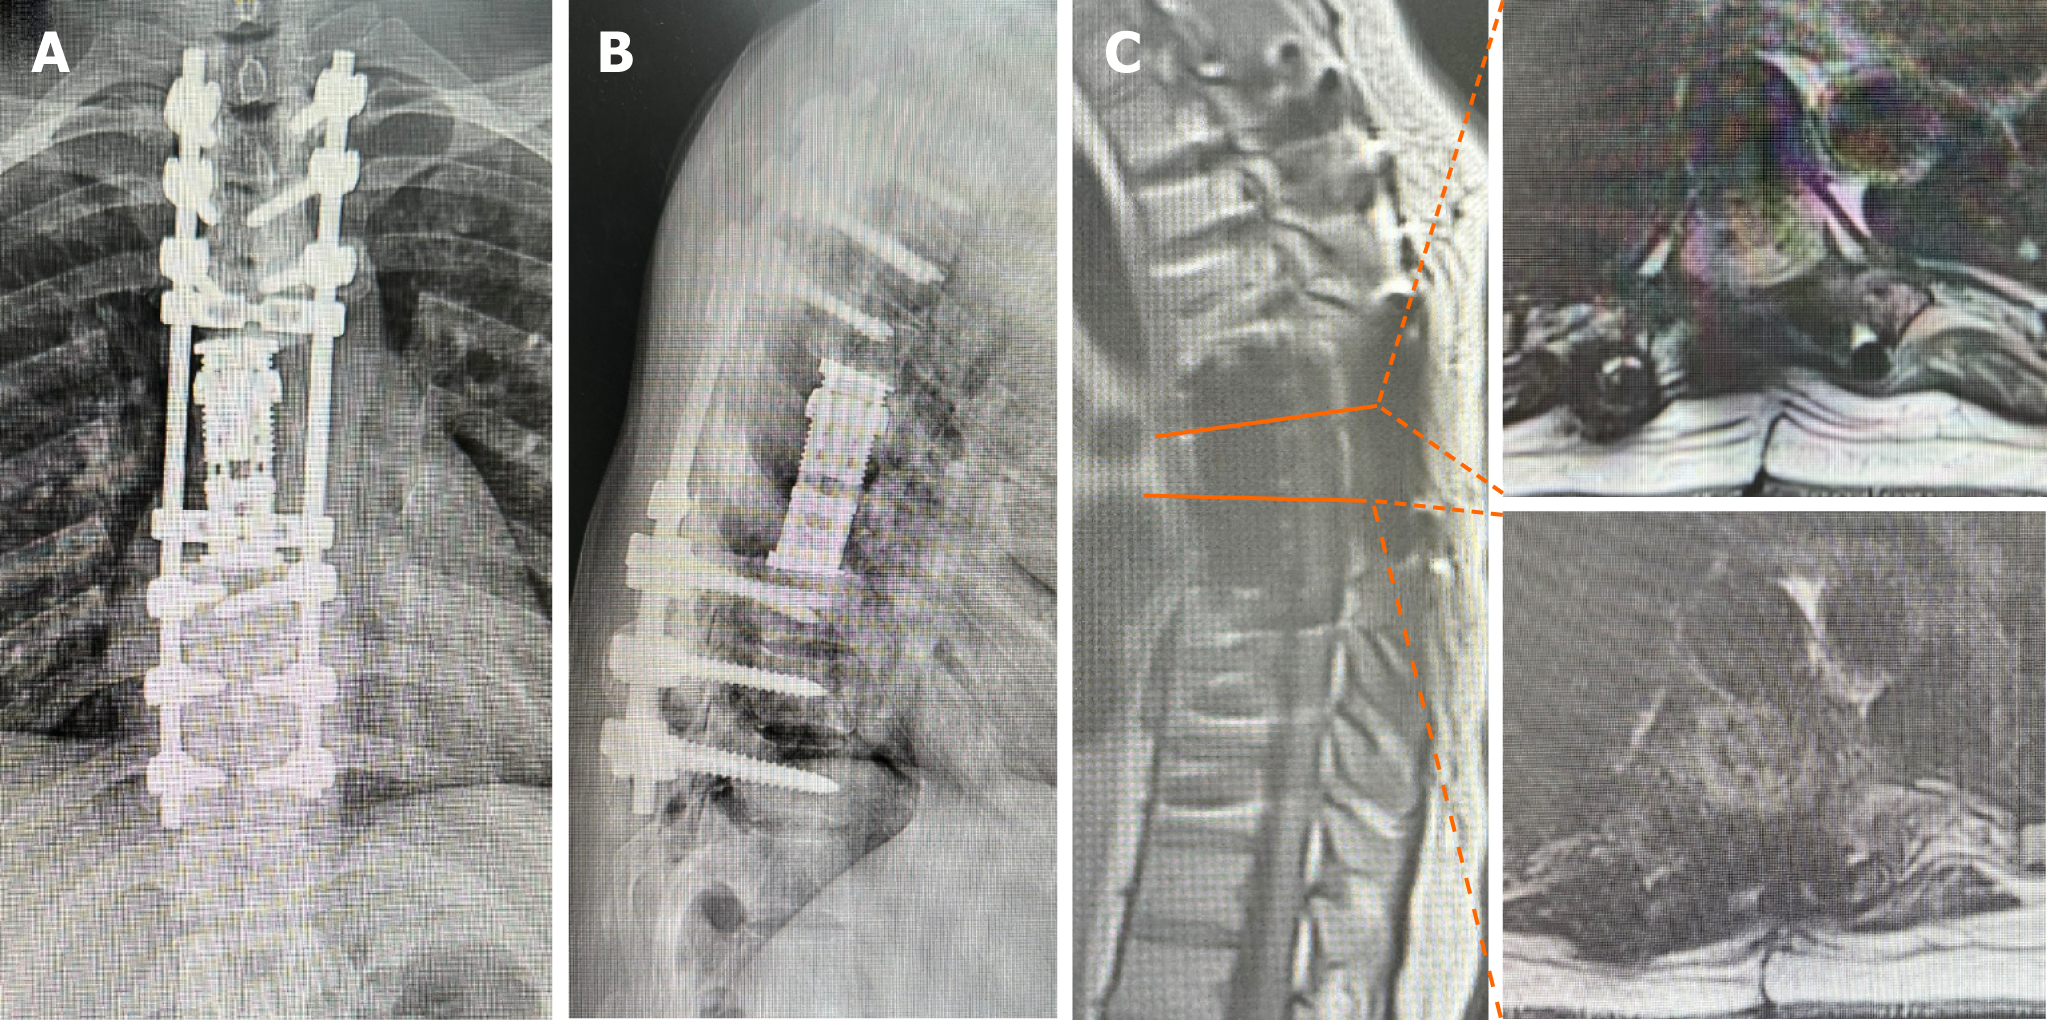
Figure 8 The 18-month follow-up imaging of the patient after the second three-level total enbloc spondylectomy.
A and B: Anteroposterior and lateral radiographs; C: Magnetic resonance imaging shows a stable construct and no local recurrence at the 18-month follow-up after the second three-level total en bloc spondylectomy.
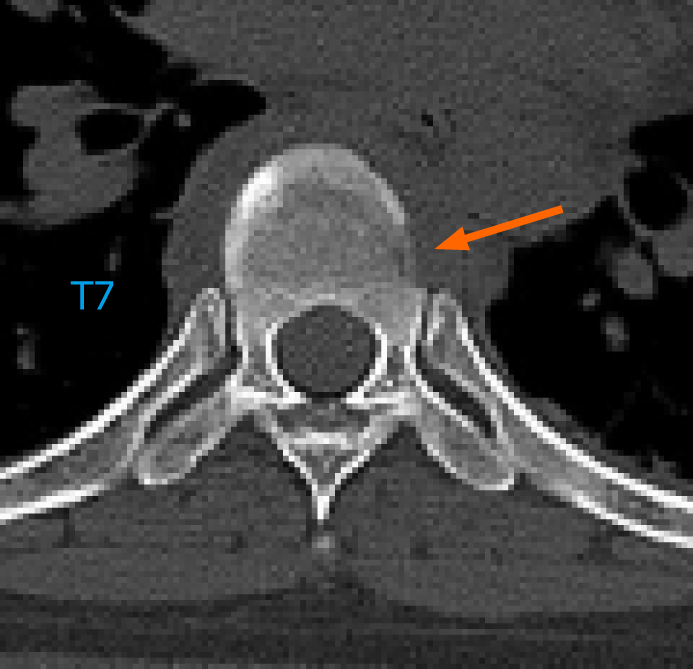
Figure 9 Emergency computed tomography before the first total enbloc spondylectomy.
The arrow indicates the osteolytic destruction of T7 that was not noticed before the first emergency surgery.
- Citation: Liang HF, Xu H, Zhan MN, Xiao J, Li J, Fei QM. Thoracic giant cell tumor after two total en bloc spondylectomies including one emergency surgery: A case report. World J Clin Cases 2024; 12(16): 2894-2903
- URL: https://www.wjgnet.com/2307-8960/full/v12/i16/2894.htm
- DOI: https://dx.doi.org/10.12998/wjcc.v12.i16.2894


