Copyright
©The Author(s) 2024.
World J Clin Cases. Jun 6, 2024; 12(16): 2713-2721
Published online Jun 6, 2024. doi: 10.12998/wjcc.v12.i16.2713
Published online Jun 6, 2024. doi: 10.12998/wjcc.v12.i16.2713
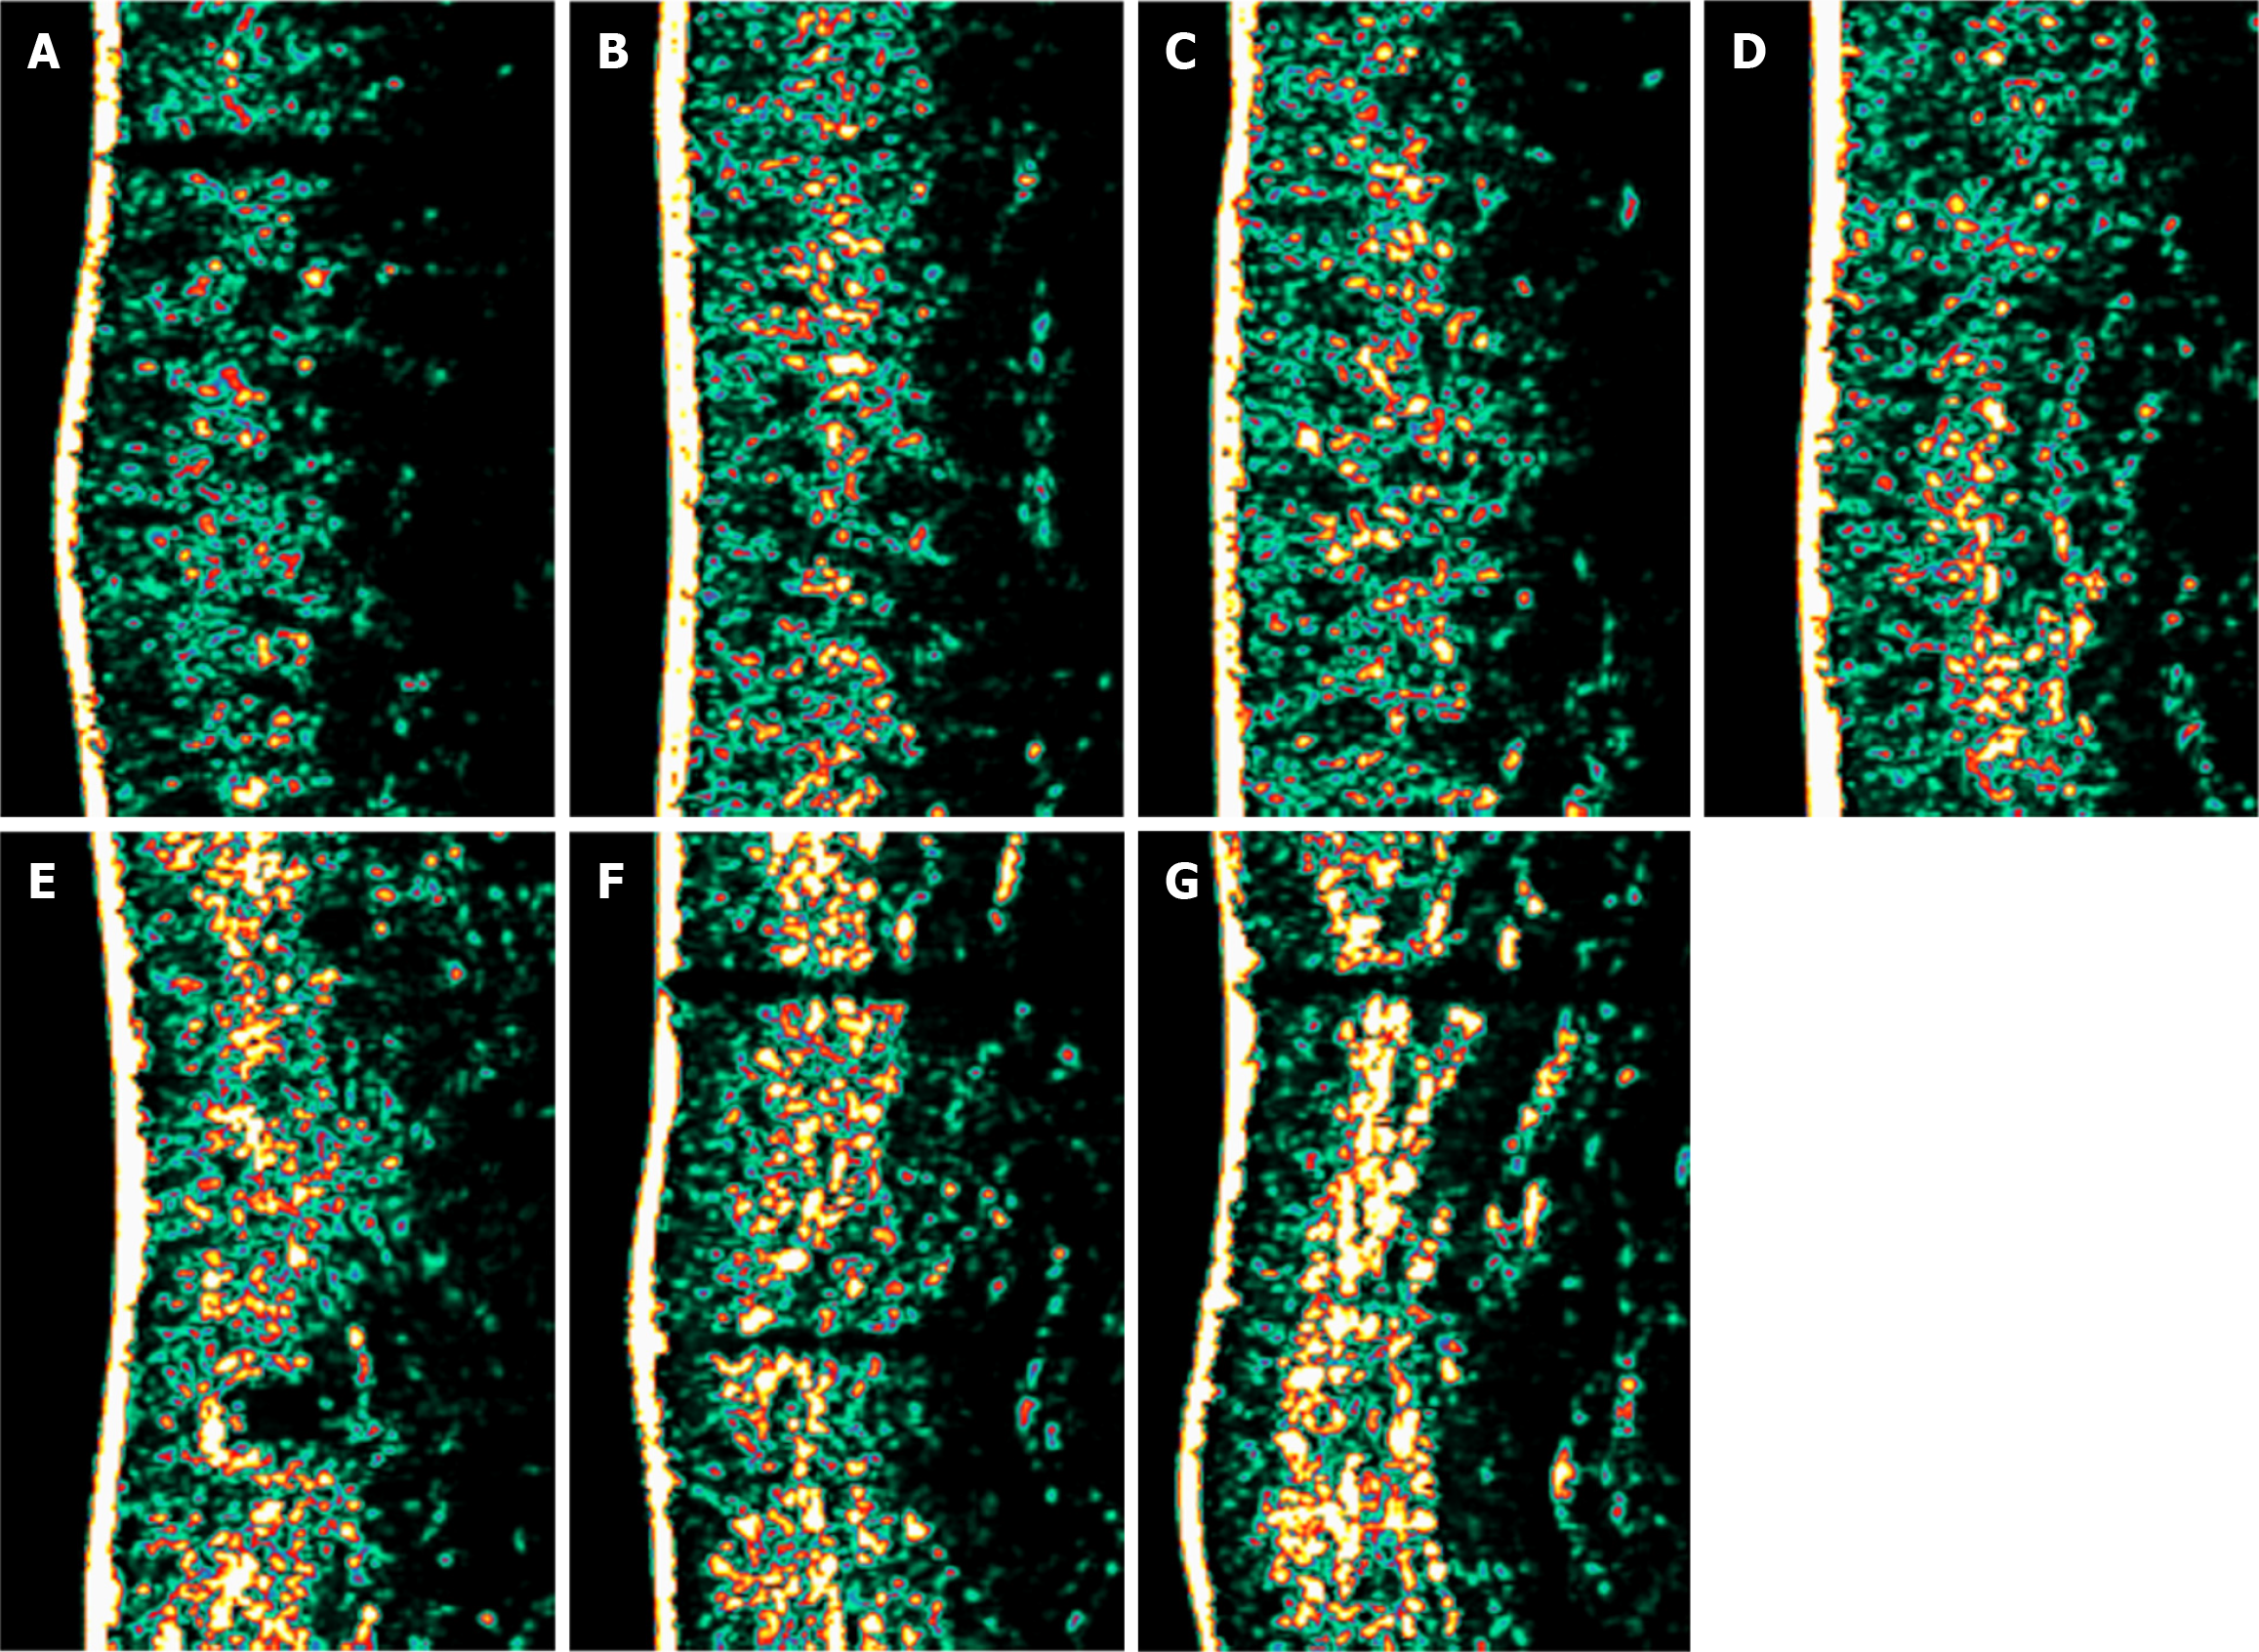
Figure 1 Skin ultrasound images.
Dermalab SkinLab Combo ultrasound probe can be used to obtain skin cross-sectional images and skin thickness values based on different sound level signals. The brighter the color in the image, the greater the density of the area, which indirectly reflects the density of subcutaneous collagen. Skin ultrasound images showed that the skin thickness increased after six treatments compared with baseline. A: Before treatment; B: After the first treatment; C: After the second treatment; D: After the third treatment; E: After the fourth treatment; F: After the fifth treatment; G: After the sixth treatment.
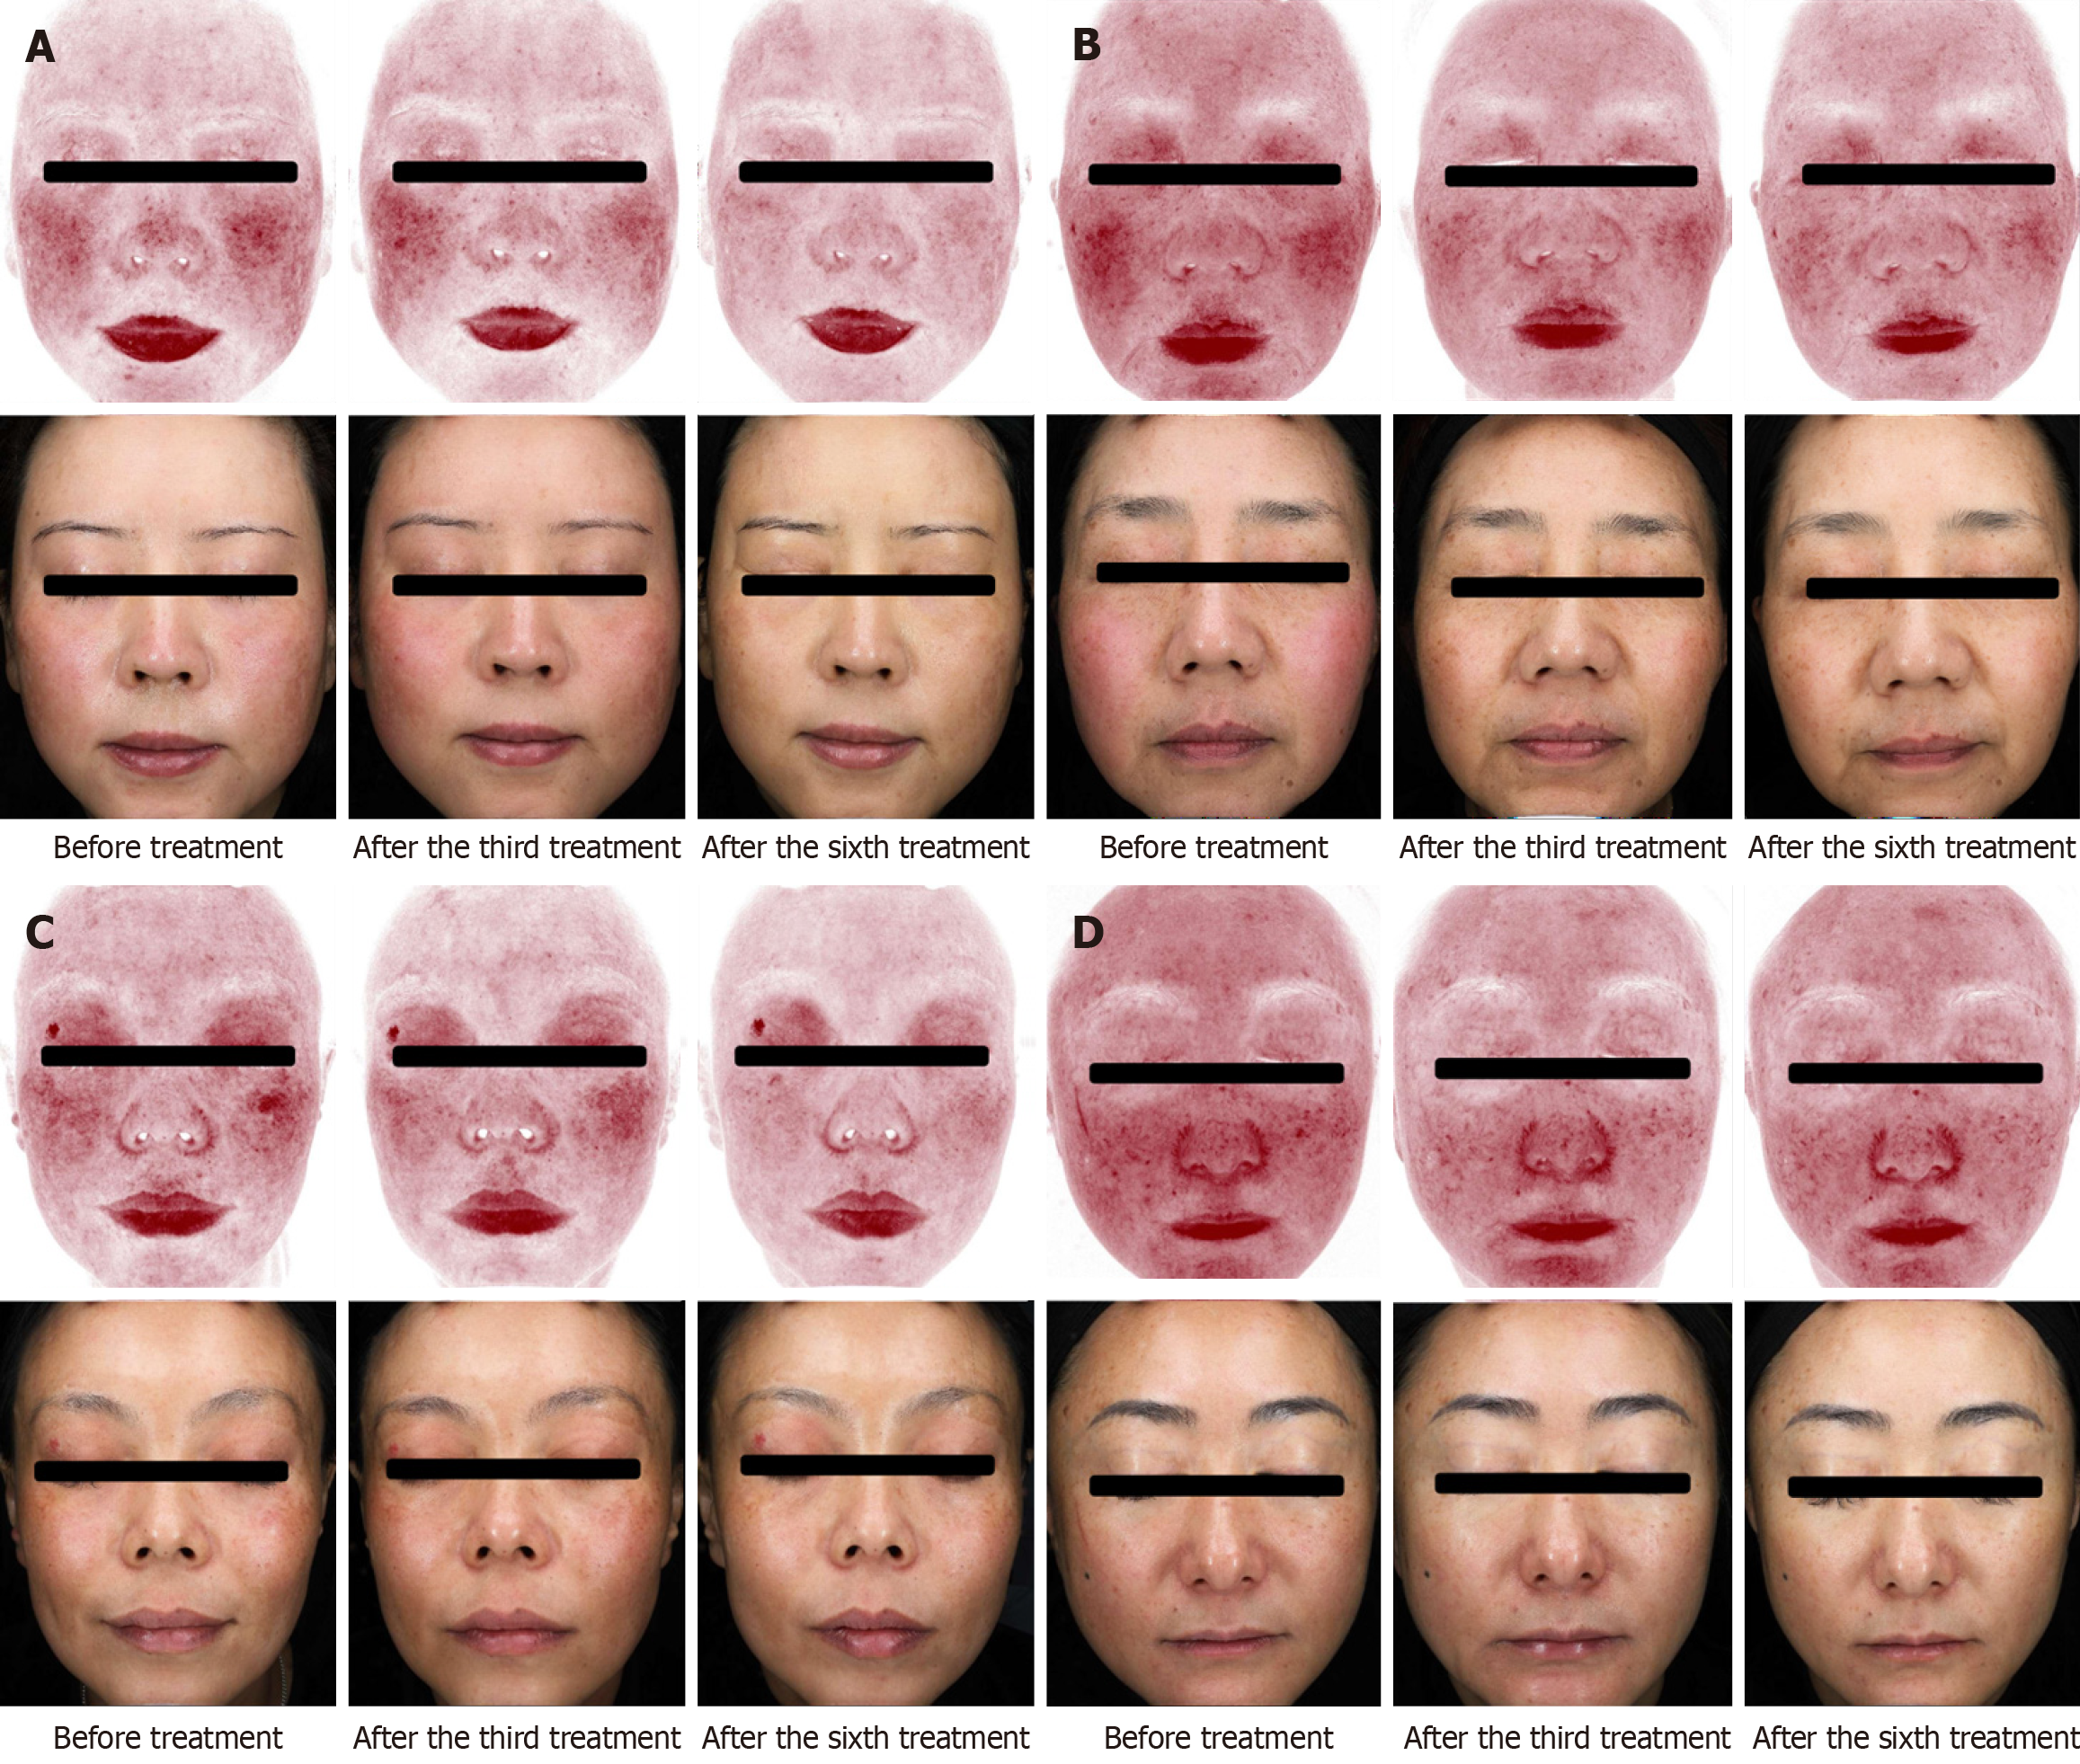
Figure 2 Facial photographs and associated redness feature maps of four participants.
The images illustrate the condition of the face before treatment, after the third treatment, and after the sixth treatment. Notably, red zone counts decreased after each treatment compared with baseline. A: A 52-year-old female patient. The redness feature maps show a clear reduction in facial redness from before treatment to after the 3rd and 6th treatments; B: A 49-year-old female patient. Similar to patient A, the redness feature maps demonstrate a progressive decrease in facial redness following the 3rd and 6th treatment sessions compared to baseline; C: A 46-year-old female patient. The redness feature maps reveal a noticeable decline in facial redness after the 3rd treatment, with further improvement seen after the 6th treatment; D: A 51-year-old male patient. Consistent with the female patients, the male patient's redness feature maps illustrate a gradual reduction in facial redness from before treatment to following the 3rd and 6th treatment sessions.
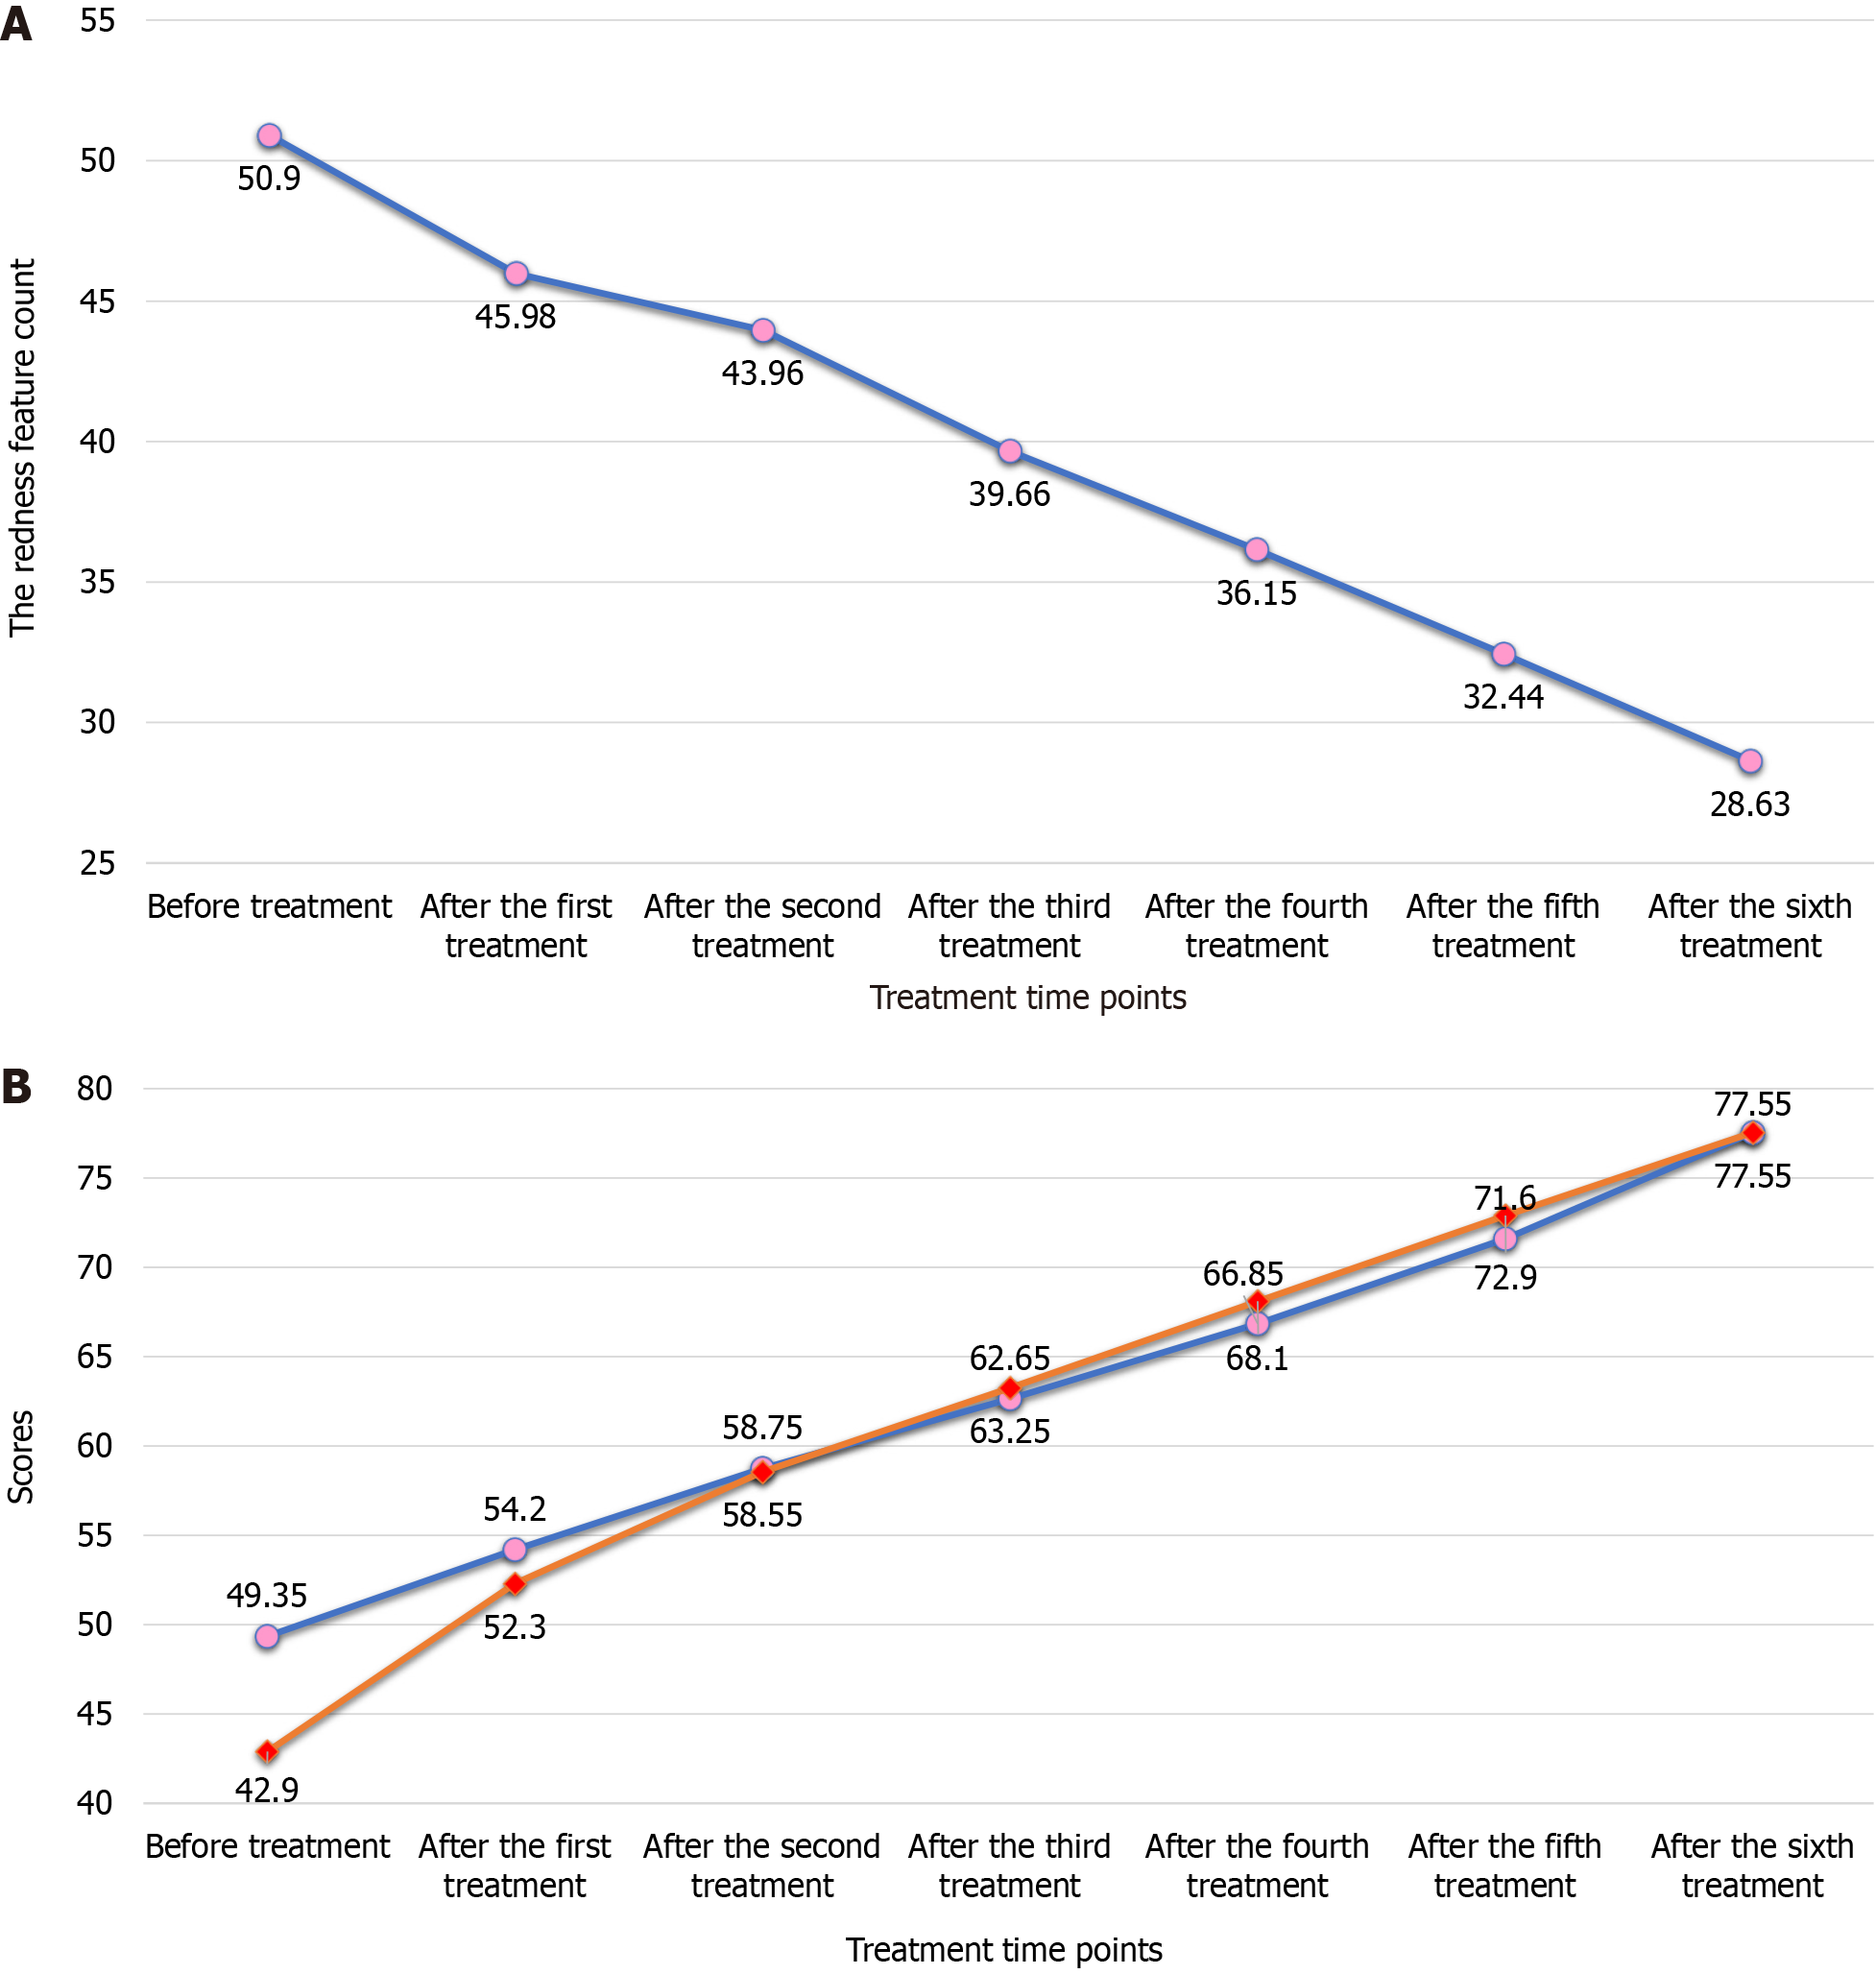
Figure 3 Redness feature counts and Face-Q satisfaction scores before and after treatment.
A: Trend of the red area feature count before and after treatment. The graph shows the trend in the mean counts of redness features before and after treatment for the 20 subjects with a blue line, while solid dots are used to represent the mean counts at each treatment time point; B: Trends of Face-Q facial appearance satisfaction and skin satisfaction scores before and after treatment. The graph shows the trend of the Face-Q Satisfaction with Facial Appearance mean scores of 20 subjects before and after treatment in blue, and the trend of the Face-Q Satisfaction with Skin mean scores of 20 subjects before and after treatment in orange. The solid dots indicate the mean scores at each treatment time point.
- Citation: Yang B, He A, Bu BB, Zhuo G, Zhou QZ, He JH, Liu L, Huang WL, Zhao X. Clinical efficacy of intradermal type I collagen injections in treating skin photoaging in patients from high-altitude areas. World J Clin Cases 2024; 12(16): 2713-2721
- URL: https://www.wjgnet.com/2307-8960/full/v12/i16/2713.htm
- DOI: https://dx.doi.org/10.12998/wjcc.v12.i16.2713


