Copyright
©The Author(s) 2024.
World J Clin Cases. May 26, 2024; 12(15): 2506-2521
Published online May 26, 2024. doi: 10.12998/wjcc.v12.i15.2506
Published online May 26, 2024. doi: 10.12998/wjcc.v12.i15.2506
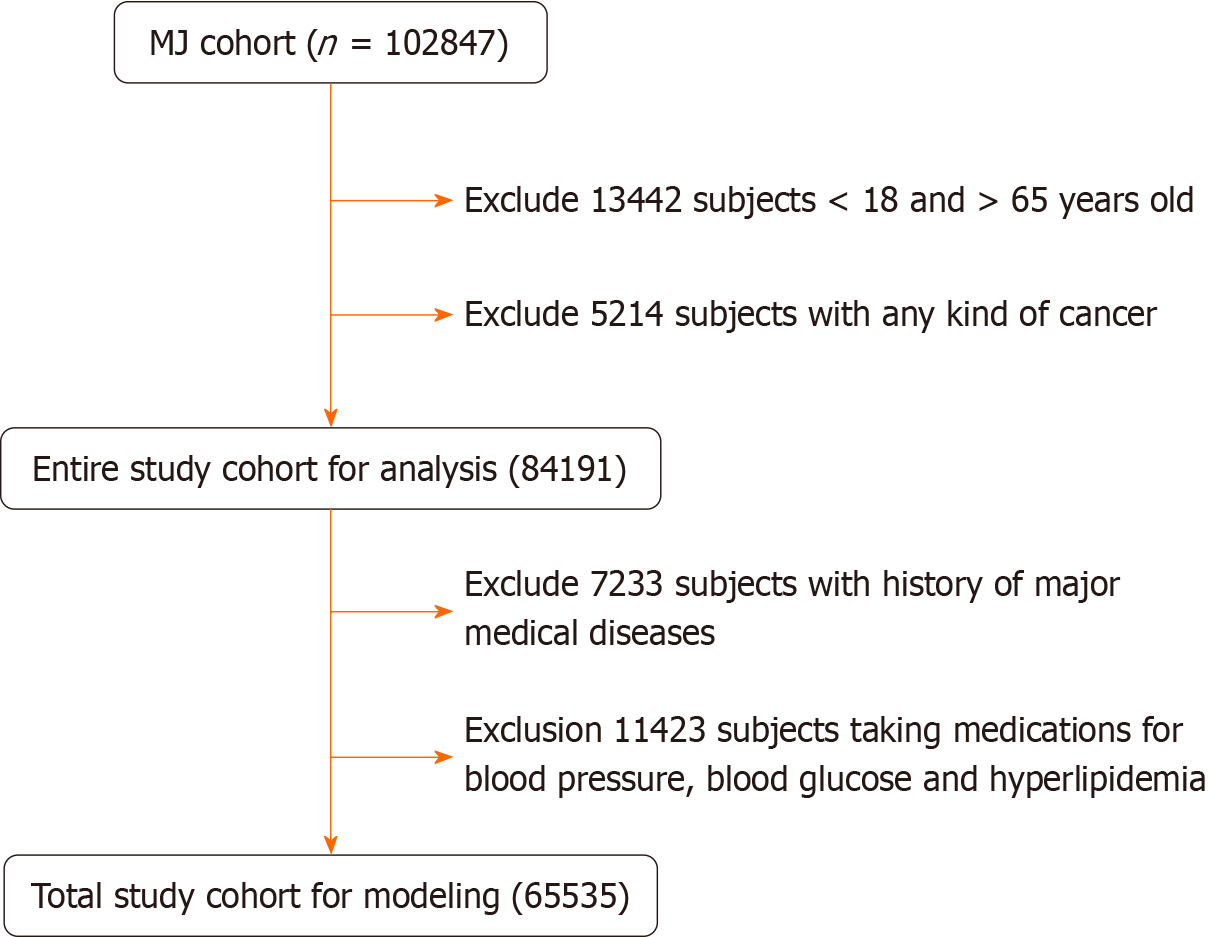
Figure 1 Flowchart of sample selection from the MJ Health Screening Centers Study Cohort.
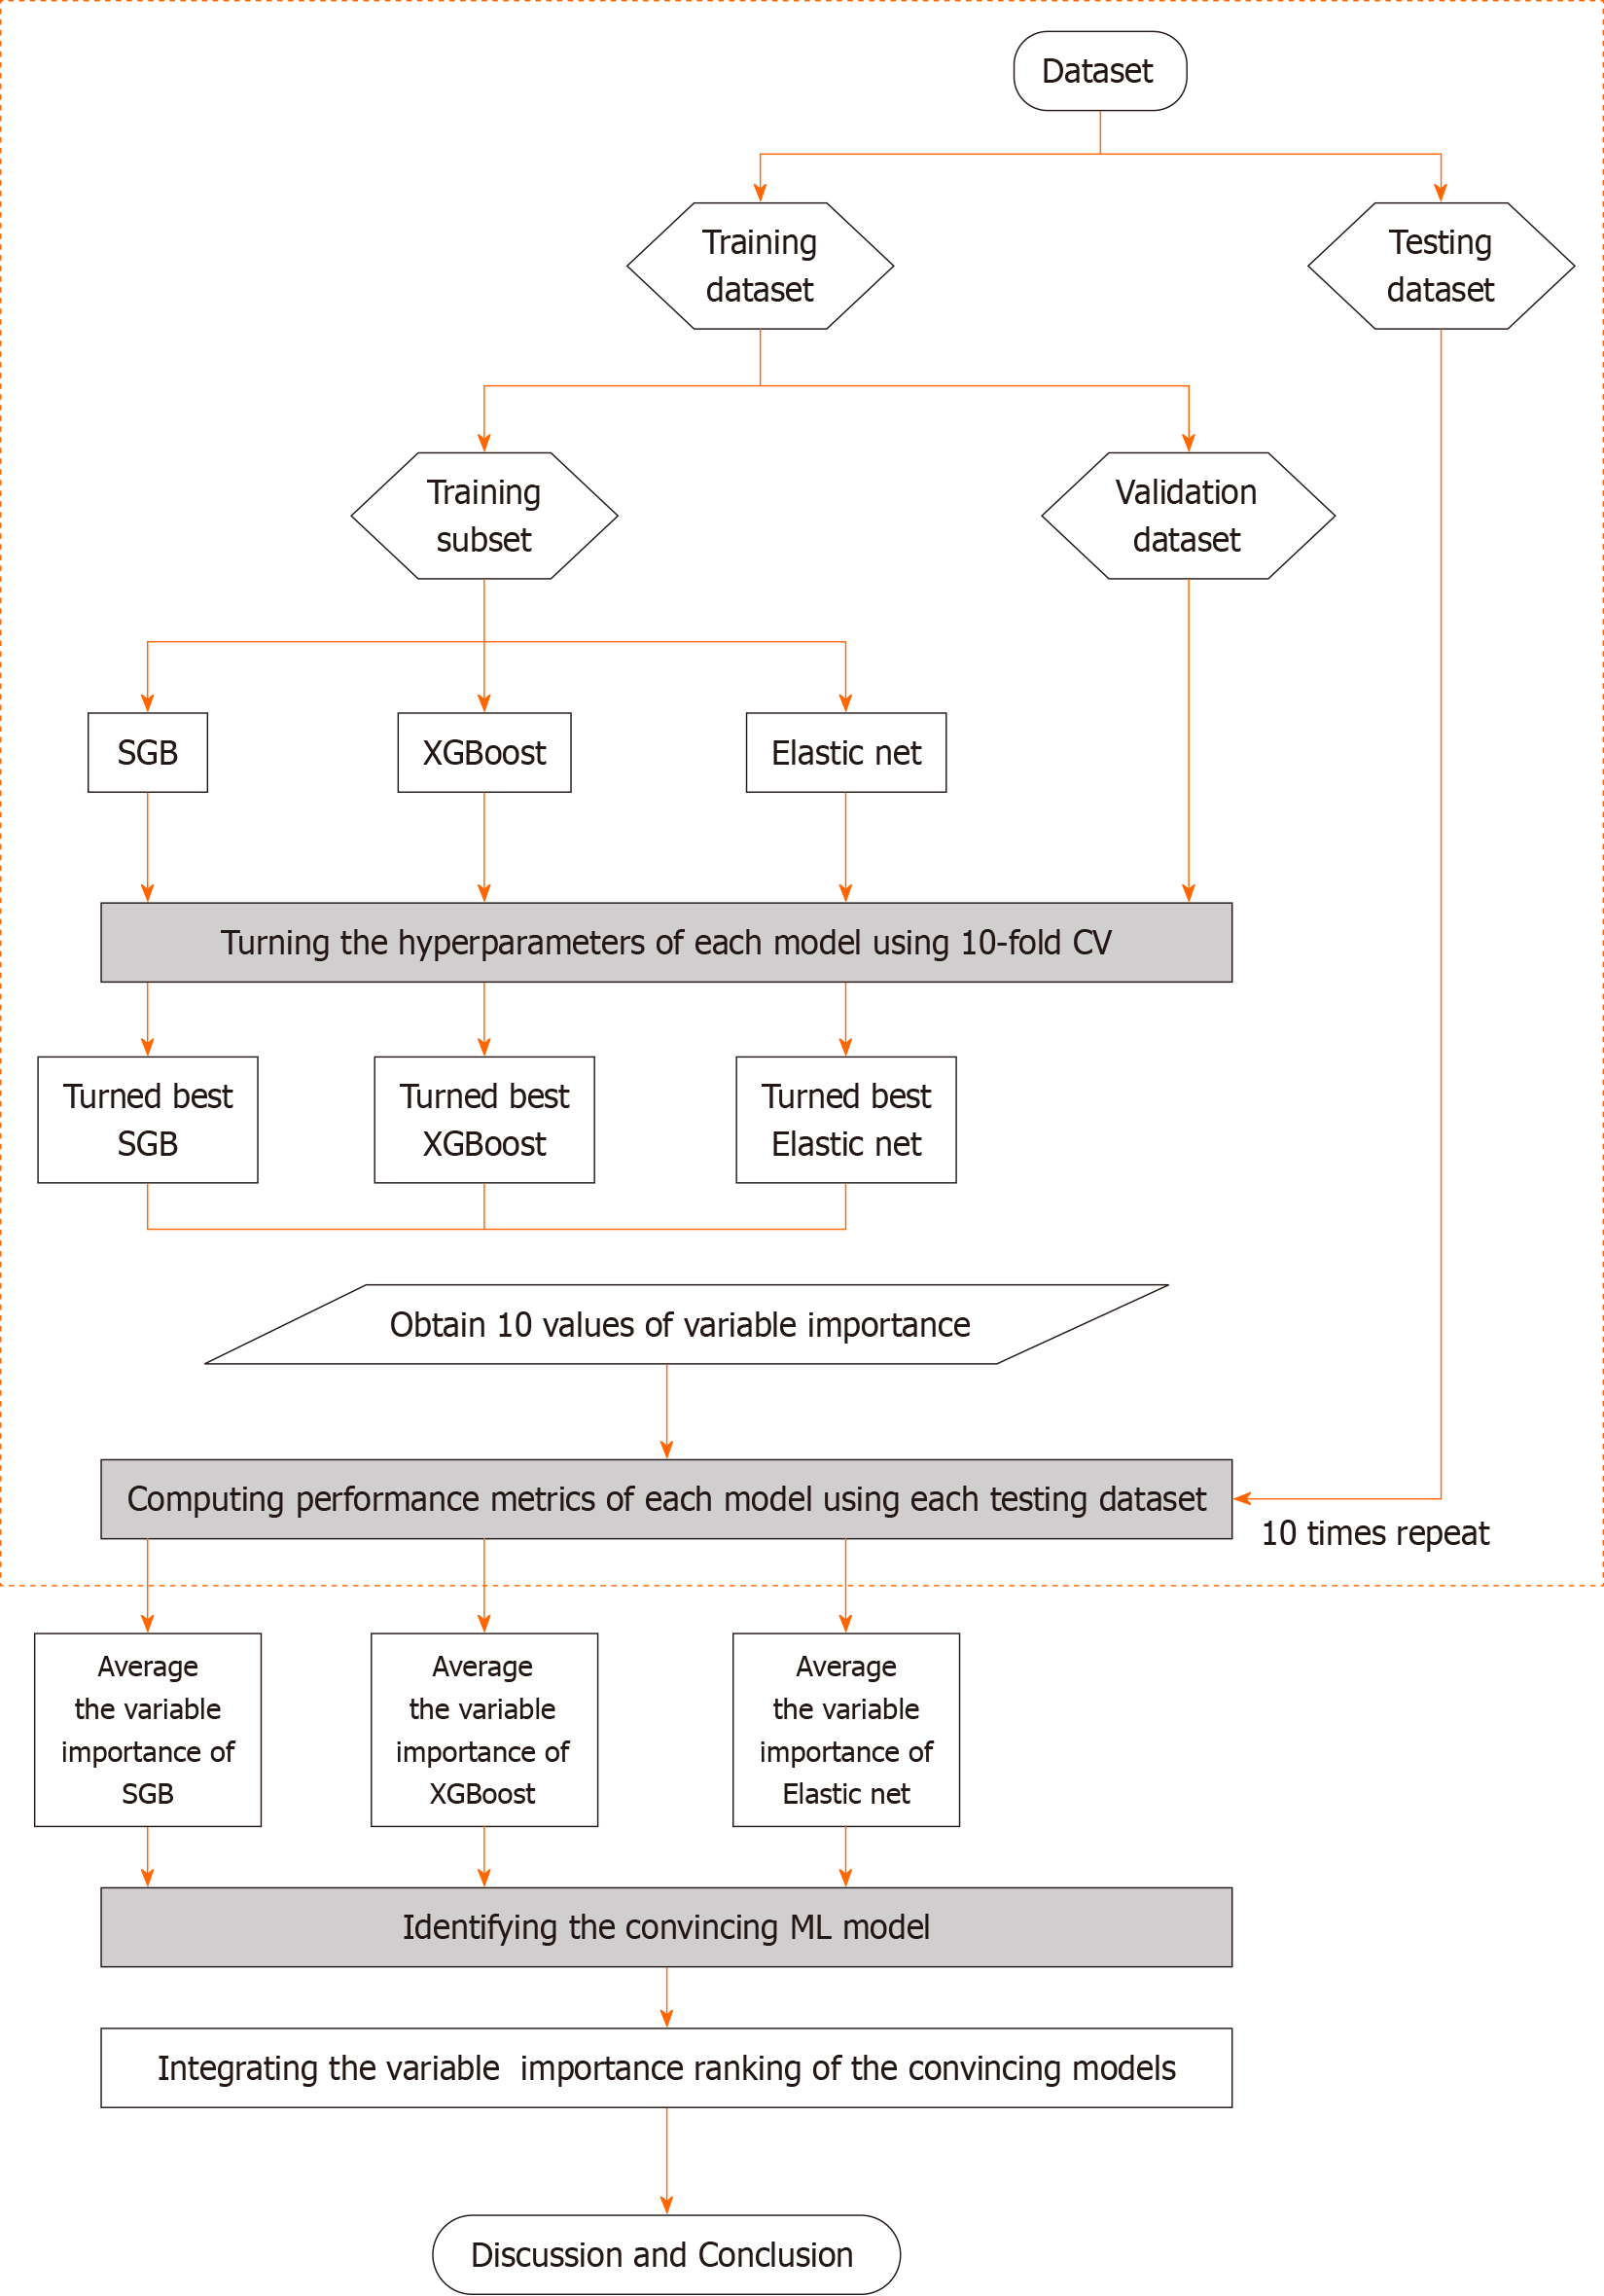
Figure 2 Flowchart of the proposed machine learning methods.
XGBoost: eXtreme gradient boosting.
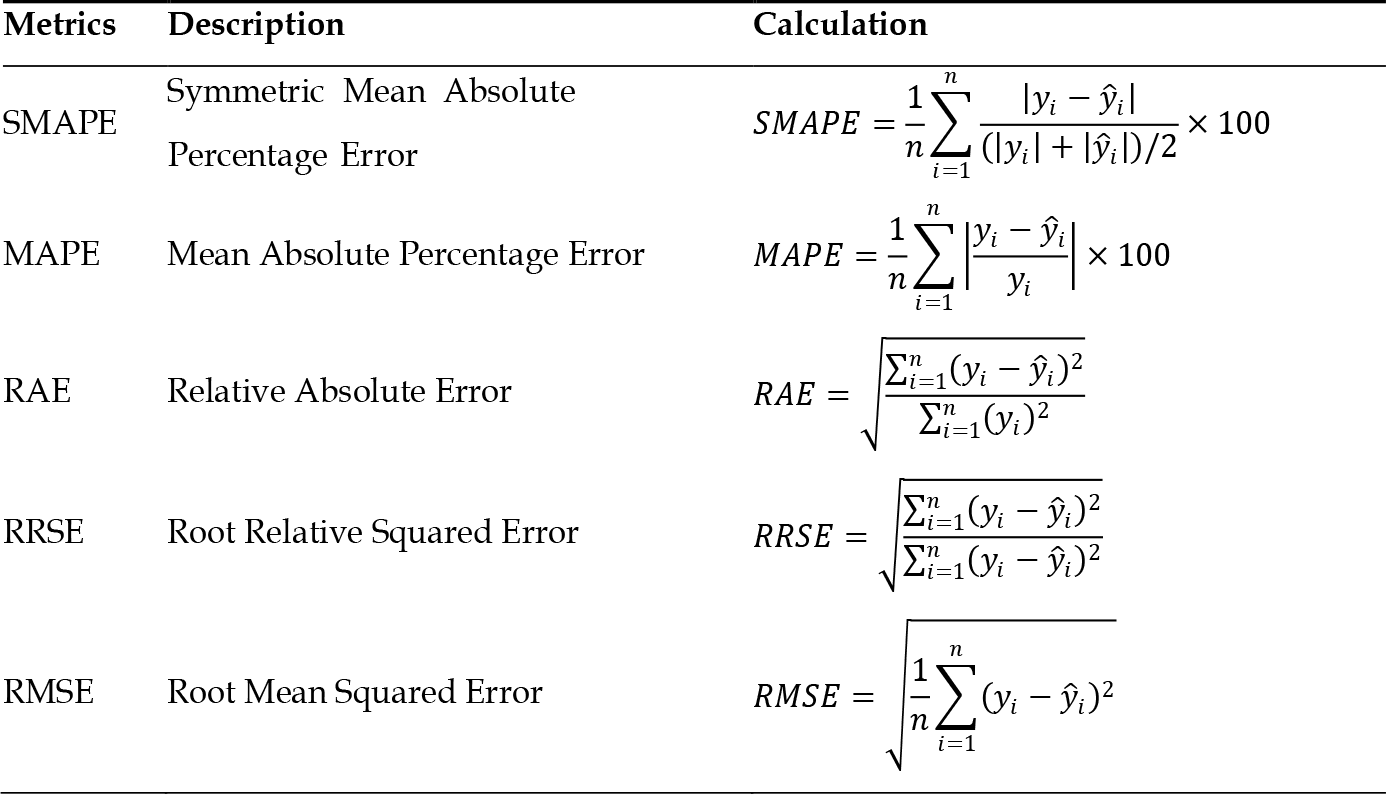
Figure 3 Equation of performance evaluation metrics.
ŷi and yi respectively represent predicted and actual values; n is the number of instances. SMAPE: Symmetric Mean Absolute Percentage Error; MAPE: Mean Absolute Percentage Error; RAE: Relative Absolute Error; RRSE: Root Relative Squared Error; RMSE: Root Mean Squared Error.
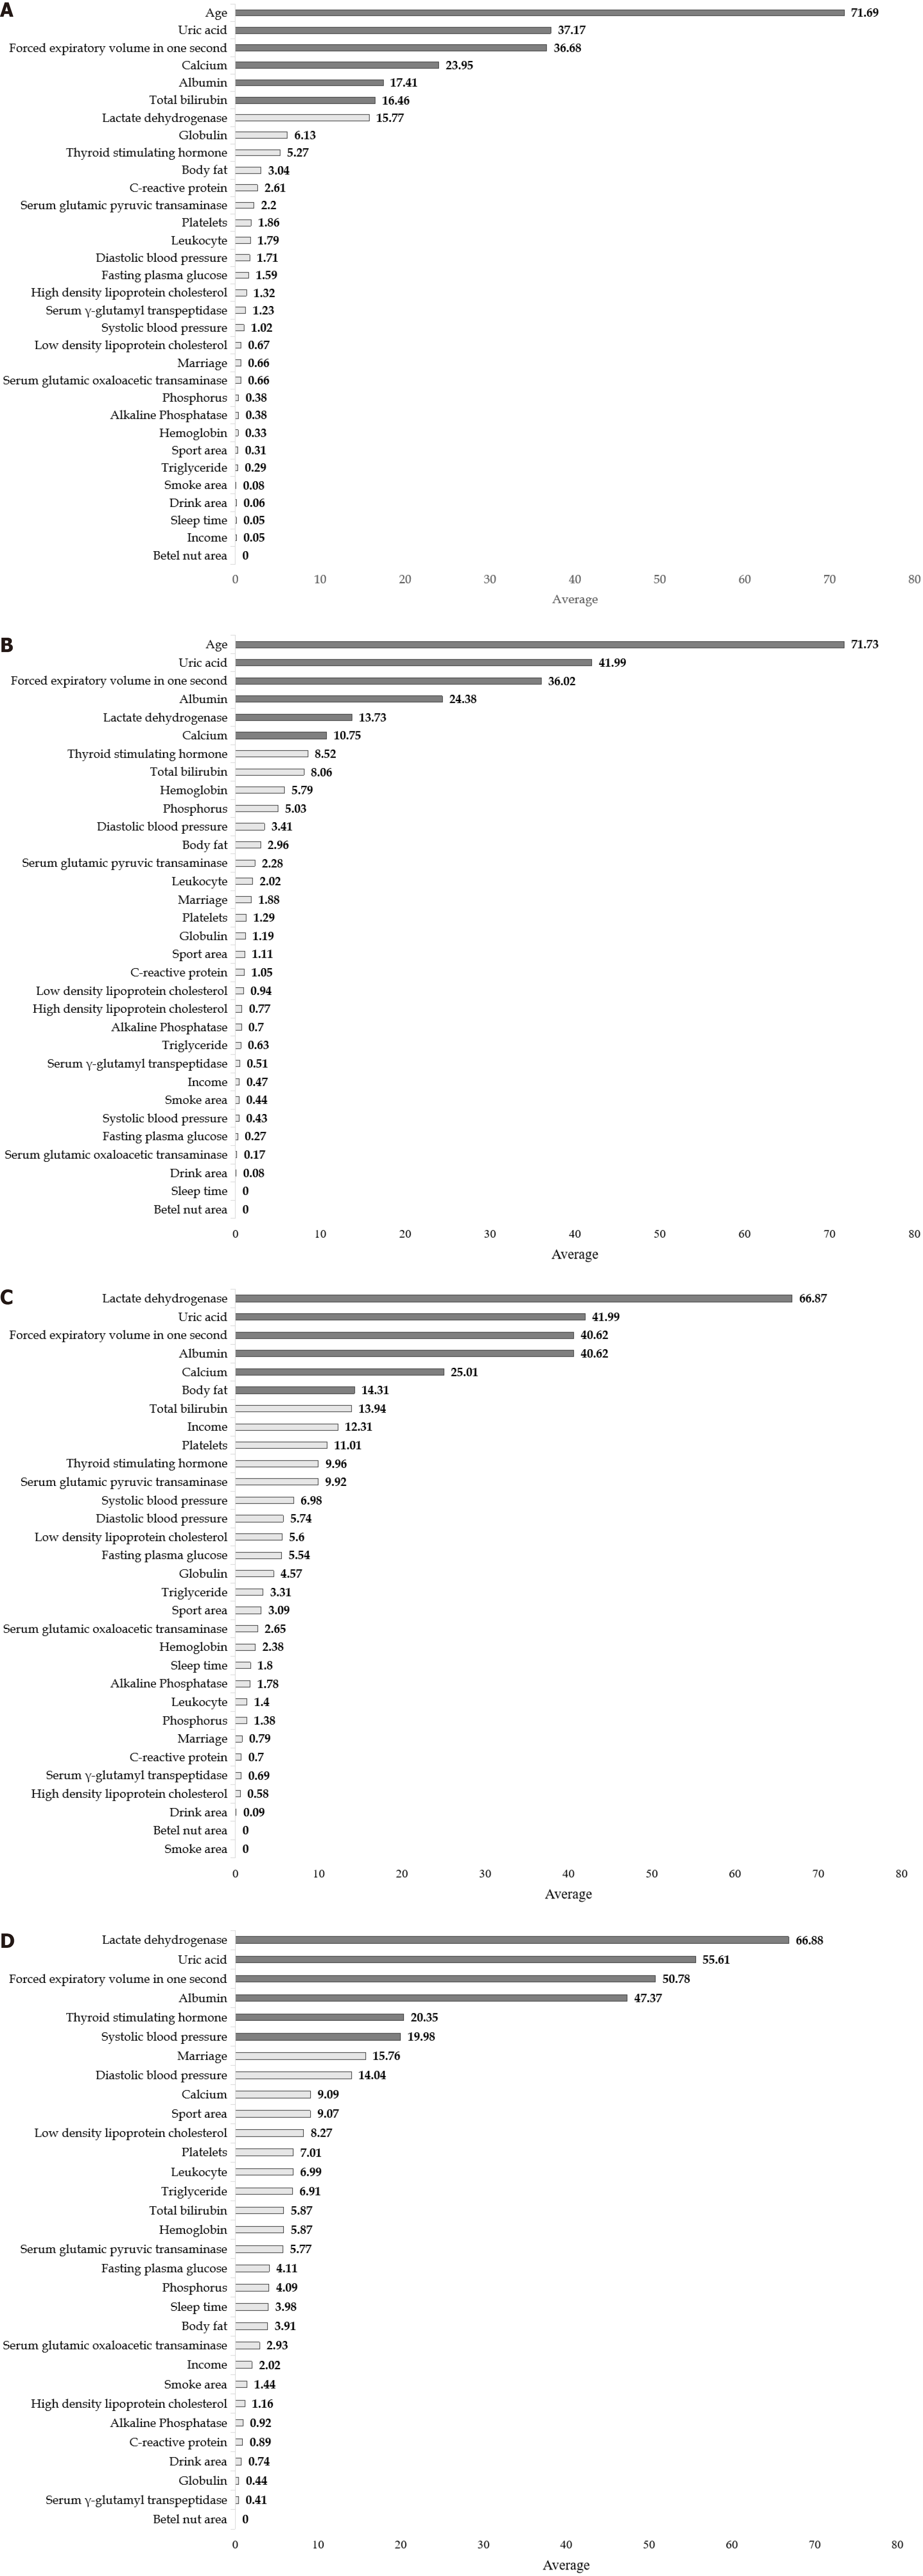
Figure 4 All the orders of the ranks of percentage importance were the same as the results in the tables.
A: The average of the risk factors derived from three different machine learning methods (Model 1, NAFLD+ with age); B: The ranks of the risk factors derived from three different machine learning methods (Model 1, NAFLD- with age); C: The ranks of the risk factors derived from three different machine learning methods (Model 2, NAFLD+ without age); D: The ranks of the risk factors derived from three different machine learning methods (Model 2, NAFLD- without age). NAFLD: Non-alcoholic fatty liver.
- Citation: Chen IC, Chou LJ, Huang SC, Chu TW, Lee SS. Machine learning-based comparison of factors influencing estimated glomerular filtration rate in Chinese women with or without non-alcoholic fatty liver. World J Clin Cases 2024; 12(15): 2506-2521
- URL: https://www.wjgnet.com/2307-8960/full/v12/i15/2506.htm
- DOI: https://dx.doi.org/10.12998/wjcc.v12.i15.2506


