Copyright
©The Author(s) 2024.
World J Clin Cases. May 6, 2024; 12(13): 2182-2193
Published online May 6, 2024. doi: 10.12998/wjcc.v12.i13.2182
Published online May 6, 2024. doi: 10.12998/wjcc.v12.i13.2182
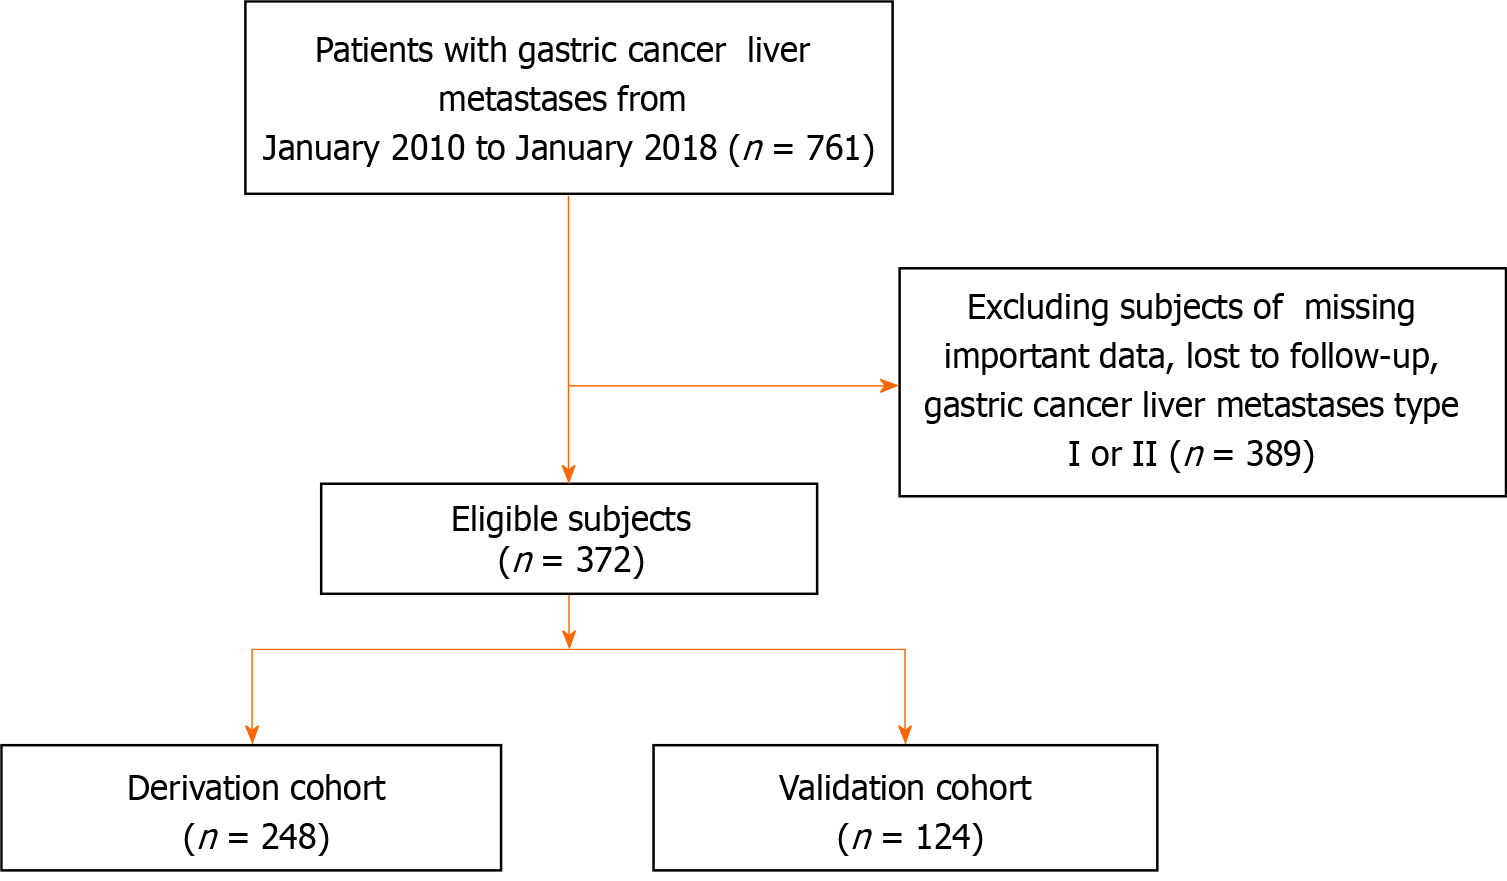
Figure 1 Flow chart of study.
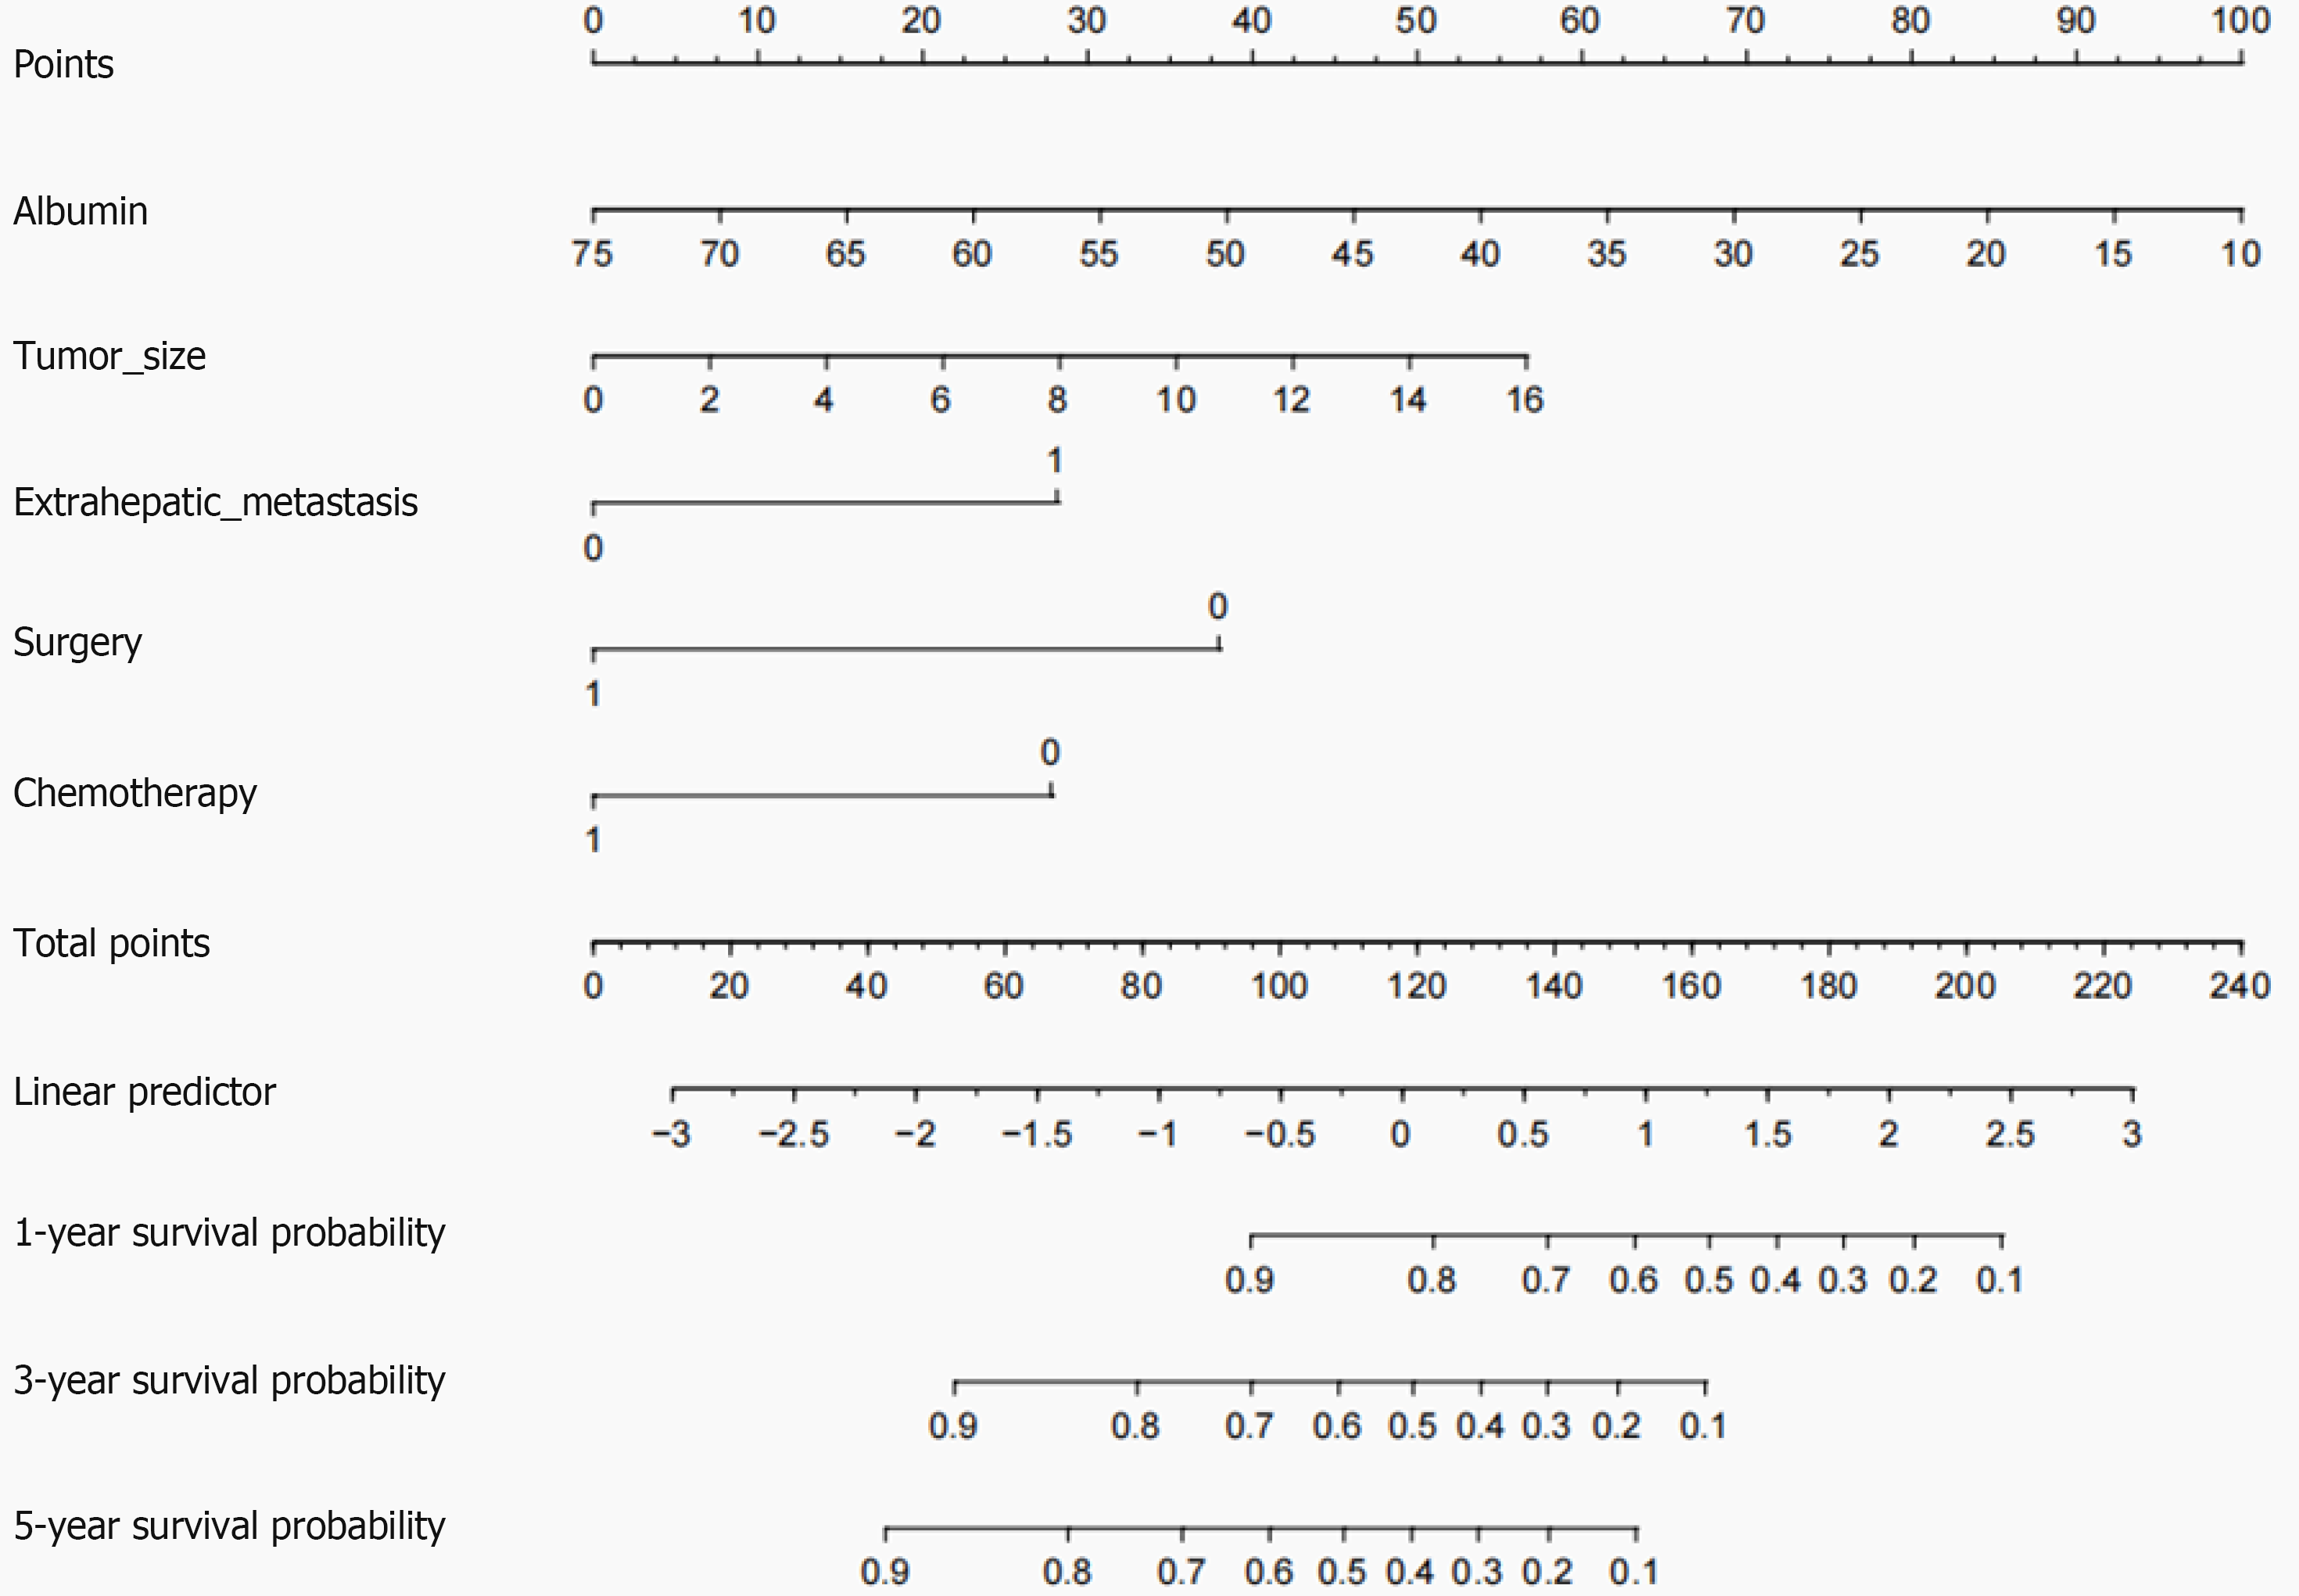
Figure 2 A nomogram model for predicting 1-, 3- and 5-yr overall survival in patients with Chinese type for gastric cancer liver meta
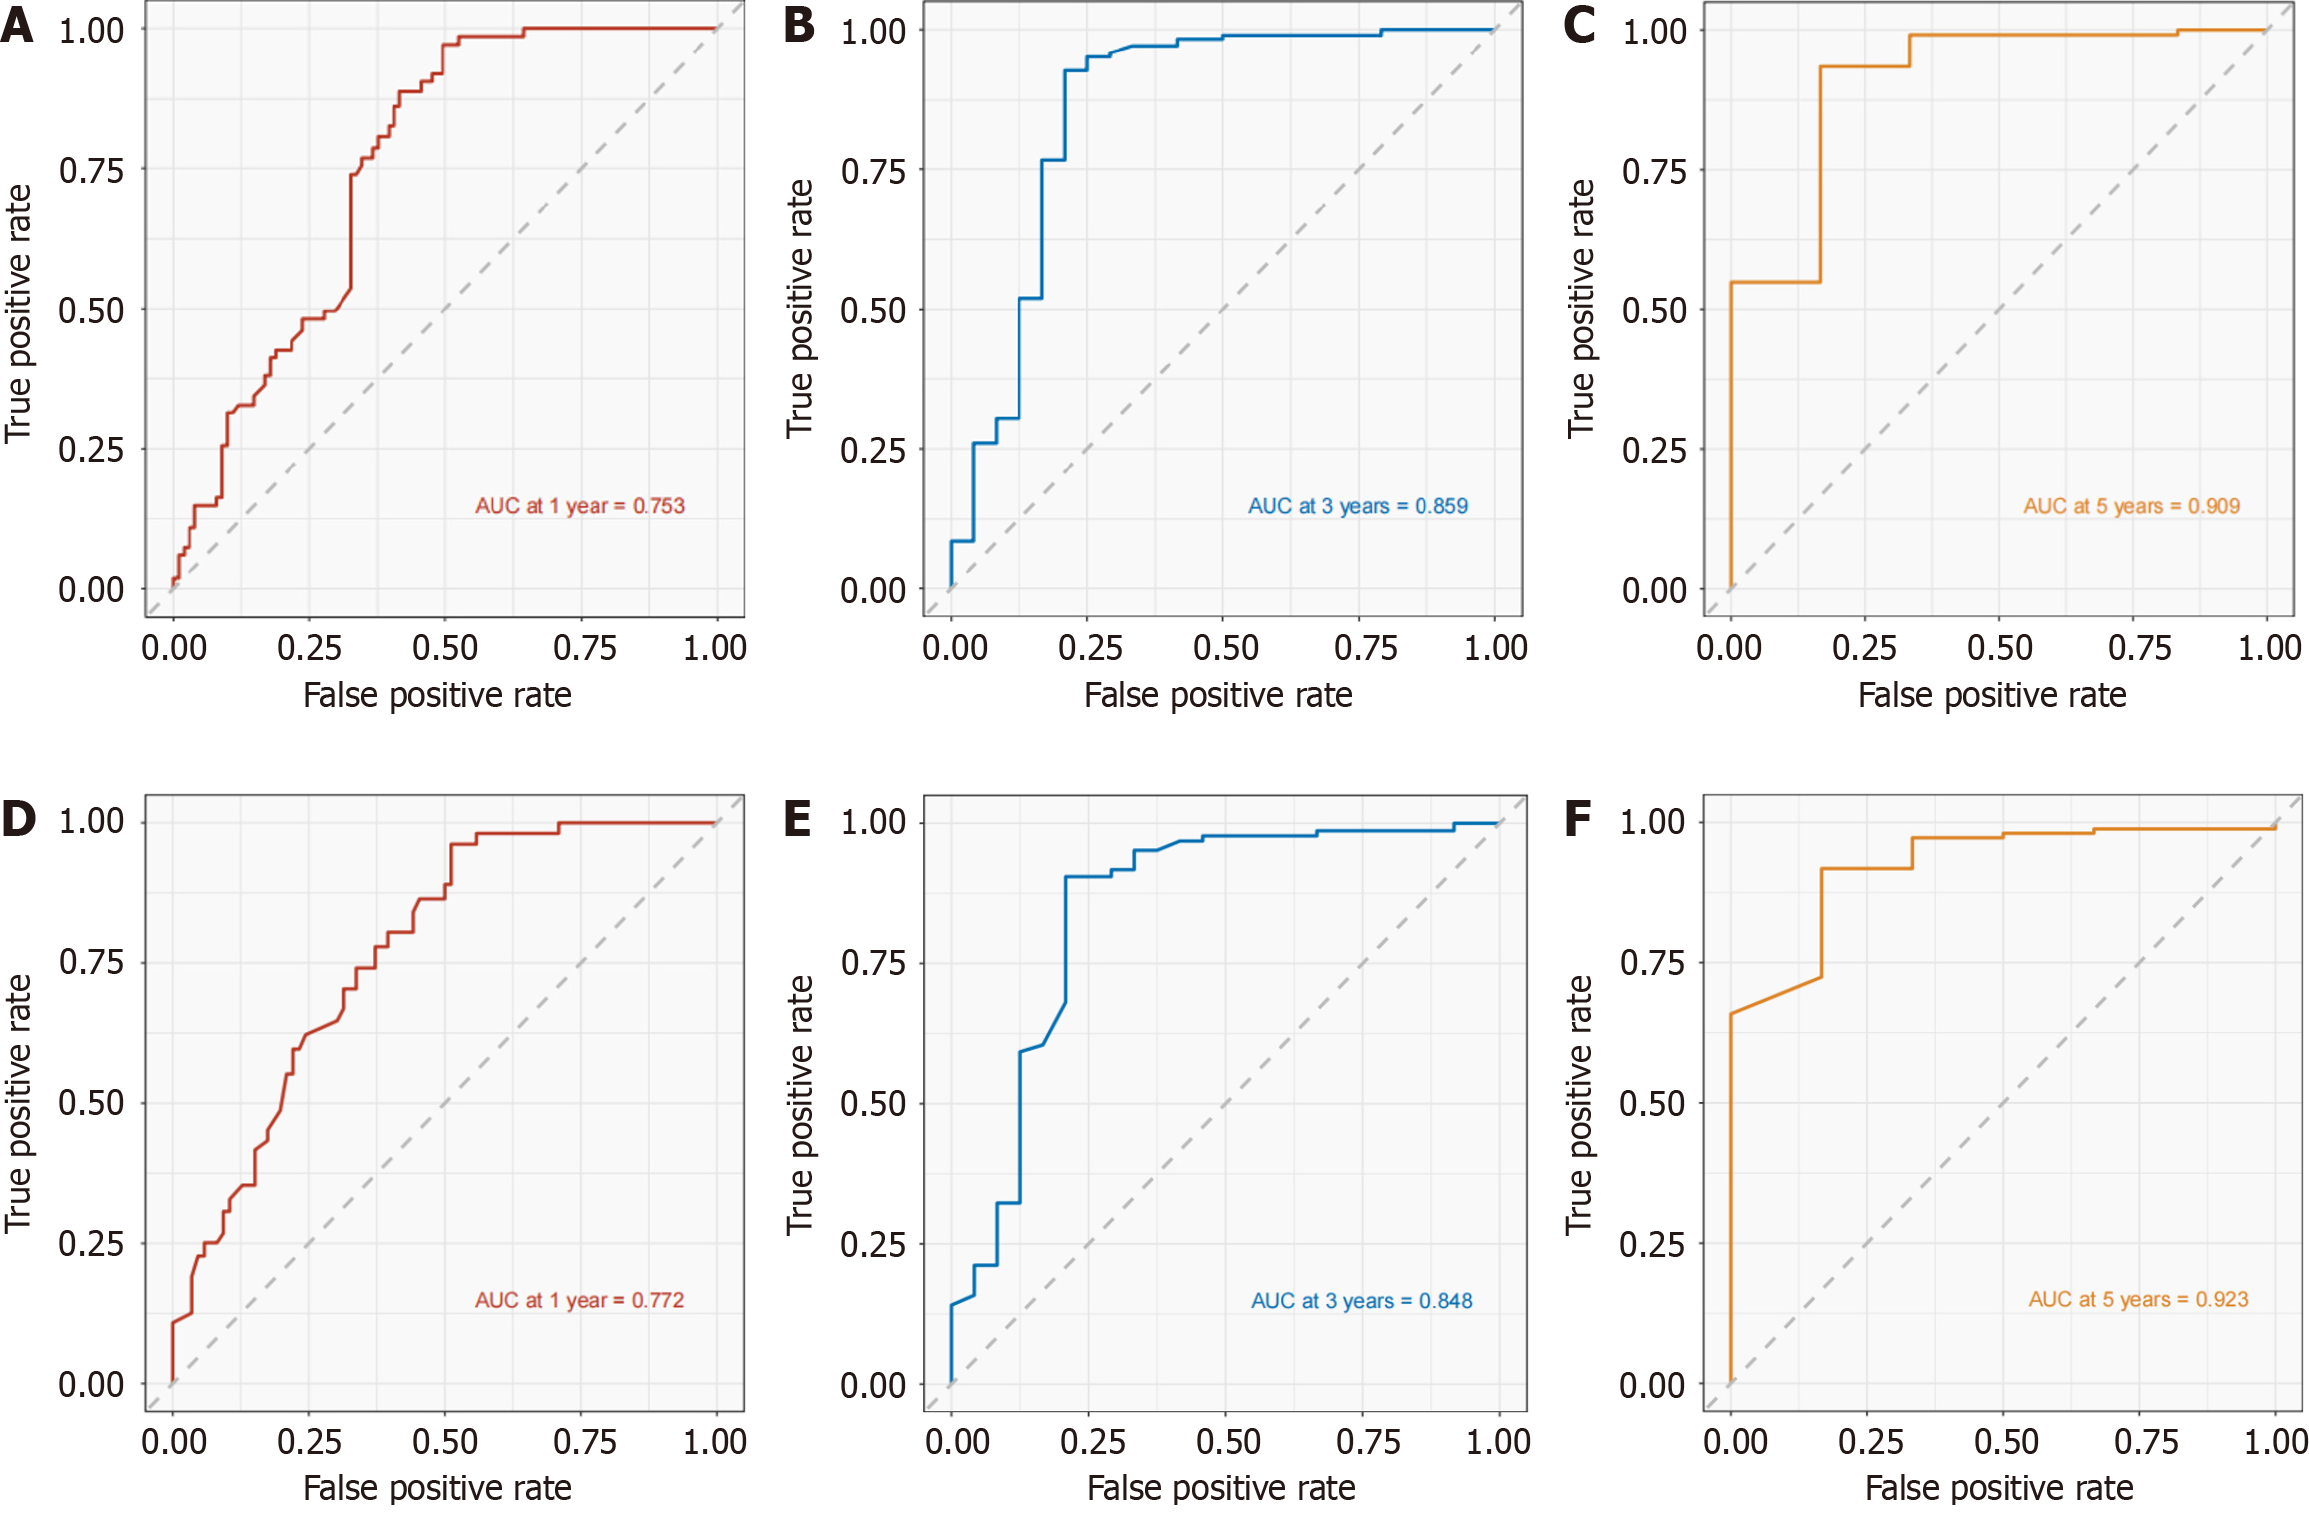
Figure 3 Area under the receiver operating curve for development cohort and validation cohort.
A-C: Area under the receiver operating curve (AUC) of 1-, 3-, and 5-yr prognostic models for Chinese type for gastric cancer liver metastases (C-GCLM) type III patients in the developed cohort; D-F: AUC of the 1-, 3-, and 5-yr prognostic models of C-GCLM type III patients in the validation cohort.
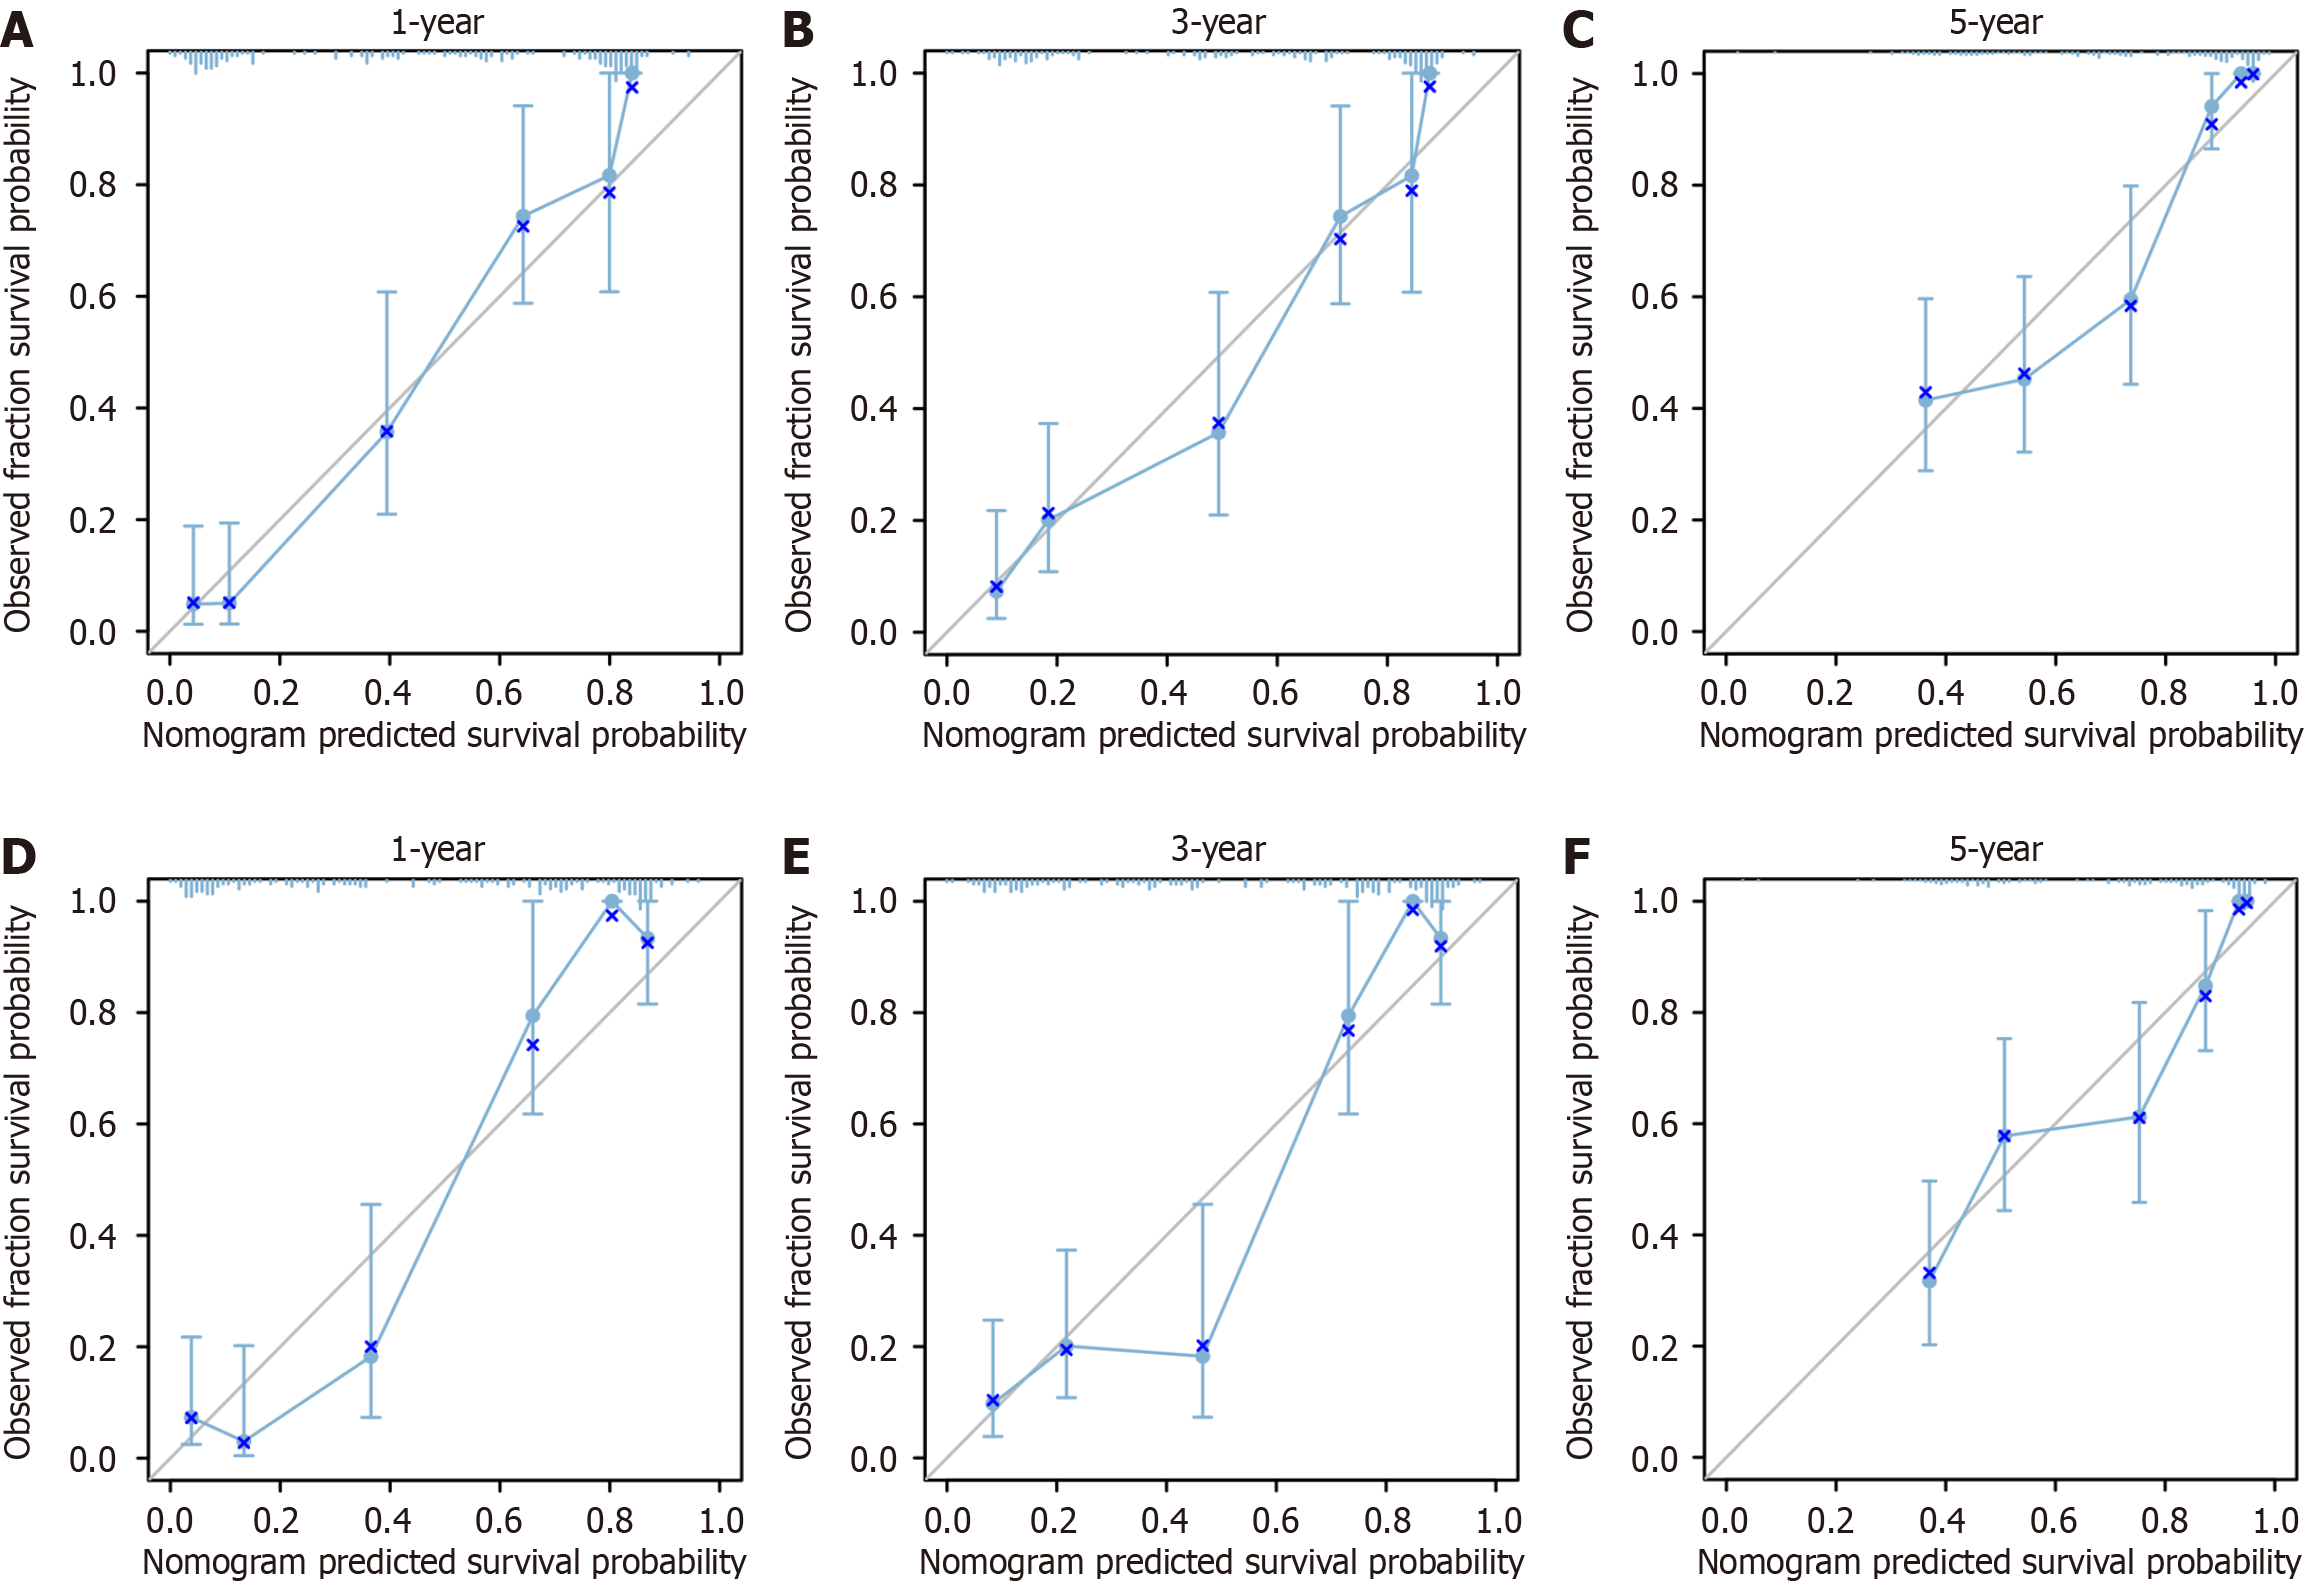
Figure 4 Calibration curves for development cohort andvalidation cohort.
A-C: Calibration curves of 1-, 3-, and 5-yr prognostic models for Chinese type for gastric cancer liver metastases (C-GCLM) type III patients in the development cohort; D-F: Validate the calibration curve of the 1-, 3-, and 5-yr prognostic models for C-GCLM type III patients in the validation cohort.
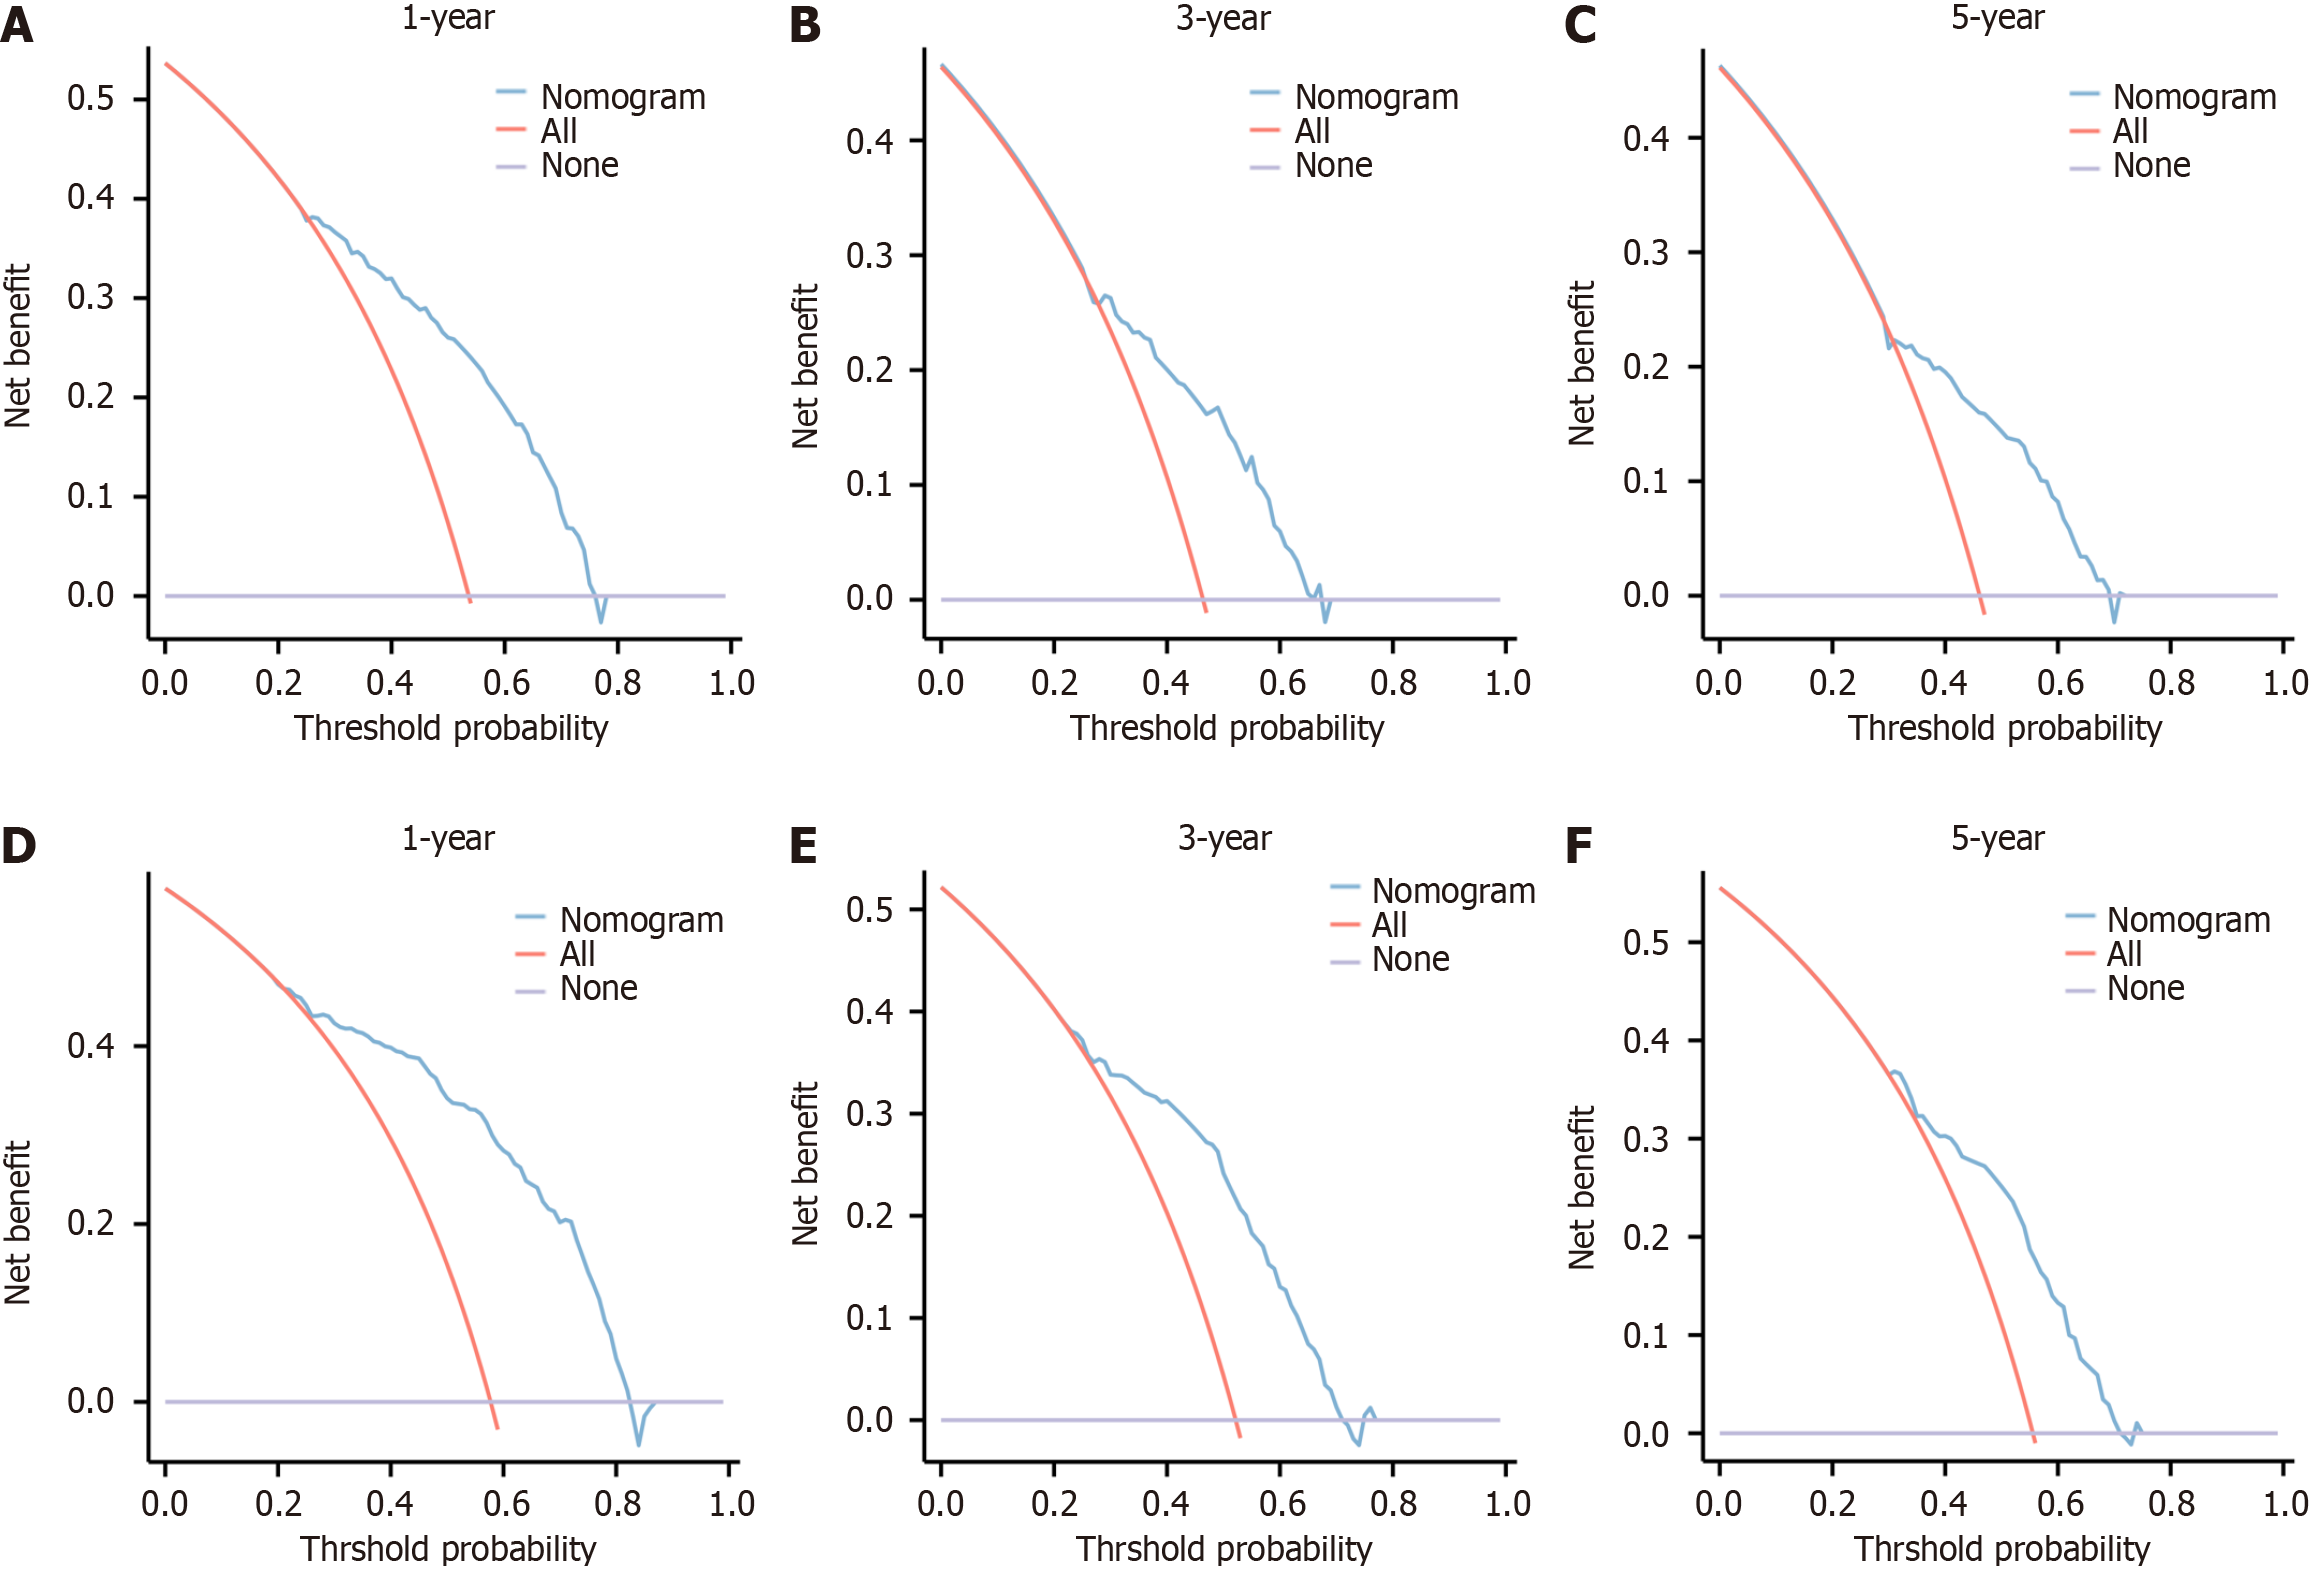
Figure 5 Decision analysis curves for development cohort and validation cohort.
A-C: Decision analysis curves (DAC) of 1-, 3-, and 5-yr prognostic models for Chinese type for gastric cancer liver metastases (C-GCLM) type III patients in the development cohort; D-F: DAC of 1-, 3- and 5-yr prognostic models for C-GCLM type III patients in the validation cohort.
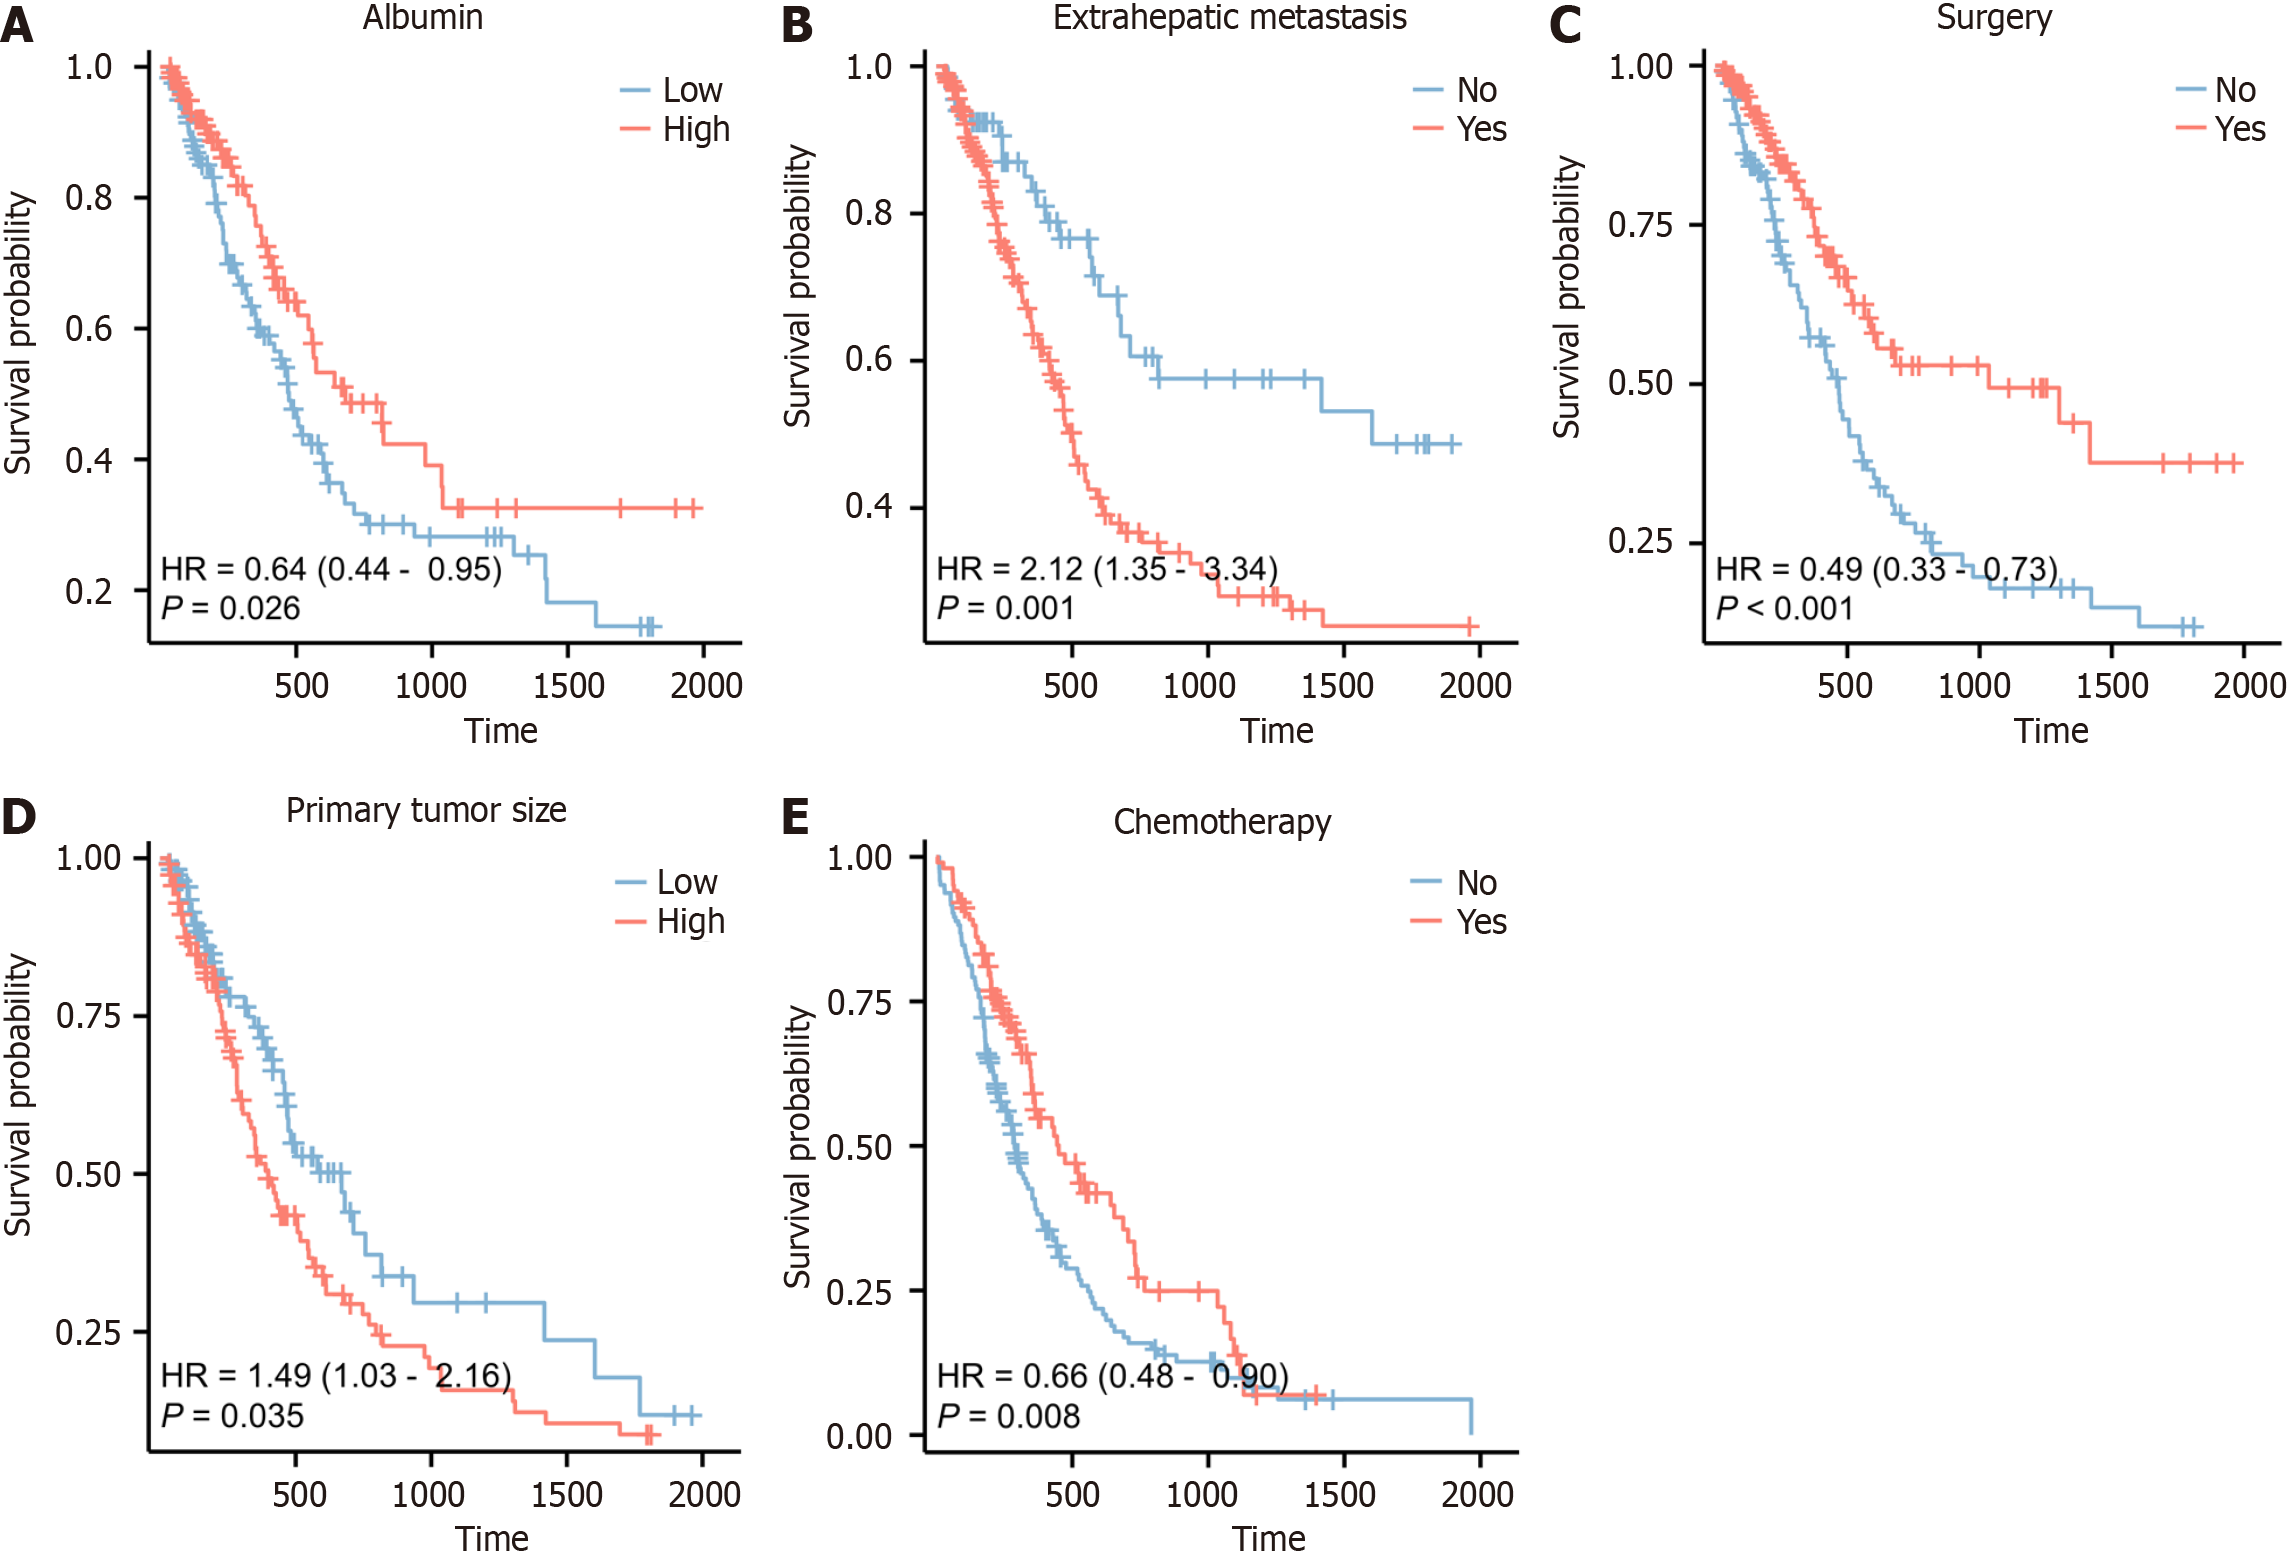
Figure 6 Kaplan-Meier survival curves for each predictor.
A: Albumin; B: Extrahepatic metastases; C: Surgery; D: Tumor size; E: Chemotherapy.
- Citation: Chang ZY, Gao WX, Zhang Y, Zhao W, Wu D, Chen L. Establishment and evaluation of a prognostic model for patients with unresectable gastric cancer liver metastases. World J Clin Cases 2024; 12(13): 2182-2193
- URL: https://www.wjgnet.com/2307-8960/full/v12/i13/2182.htm
- DOI: https://dx.doi.org/10.12998/wjcc.v12.i13.2182


