Copyright
©The Author(s) 2024.
World J Clin Cases. Apr 26, 2024; 12(12): 2056-2064
Published online Apr 26, 2024. doi: 10.12998/wjcc.v12.i12.2056
Published online Apr 26, 2024. doi: 10.12998/wjcc.v12.i12.2056
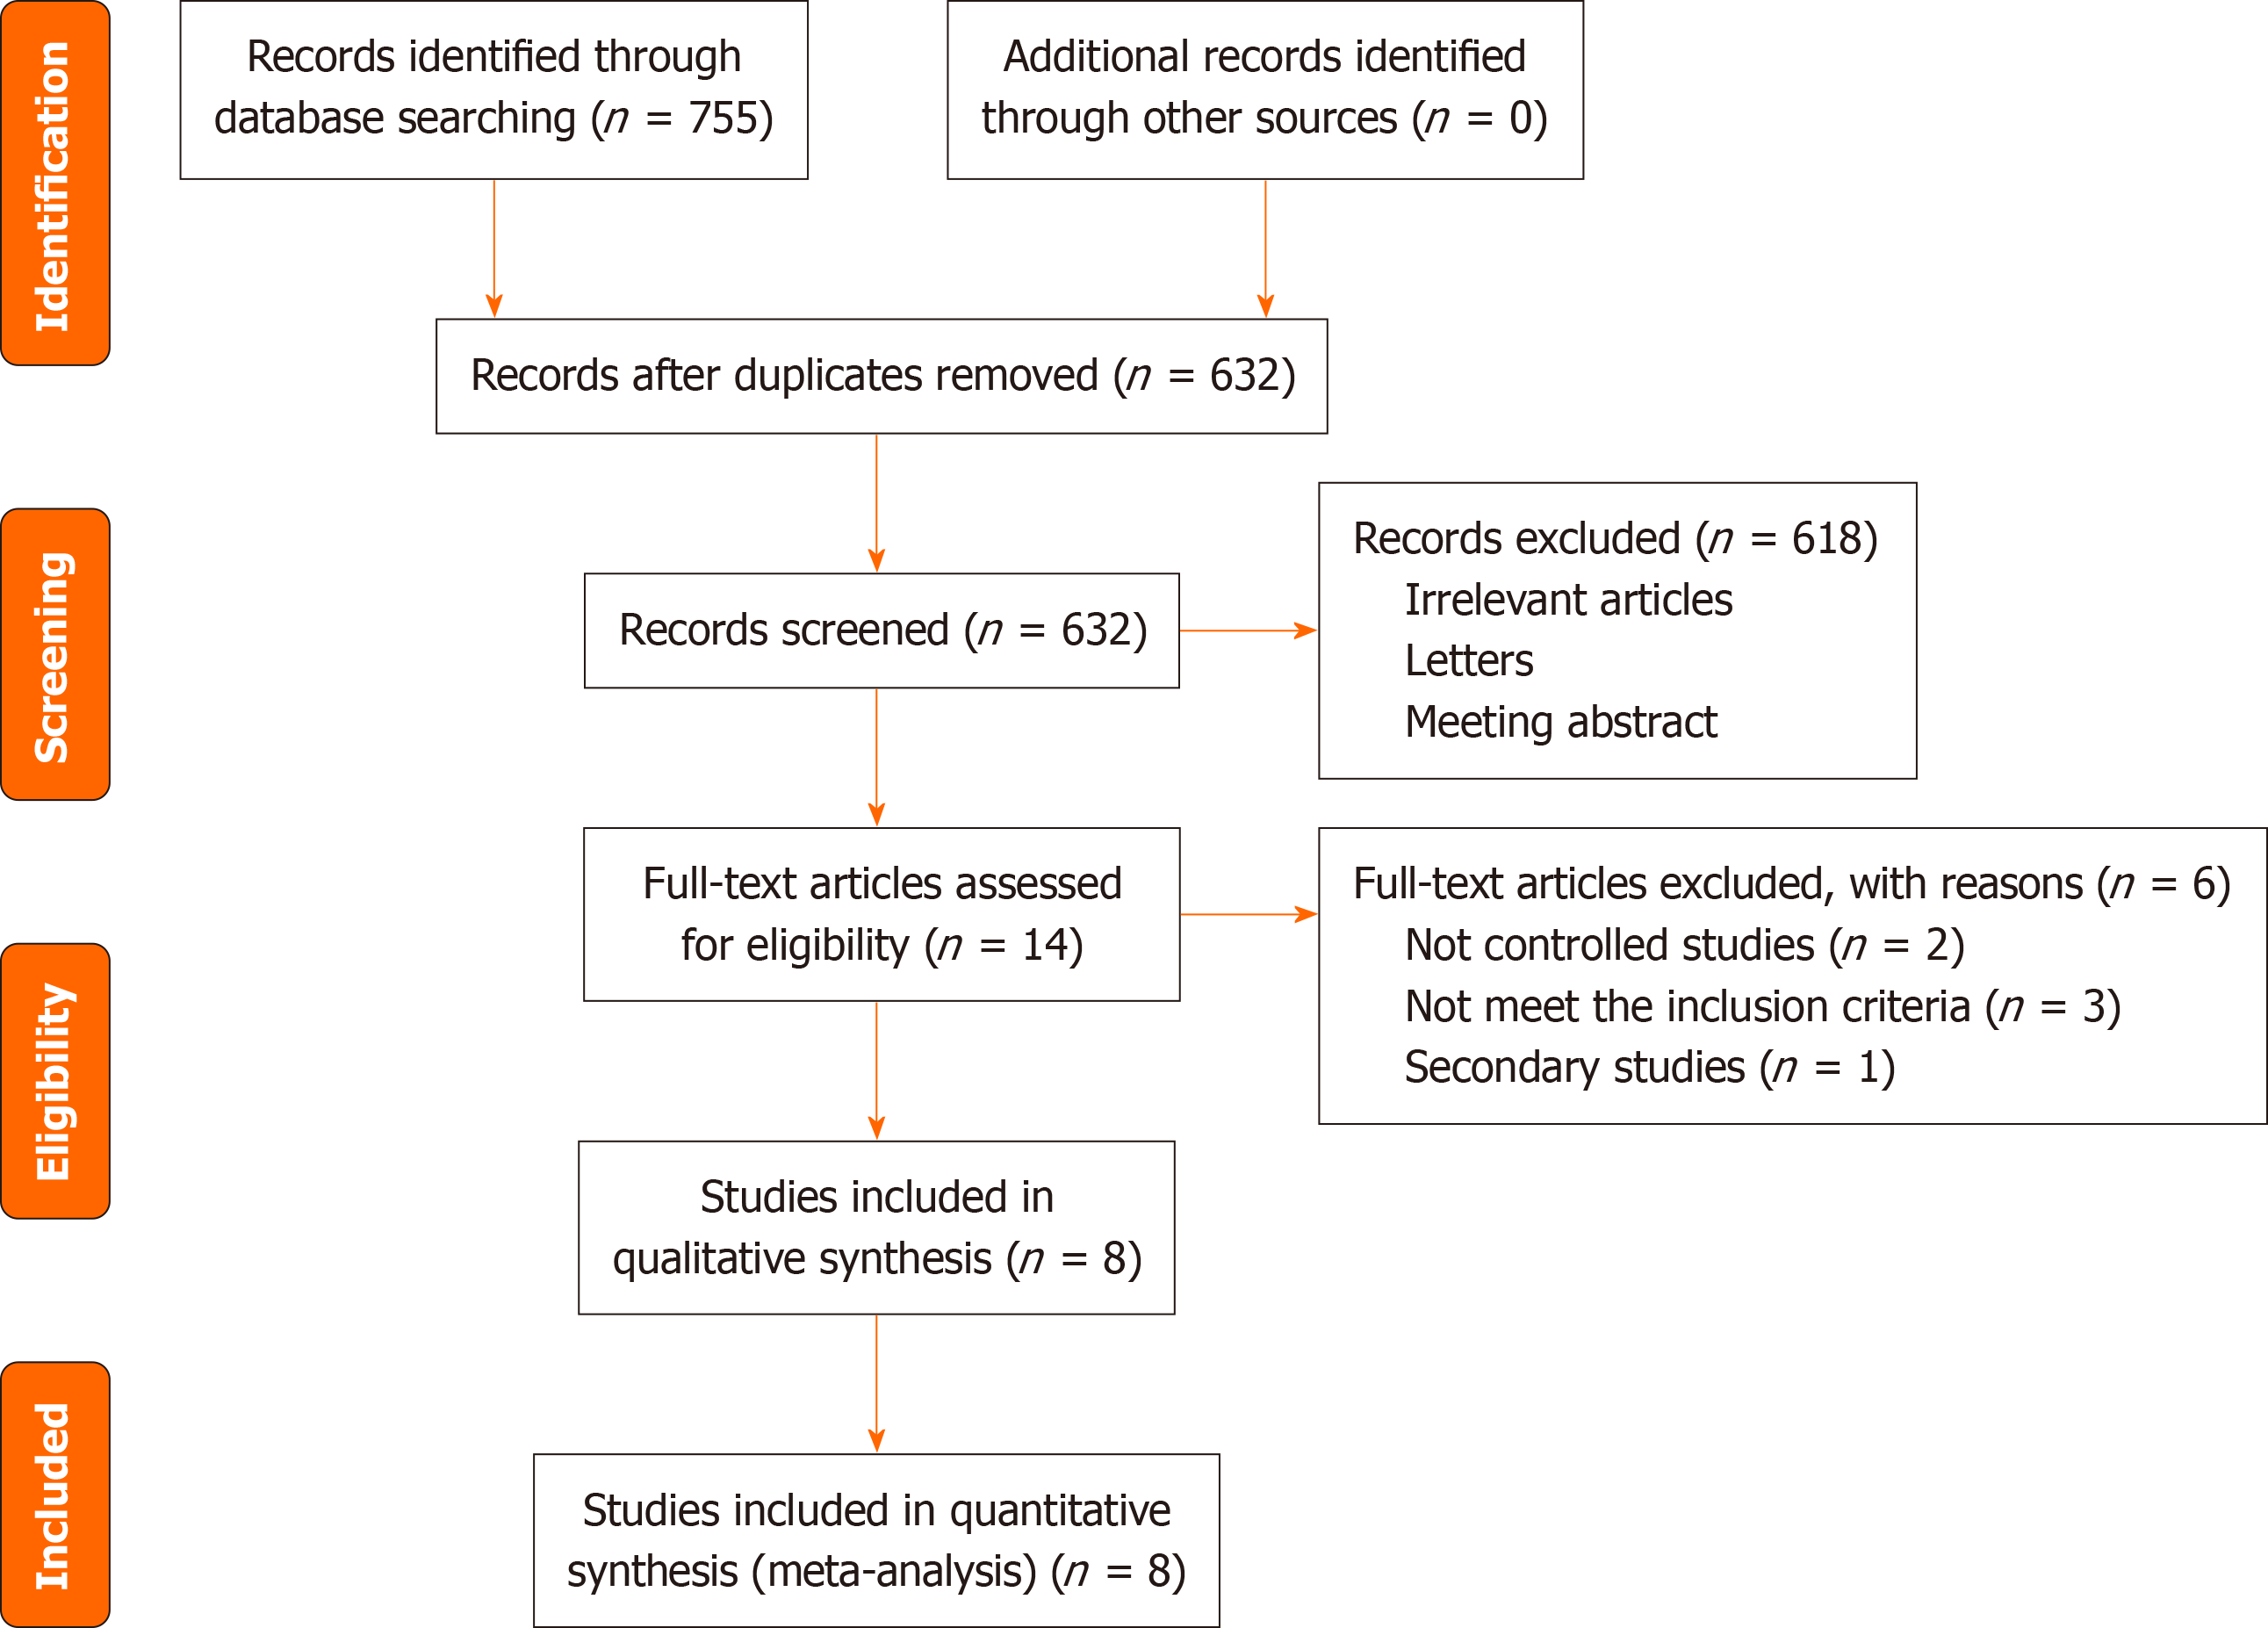
Figure 1 Literature review flow-chart.
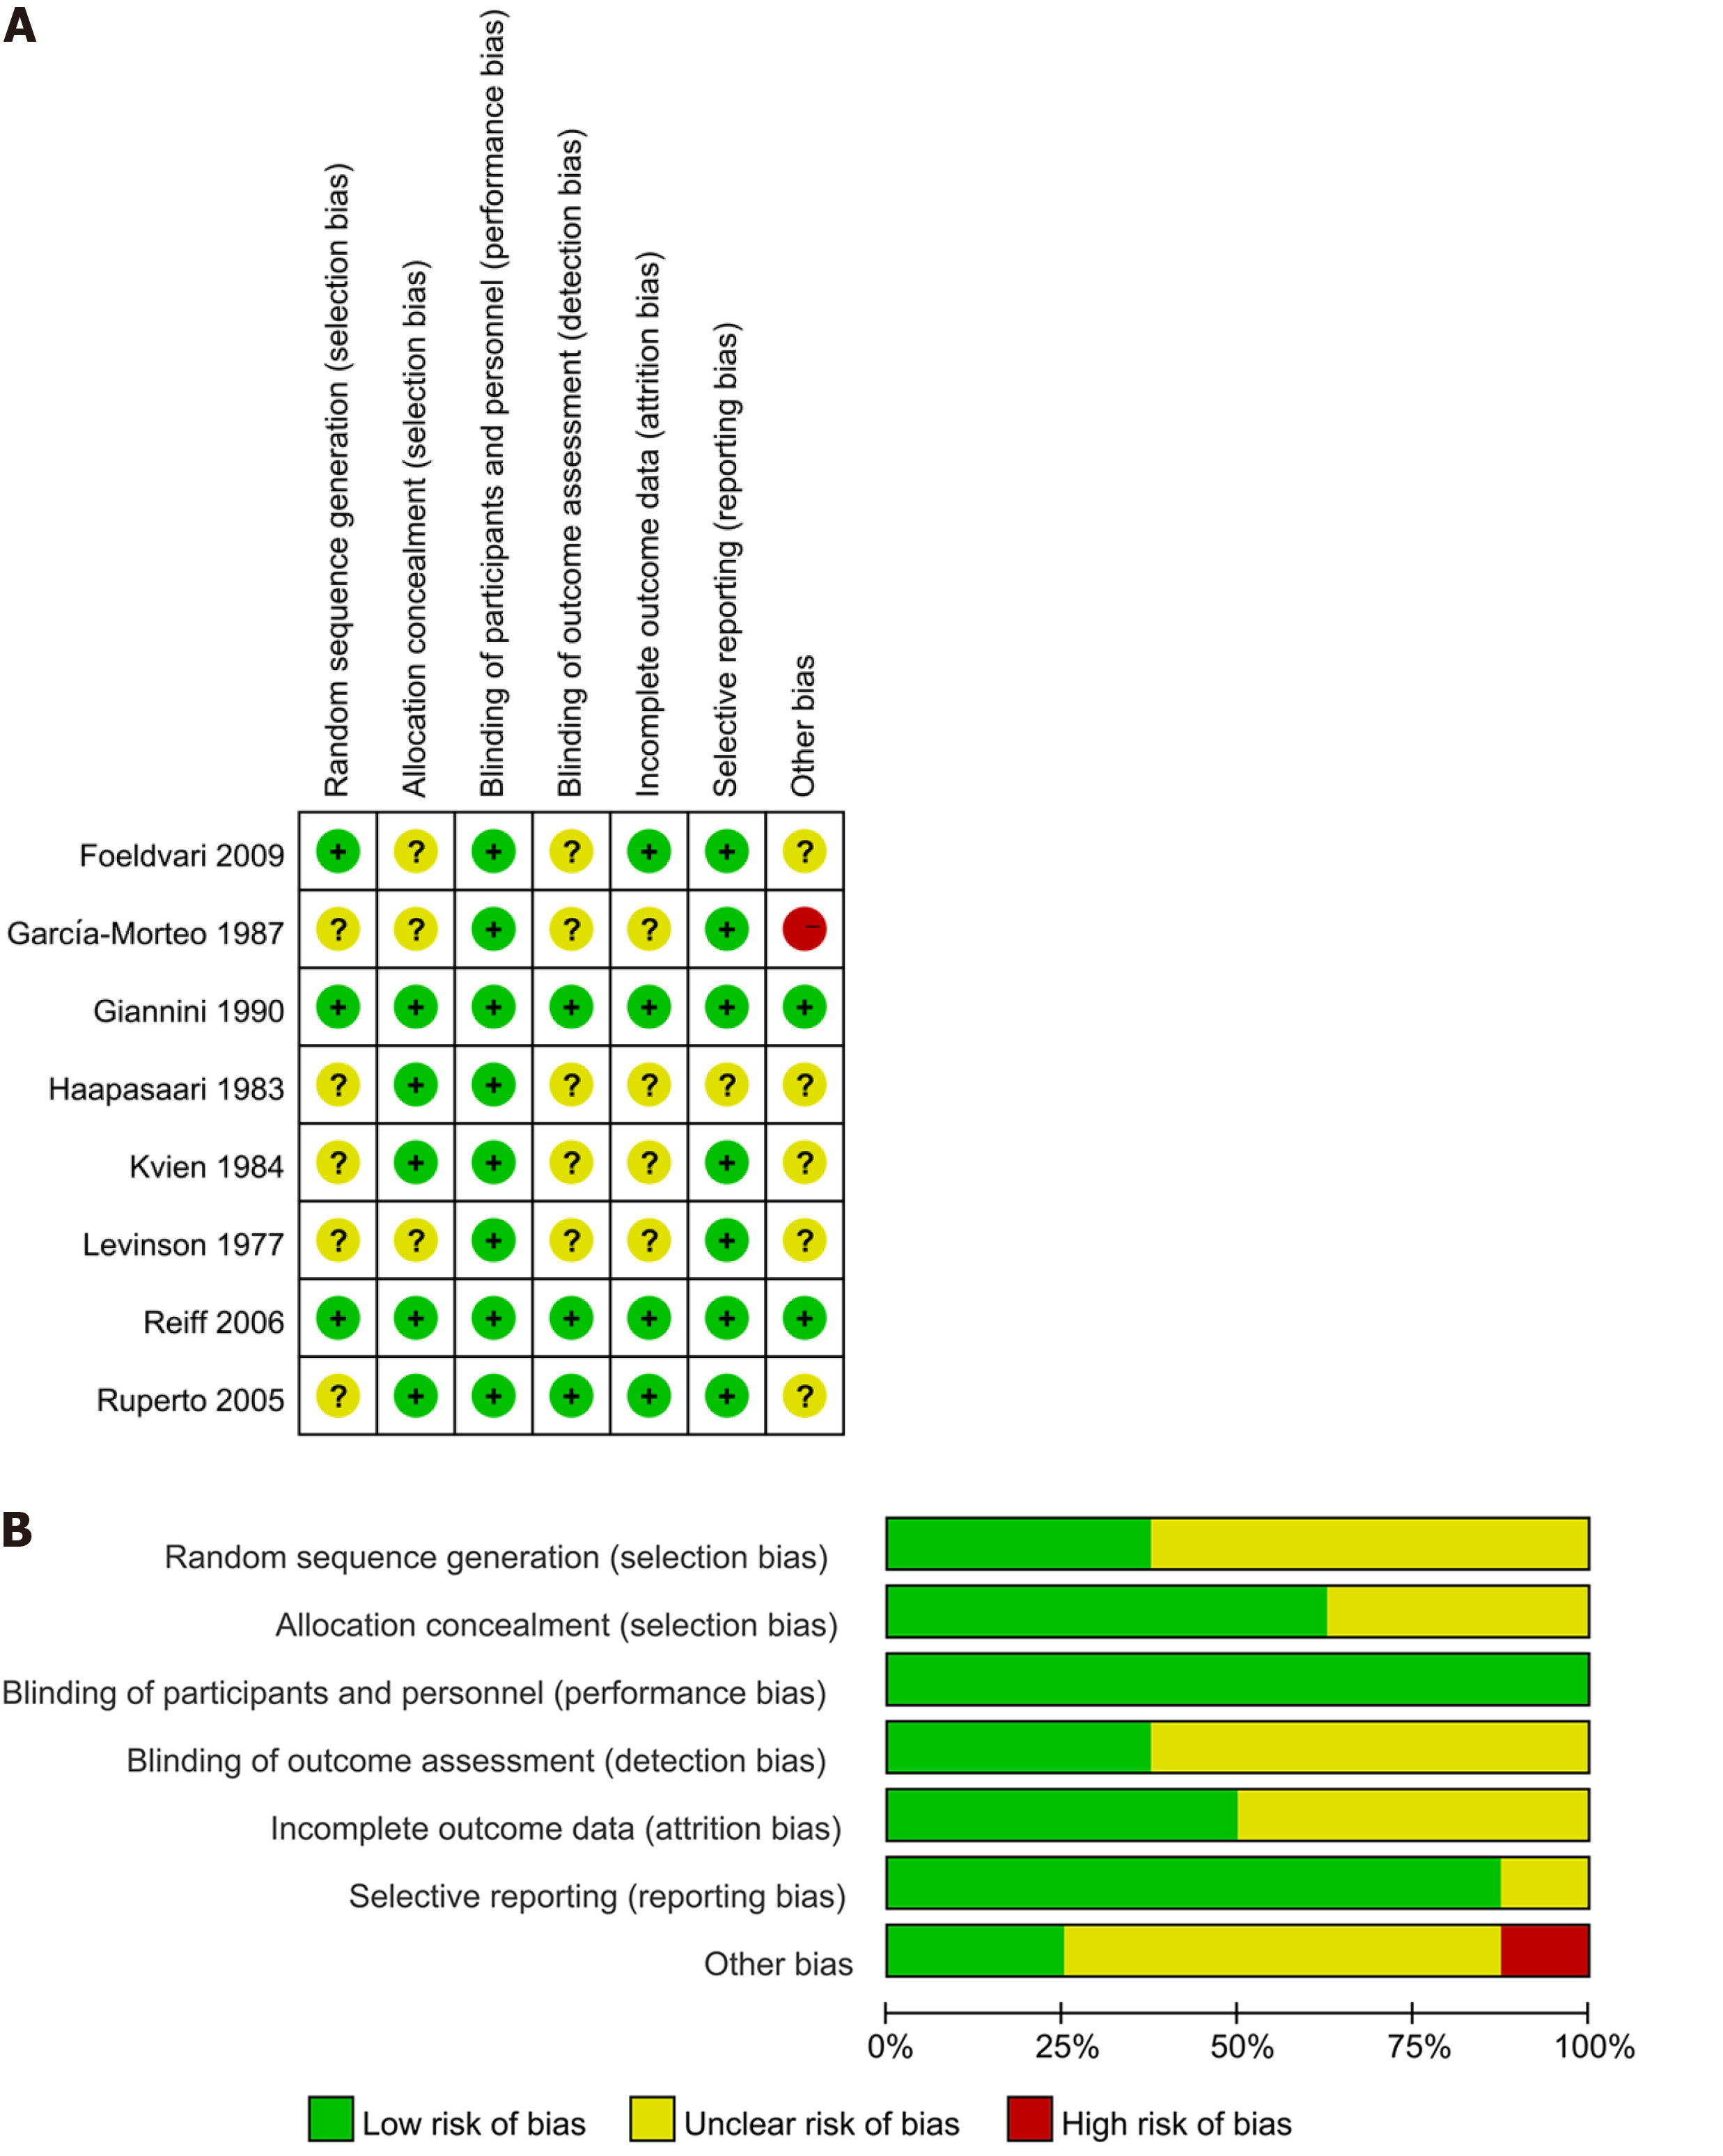
Figure 2 Risk of bias summary and bias graph.
A: Risk of bias summary; B: Risk of bias graph.
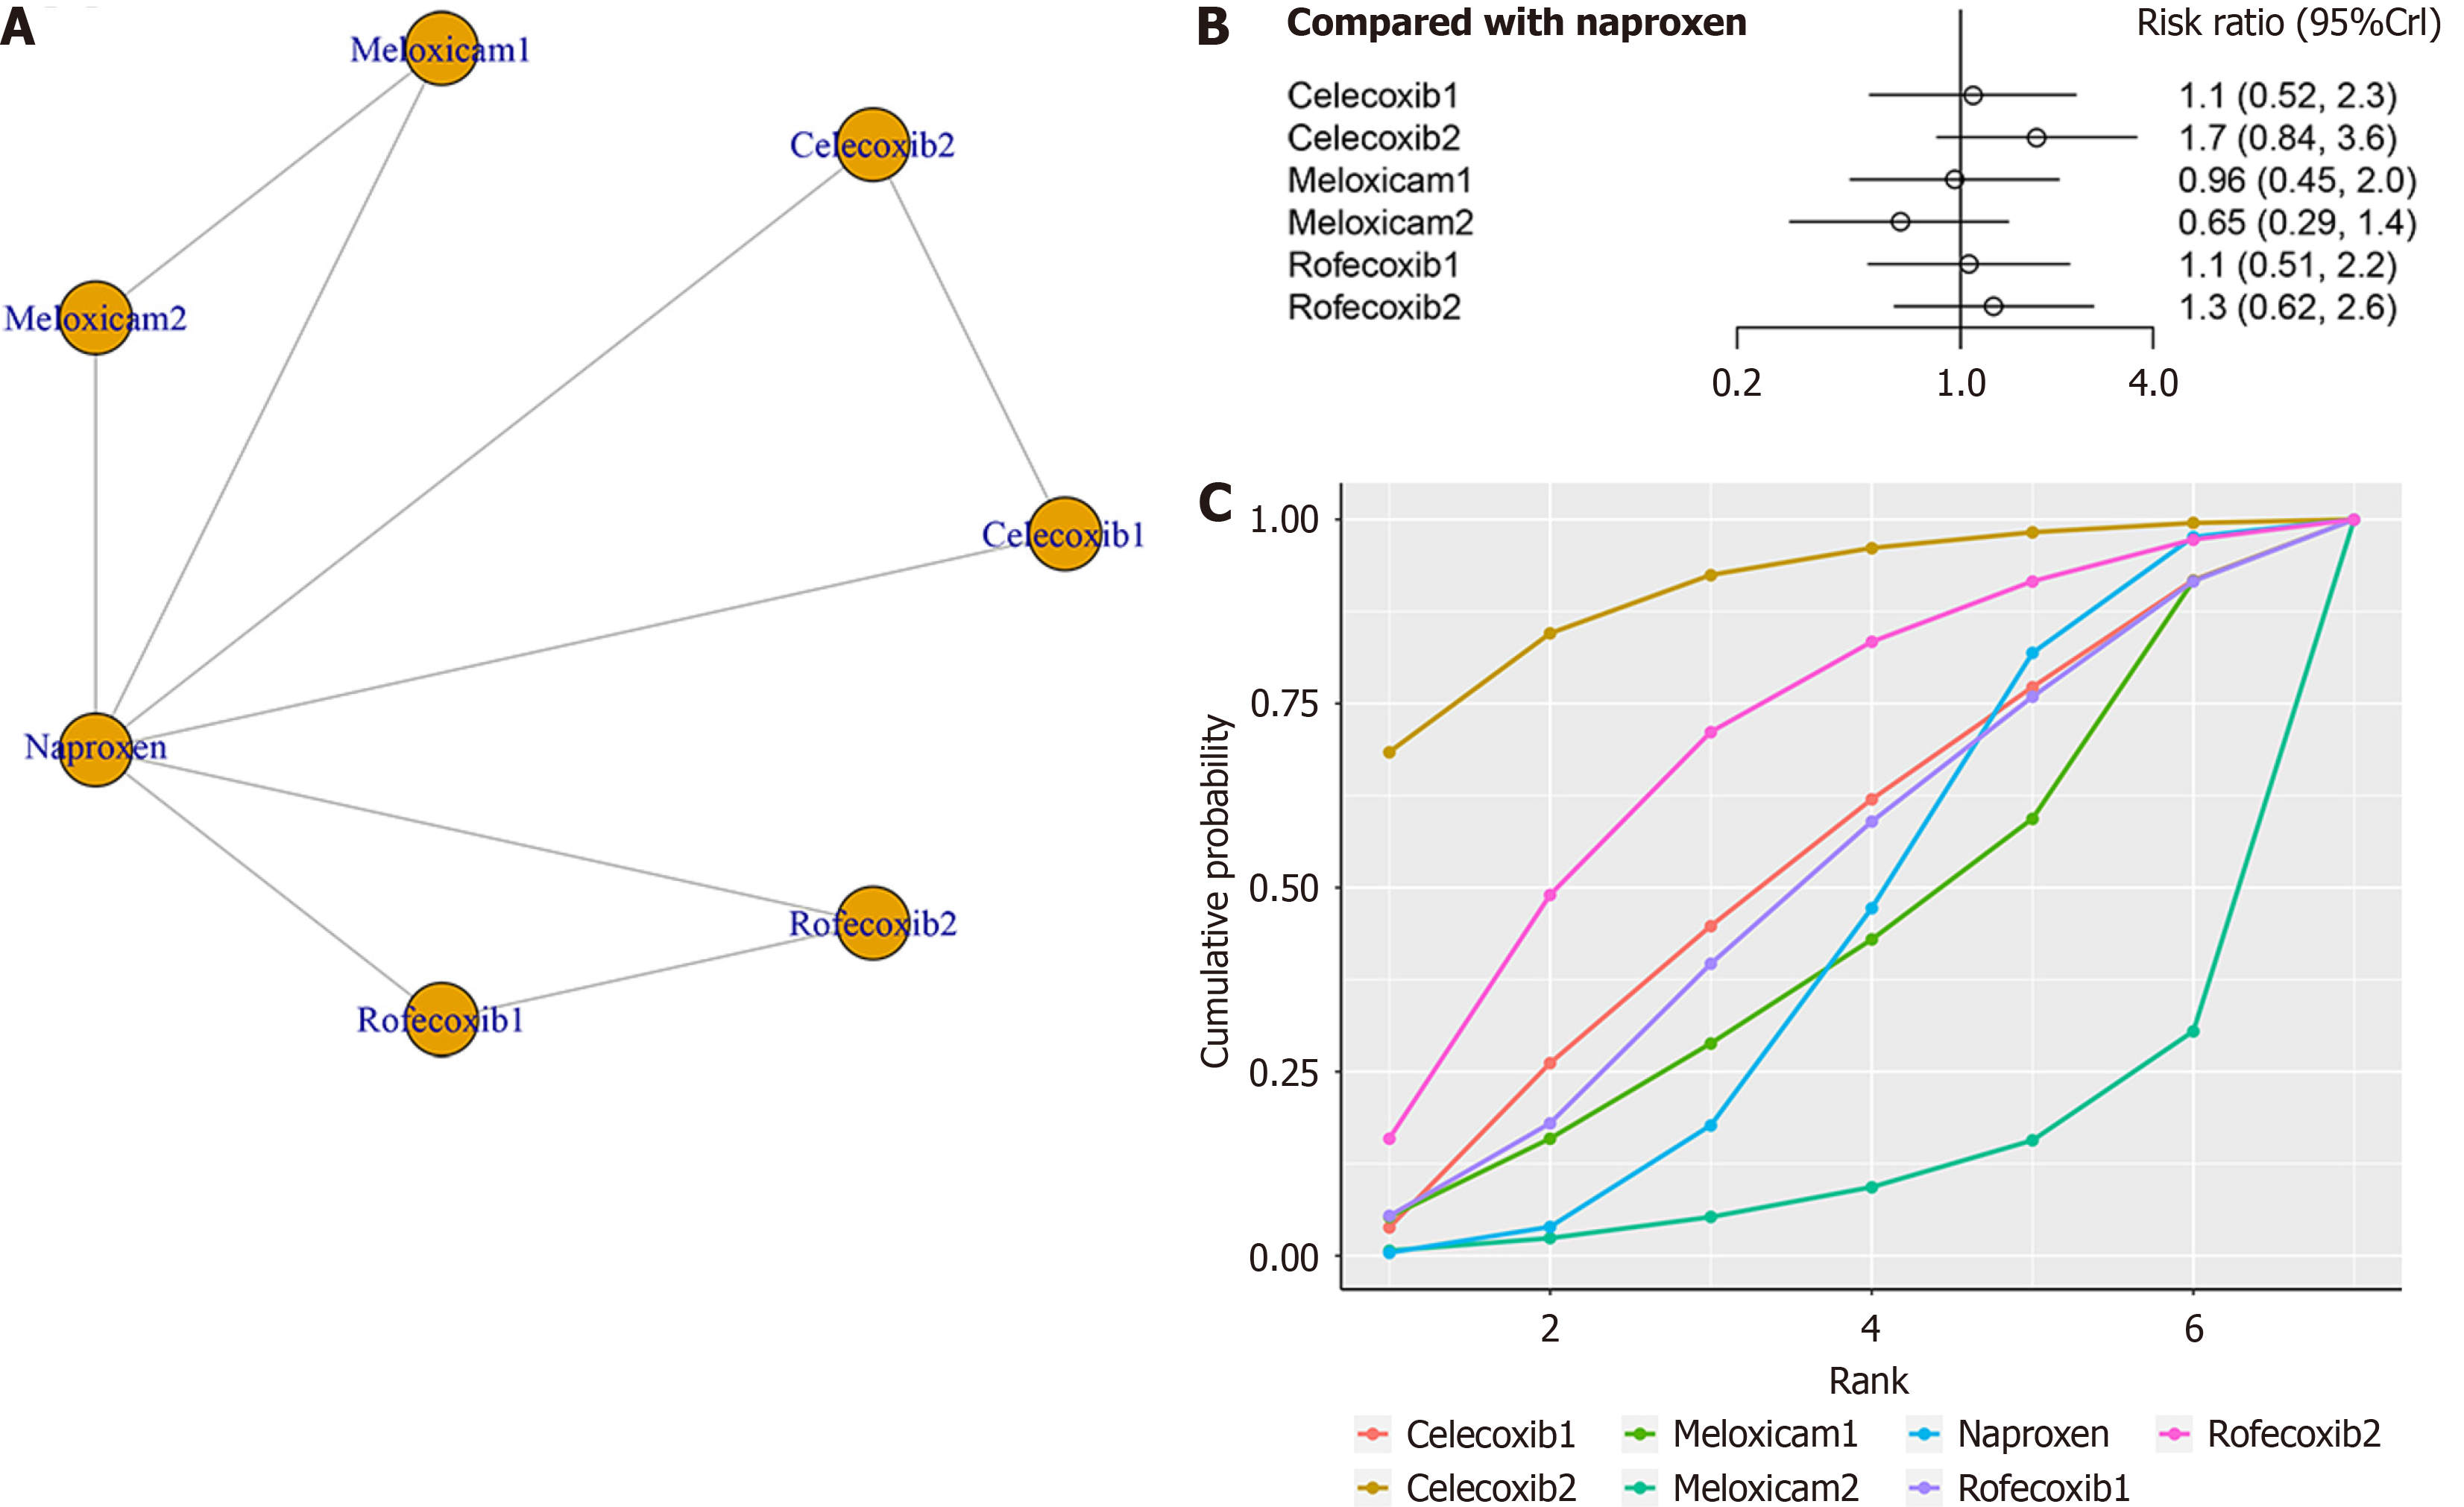
Figure 3 ACR Pedi 30 response.
A: The network of evidence of all the trials for ACR Pedi 30 response; B: Forest plot comparing different treatment with naproxen for need for ACR Pedi 30 response; C: Surface under the cumulative ranking curve values of different treatment for need for ACR Pedi 30 response.
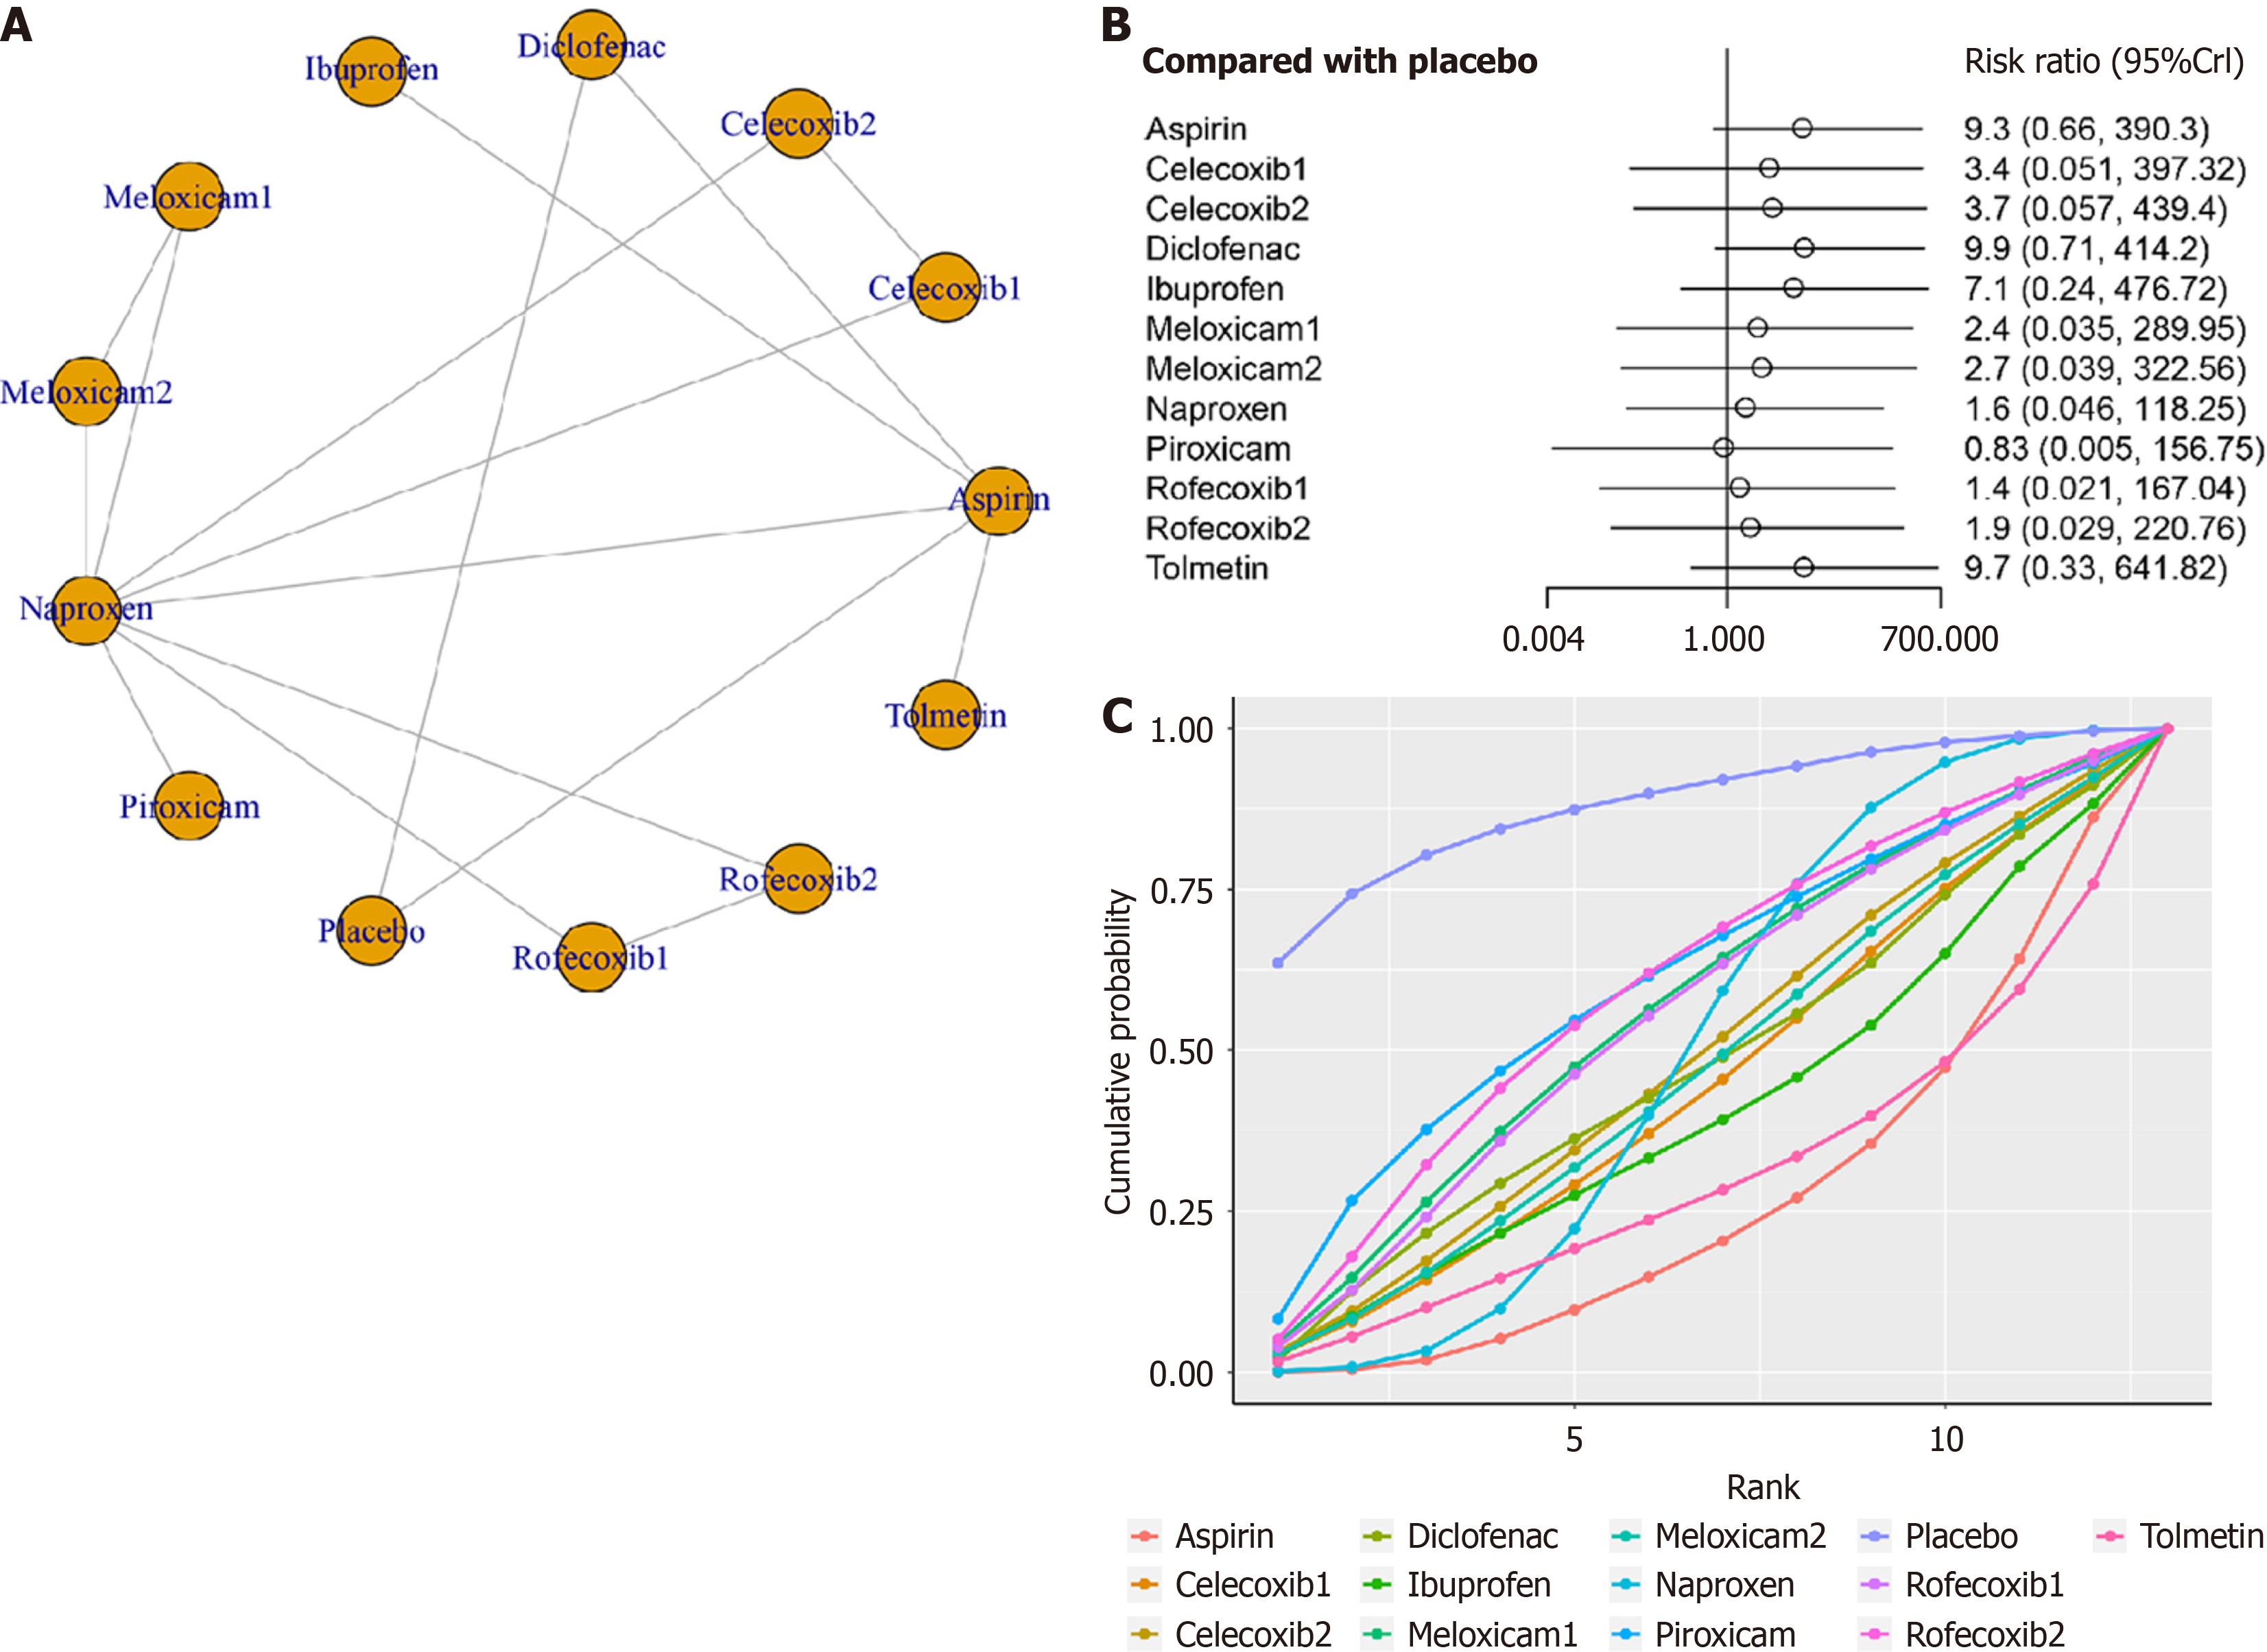
Figure 4 Adverse events.
A: The network of evidence of all the trials for adverse events; B: Forest plot comparing different treatment with placebo for need for adverse events; C: Surface under the cumulative ranking curve values of different treatment for need for adverse events.
- Citation: Zeng T, Ye JZ, Qin H, Xu QQ. Systematic review and network meta-analysis of different non-steroidal anti-inflammatory drugs for juvenile idiopathic arthritis. World J Clin Cases 2024; 12(12): 2056-2064
- URL: https://www.wjgnet.com/2307-8960/full/v12/i12/2056.htm
- DOI: https://dx.doi.org/10.12998/wjcc.v12.i12.2056


