Copyright
©The Author(s) 2024.
World J Clin Cases. Jan 6, 2024; 12(1): 95-106
Published online Jan 6, 2024. doi: 10.12998/wjcc.v12.i1.95
Published online Jan 6, 2024. doi: 10.12998/wjcc.v12.i1.95
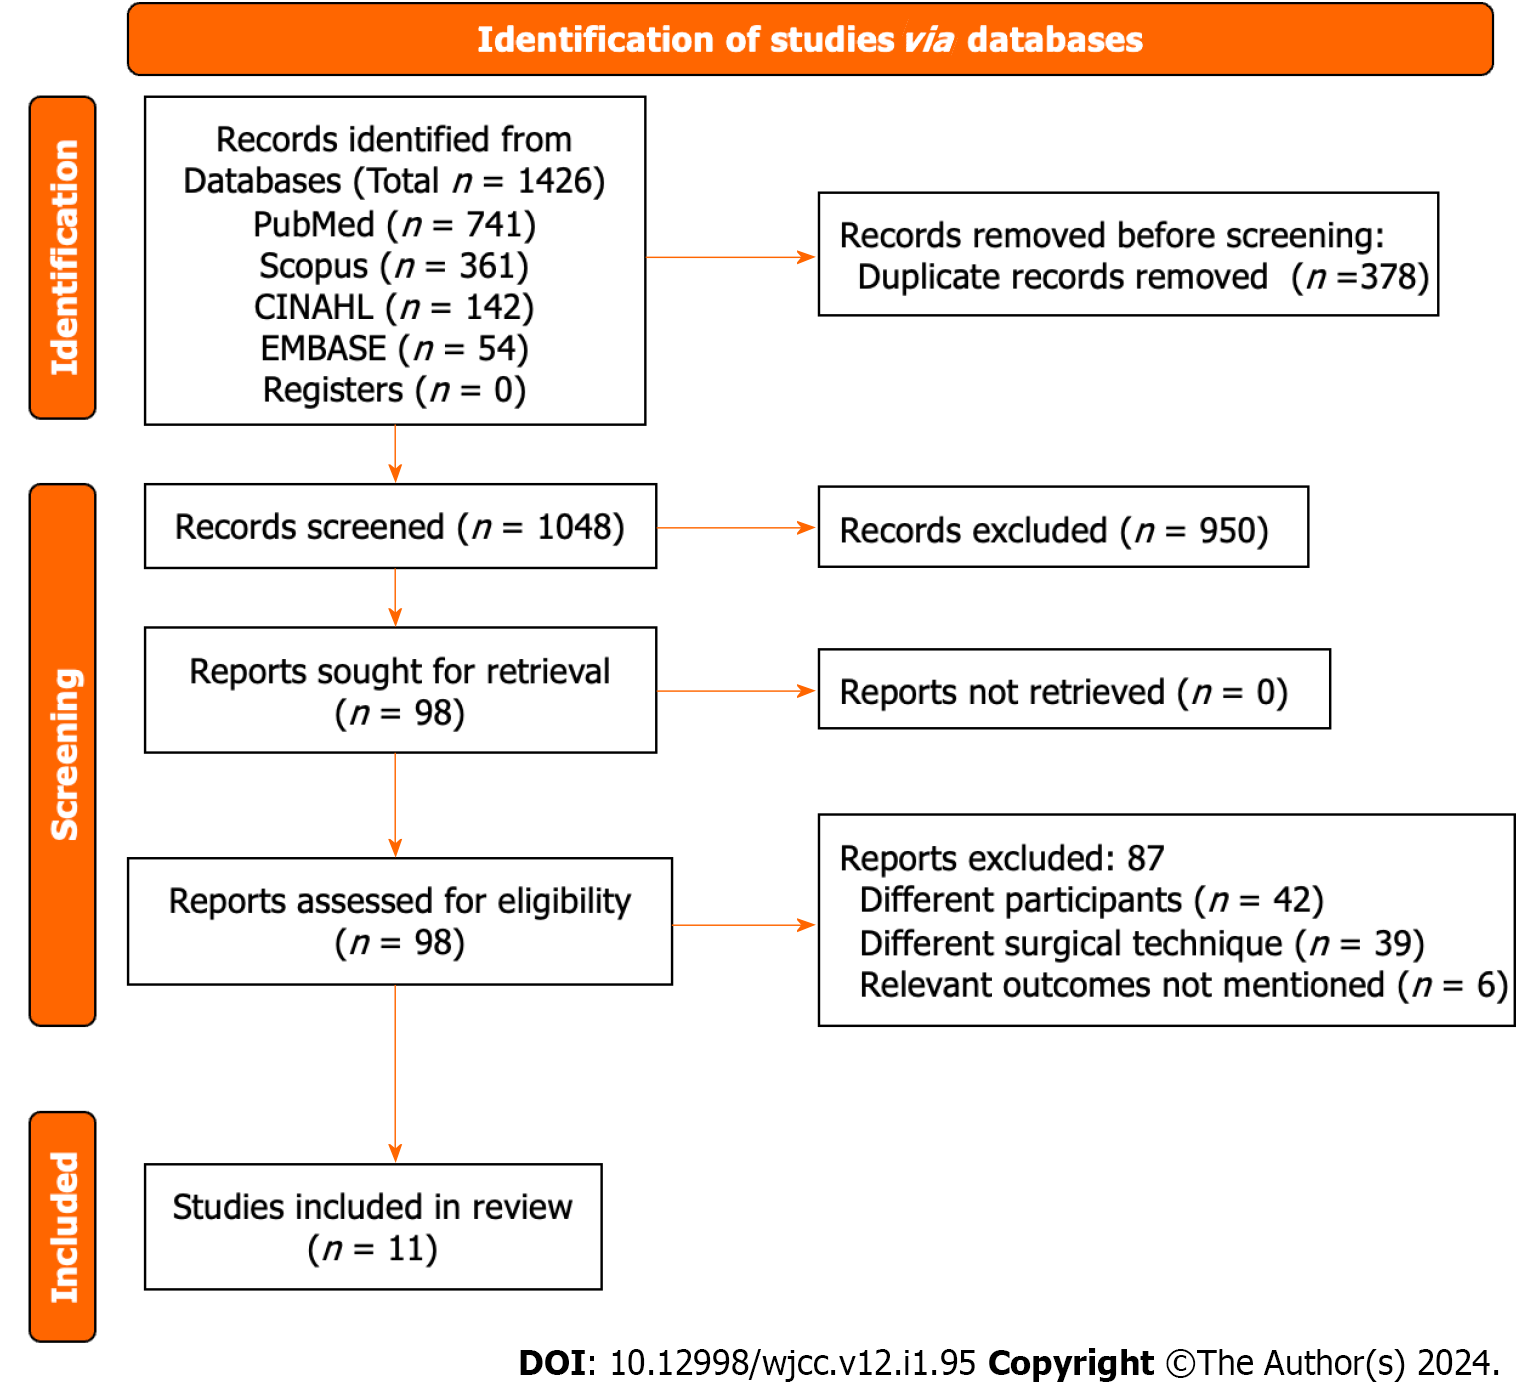
Figure 1 PRISMA flowchart.
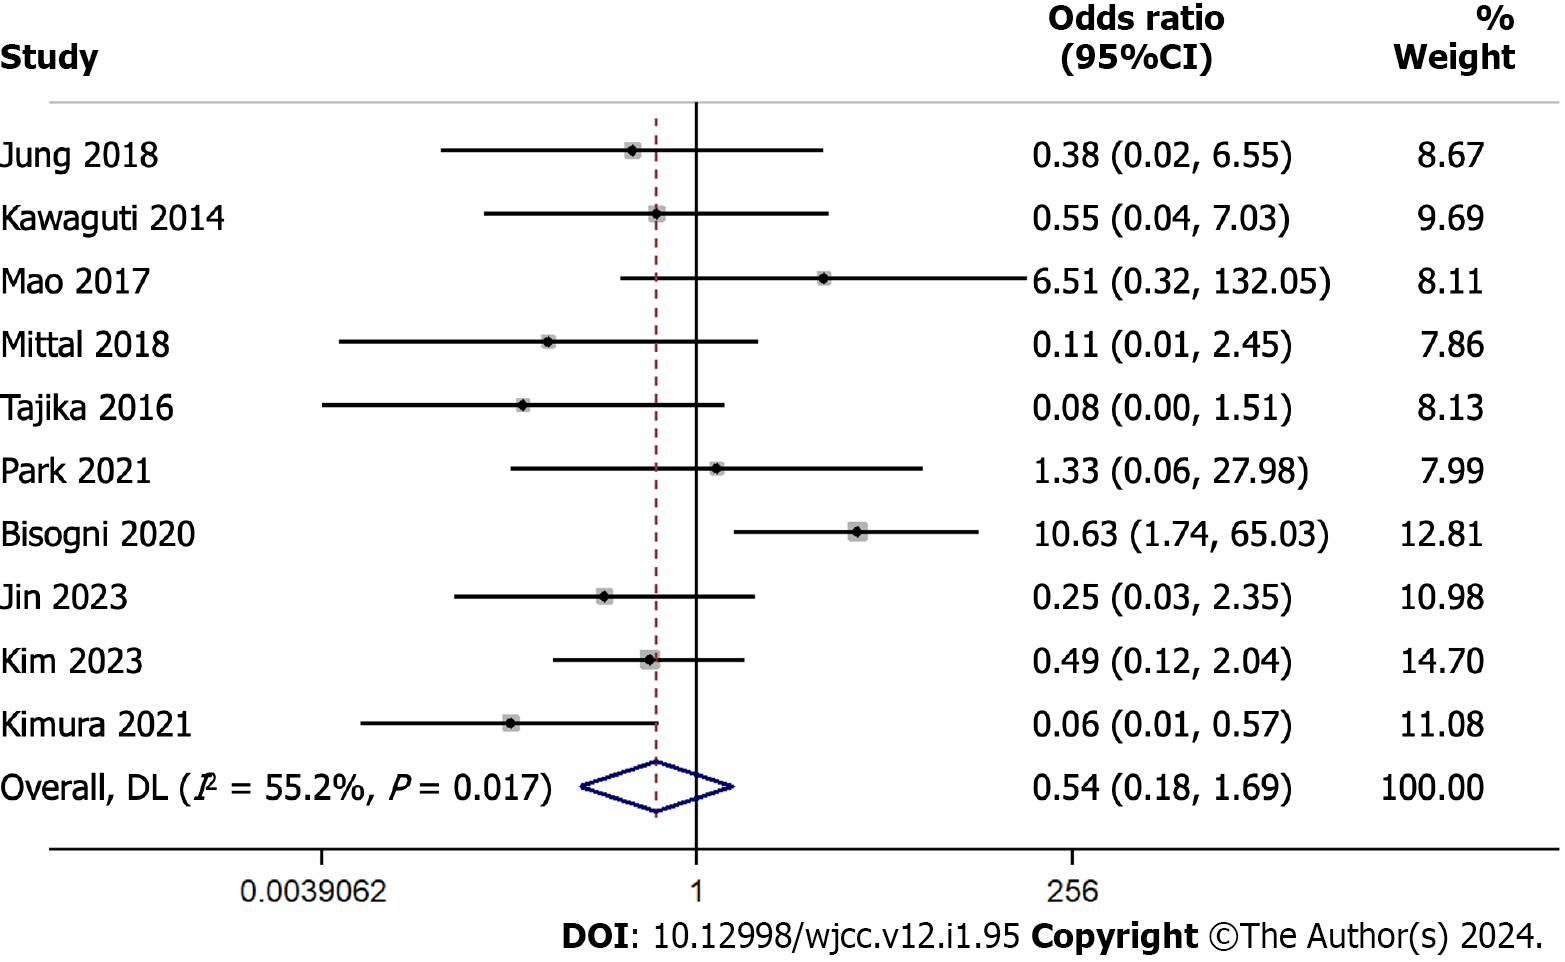
Figure 2 Forest plot showing the recurrence rate difference between endoscopic submucosal dissection and transendoscopic surgery.
Weights are from random-effects model; continuity correction applied to studies with zero cells.
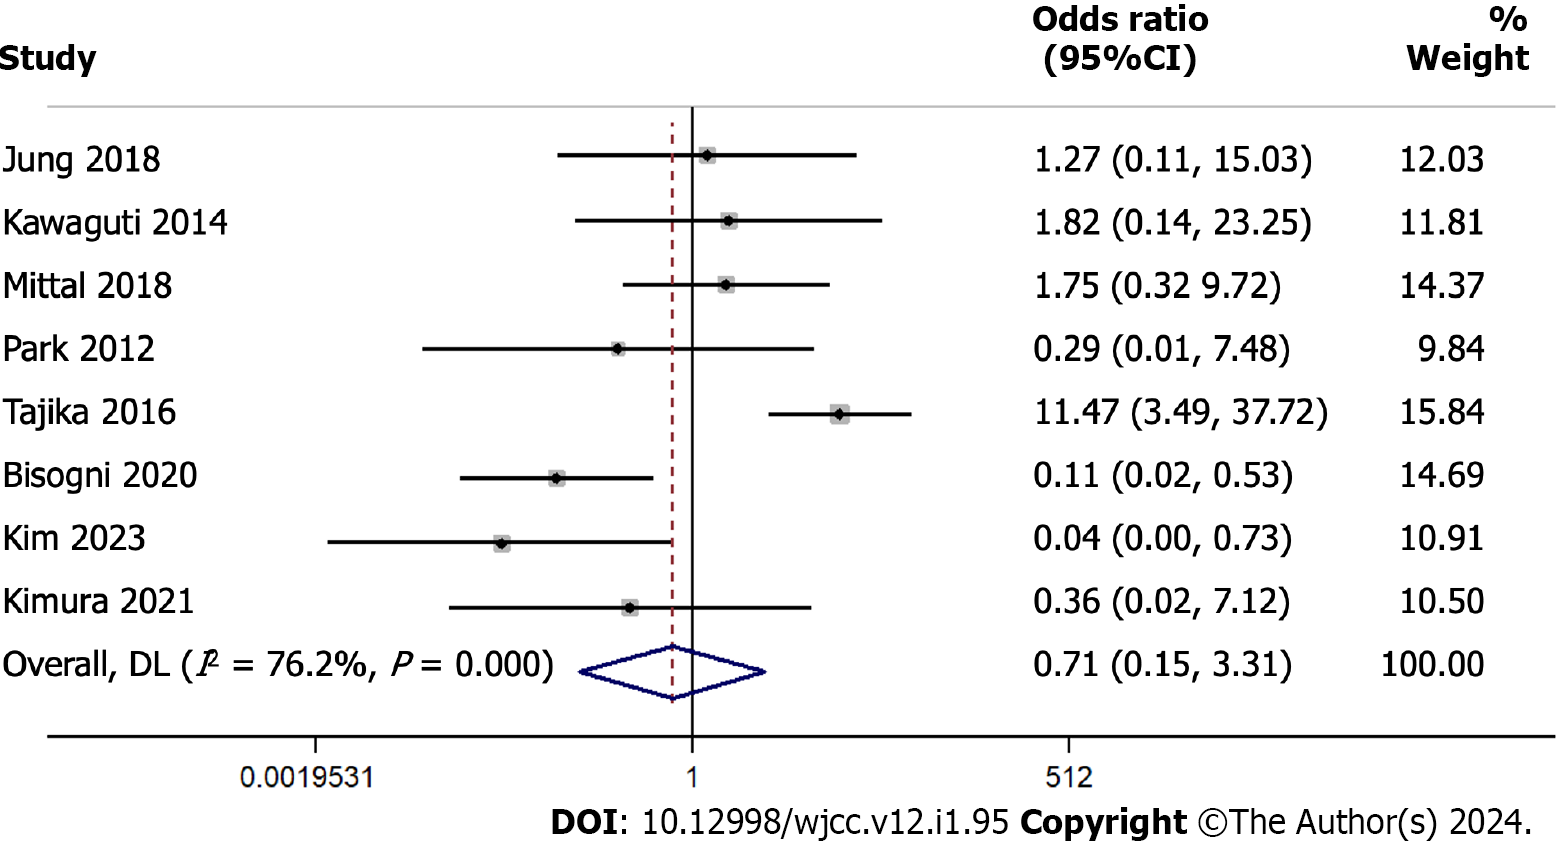
Figure 3 Forest plot showing the en bloc resection rate difference between endoscopic submucosal dissection and transendoscopic surgery.
Weights are from random-effects model; continuity correction applied to studies with zero cells.
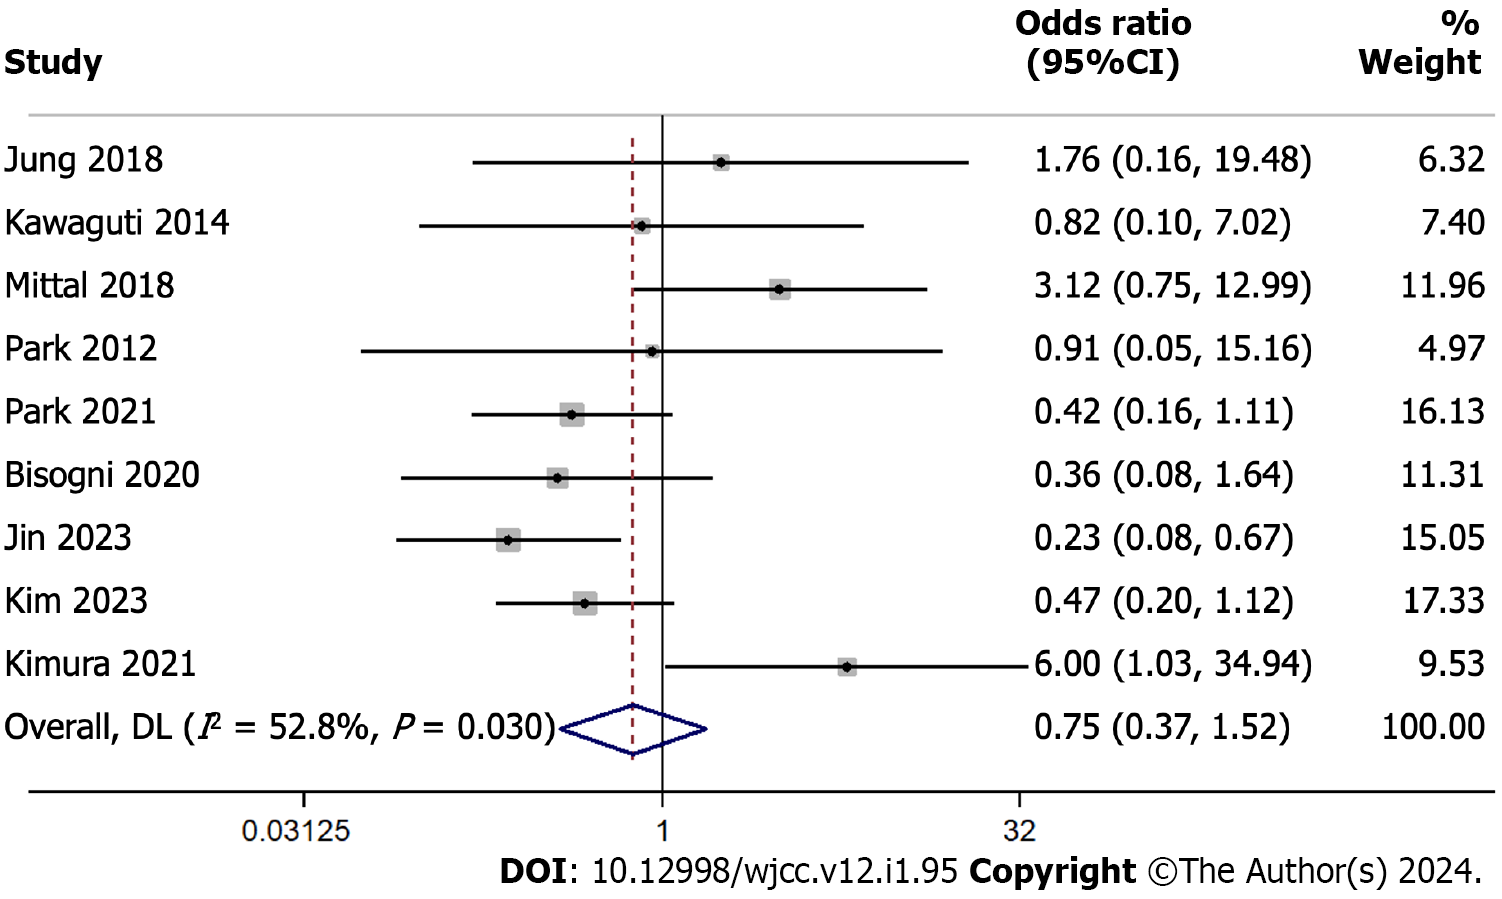
Figure 4 Forest plot showing the R0 resection rate difference between endoscopic submucosal dissection and transendoscopic surgery.
Weights are from random-effects model.
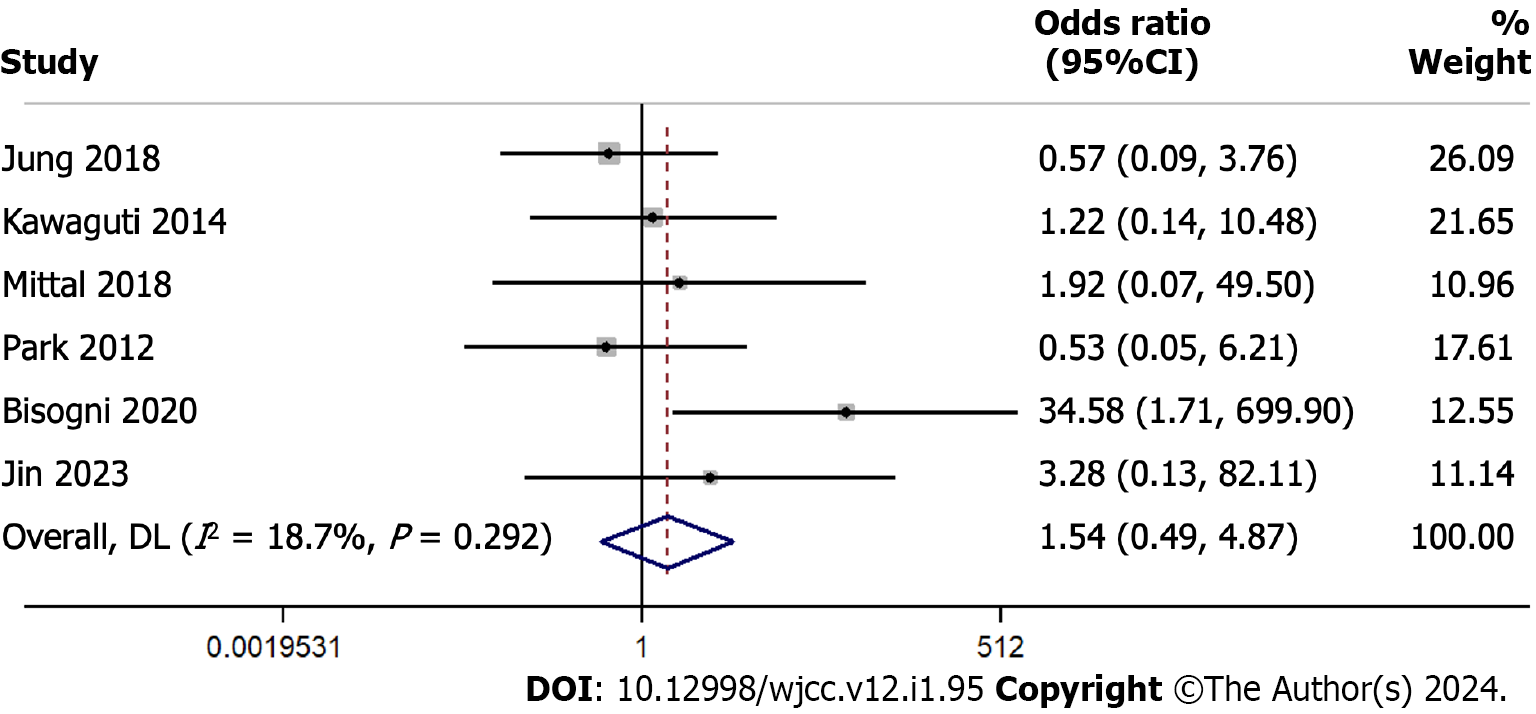
Figure 5 Forest plot showing the perforation rate difference between endoscopic submucosal dissection and transendoscopic surgery.
Weights are from random-effects model; continuity correction applied to studies with zero cells.
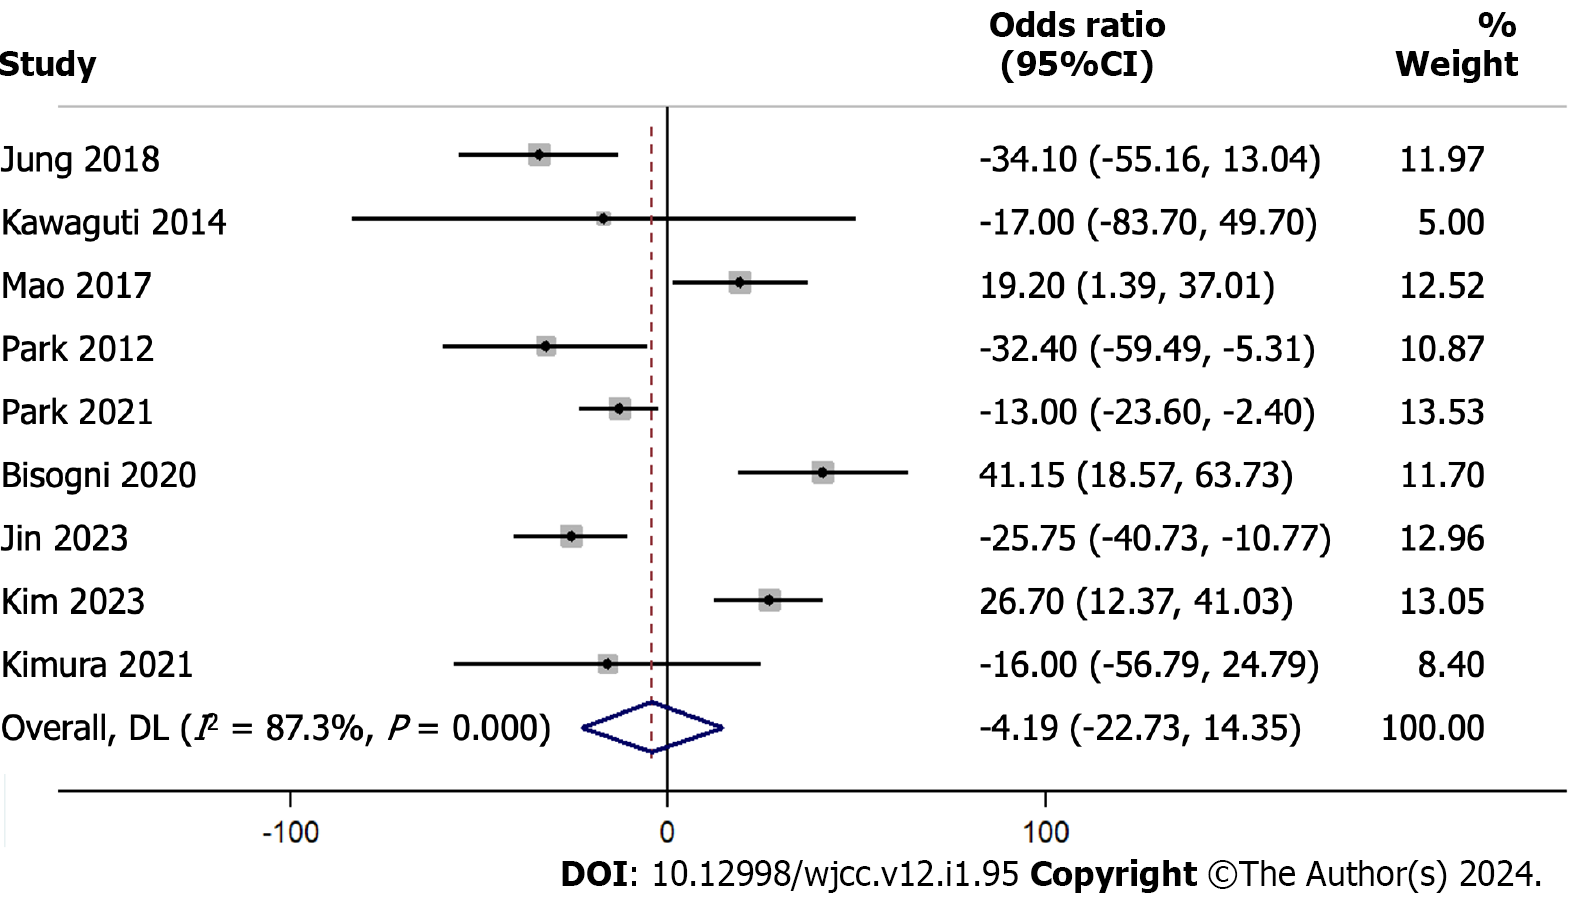
Figure 6 Forest plot showing the procedure length difference between endoscopic submucosal dissection and transendoscopic surgery.
Weights are from random-effects model.
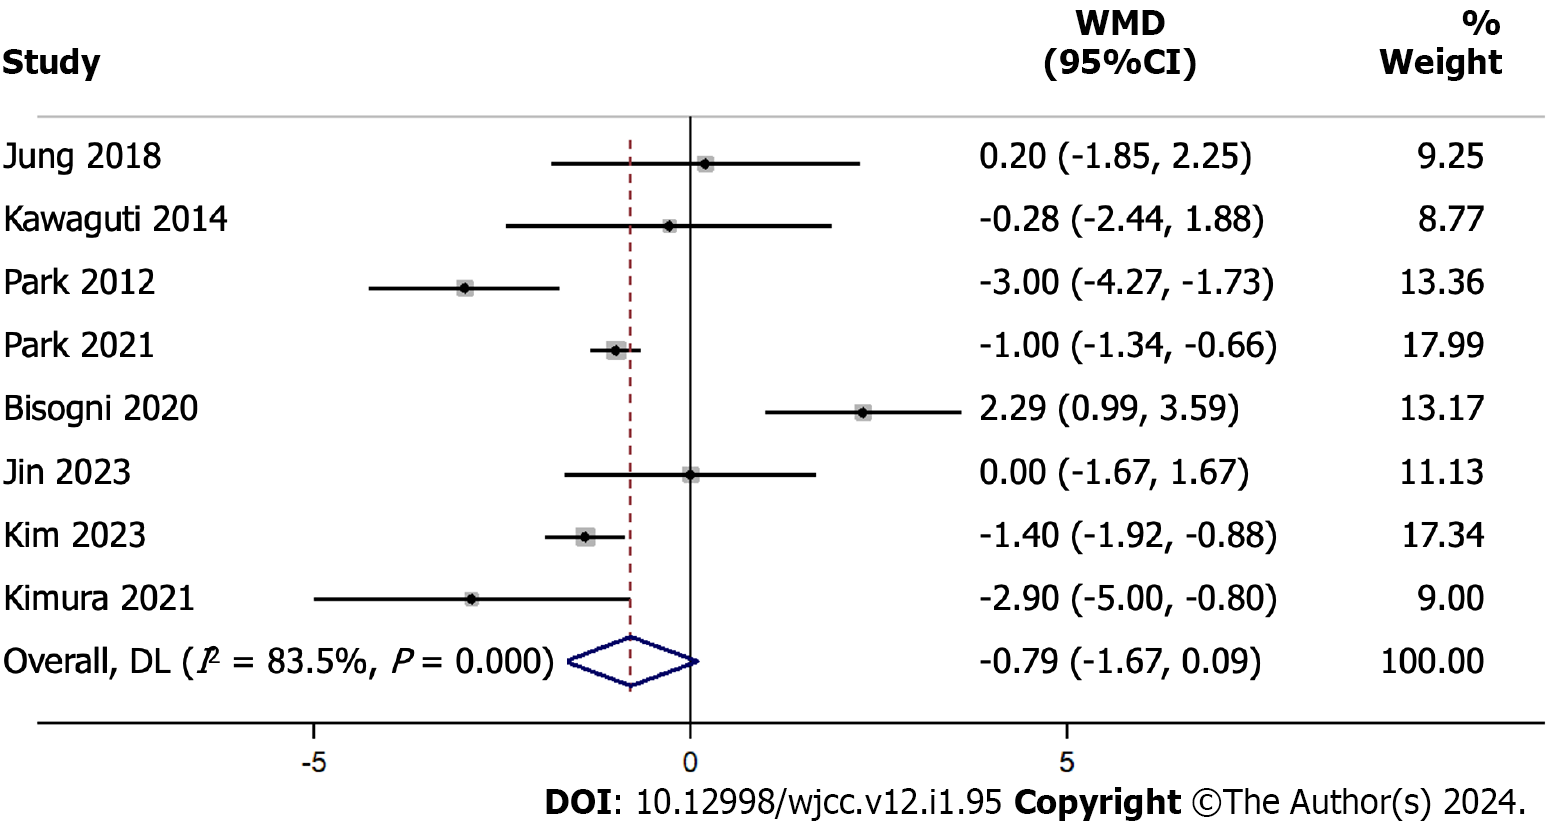
Figure 7 Forest plot showing the hospital stay length difference between endoscopic submucosal dissection and transendoscopic surgery.
Weights are from random-effects model. WMD: Weighted mean difference.
- Citation: Huang LW, Zhong Y. Endoscopic submucosal dissection vs transanal endoscopic surgery for rectal tumors: A systematic review and meta-analysis. World J Clin Cases 2024; 12(1): 95-106
- URL: https://www.wjgnet.com/2307-8960/full/v12/i1/95.htm
- DOI: https://dx.doi.org/10.12998/wjcc.v12.i1.95


