Copyright
©The Author(s) 2024.
World J Clin Cases. Jan 6, 2024; 12(1): 32-41
Published online Jan 6, 2024. doi: 10.12998/wjcc.v12.i1.32
Published online Jan 6, 2024. doi: 10.12998/wjcc.v12.i1.32
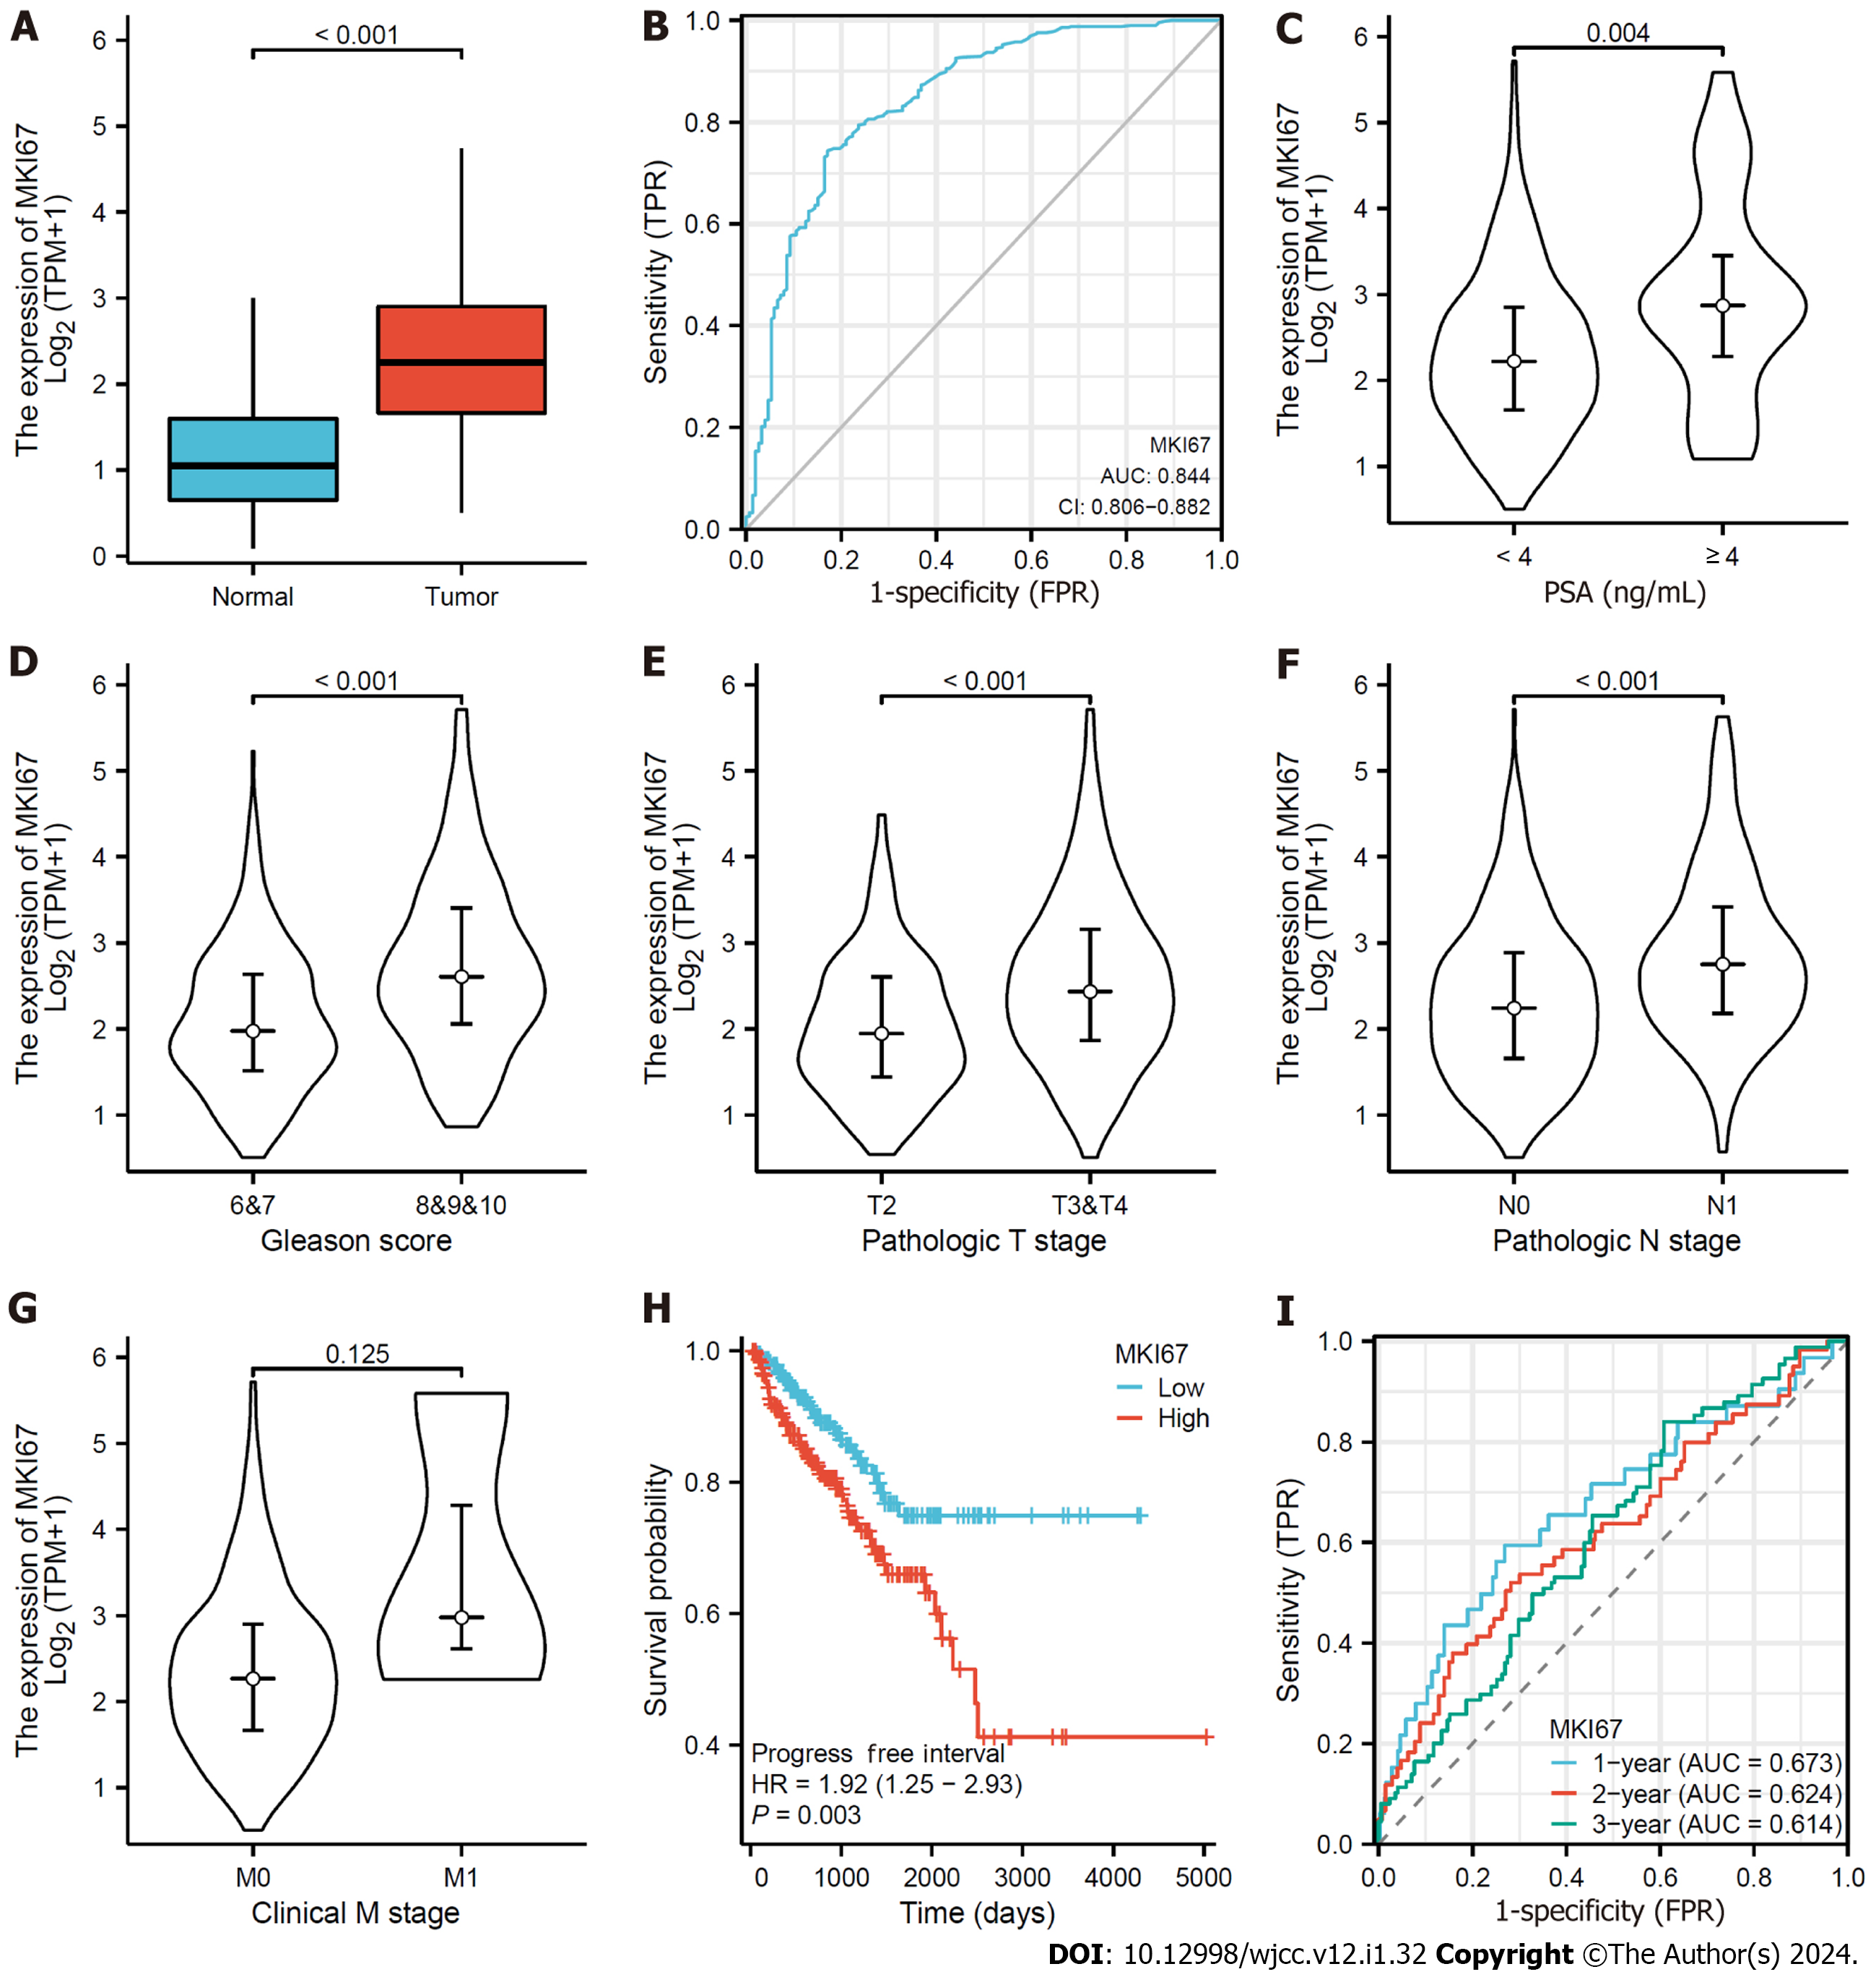
Figure 1 Analysis of data of marker Ki-67 from The Cancer Genome Atlas database and Genotype-Tissue Expression database.
A: The difference of marker Ki-67 (MKI67) expression between 496 cases of prostate cancer (PCa) tissues and 152 cases of normal samples selected from The Cancer Genome Atlas (TCGA) database and Genotype-Tissue Expression (GTEx) database was calculated using Wilcoxon rank sum test; B: The data from TCGA database and GTEx database was used to verify the moderate ability of MKI67 expression to distinguish PCa tissues from normal samples by receiver operating characteristic (ROC) curve; C-G: The associations between MKI67 expression and clinicopathological characteristics were analyzed by Wilcoxon rank sum test using the data from TCGA; H: The association between MKI67 expression and progress-free interval (PFI) of PCa was analyzed by Kaplan-Meier method. The low- and high expression of MKI67 groups were divided by the median value of MKI67 expression using the data from TCGA database; I: The weak efficacy of MKI67 expression to predict the 1-, 2-, and 3-year PFI of PCa was proved through time-ROC curve using the data from TCGA database. PSA: Prostate-specific antigen; TPR: True positive rate; FPR: False positive rate; HR: Hazard ratio; AUC: Area under the curve; MKI67, marker Ki-67.
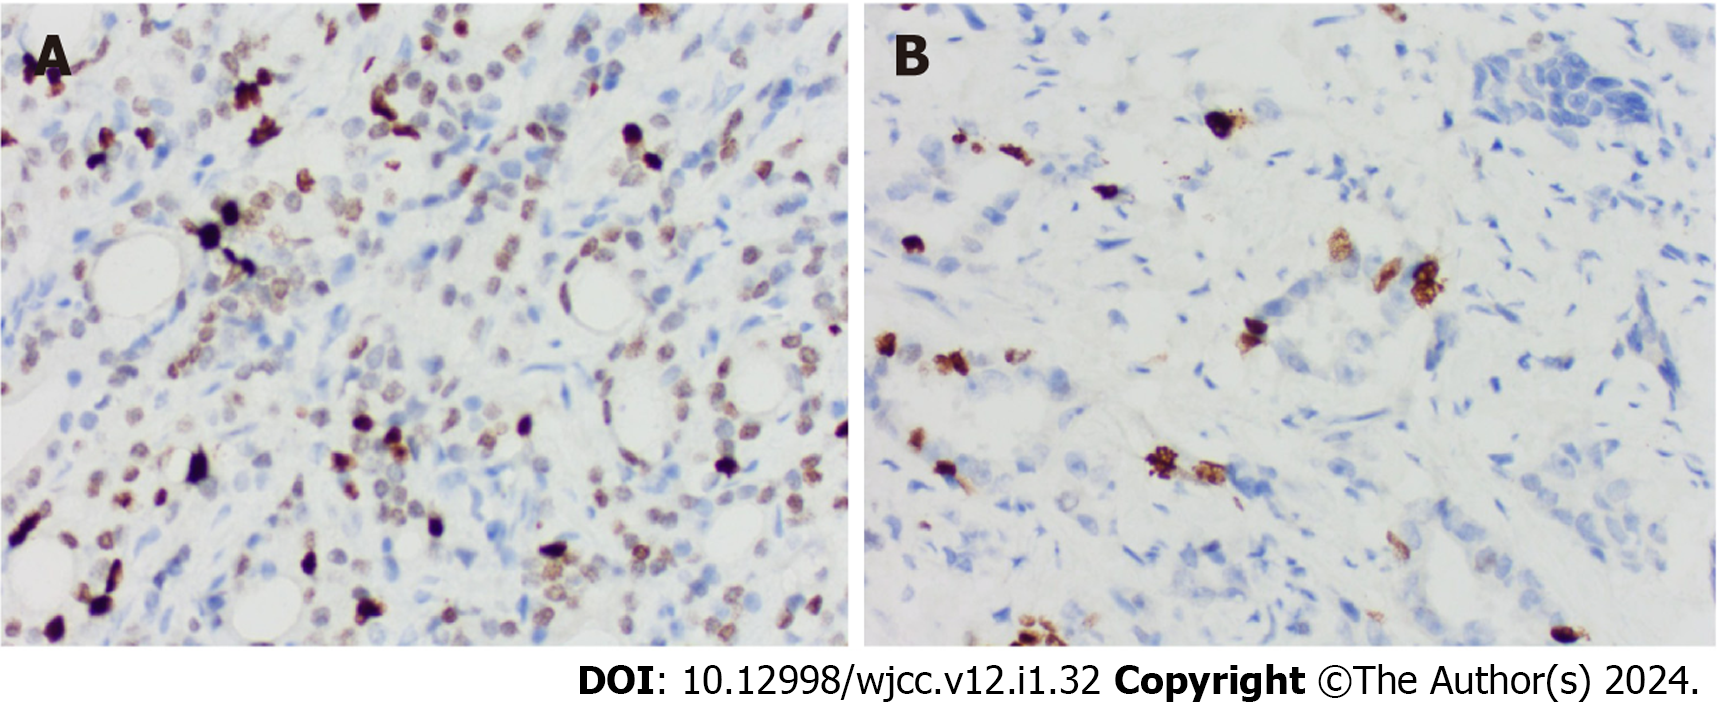
Figure 2 The expression of marker Ki-67 in prostate tissues (× 400).
A: High expression of marker Ki-67 (MKI67) (positive MKI67 rate: 20%); B: Low expression of MKI67 (positive MKI67 rate: 3%).
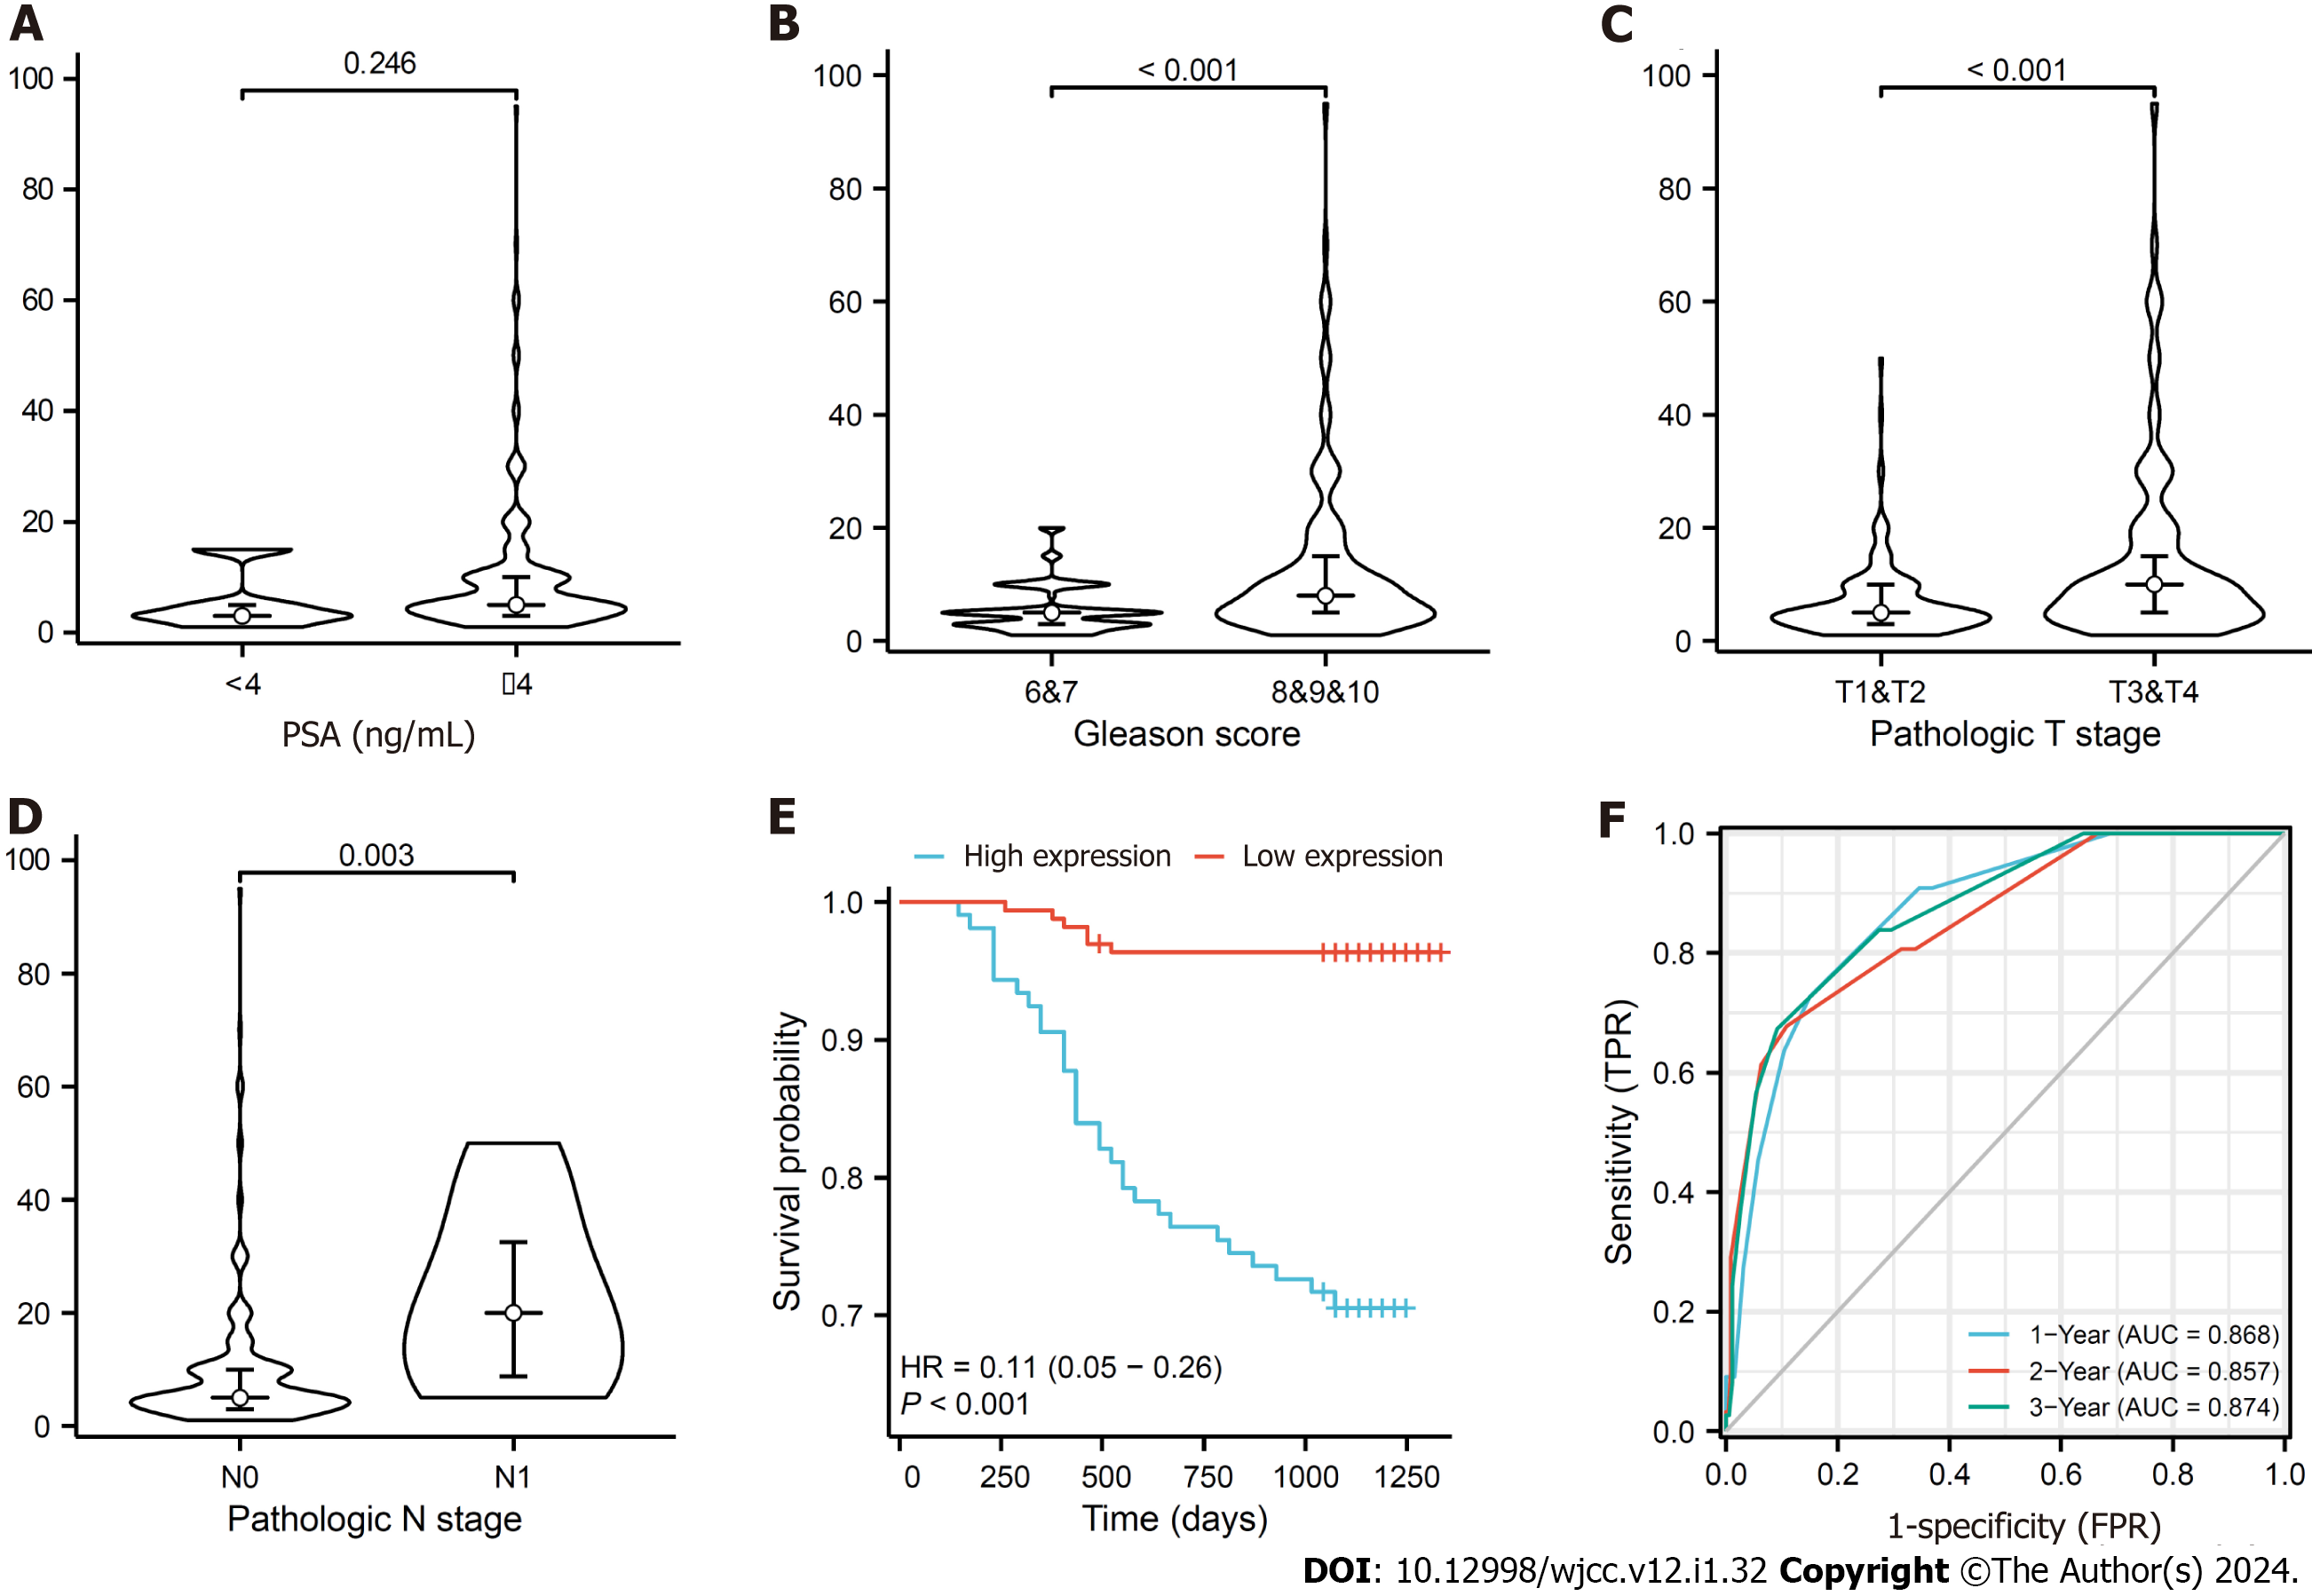
Figure 3 Analysis of the associations between marker Ki-67 expression and clinicopathological characteristics from 271 cases.
A-D: The associations between marker Ki-67 (MKI67) expression and clinicopathological characteristics including prostate-specific antigen, Gleason Score, T Stage and N Stage were analyzed through Wilcoxon rank sum test; E: The association between MKI67 expression and progress-free interval (PFI) of prostate cancer (PCa) was analyzed by Kaplan-Meier method. The low- and high expression of MKI67 groups were divided by the median value of MKI67 expression; F: The moderate efficacy of MKI67 expression to predict the 1-, 2-, and 3-year PFI of PCa was proved through time- receiver operating characteristic curve. PSA: Prostate-specific antigen; TPR: True positive rate; HR: Hazard ratio; AUC: Area under the curve.
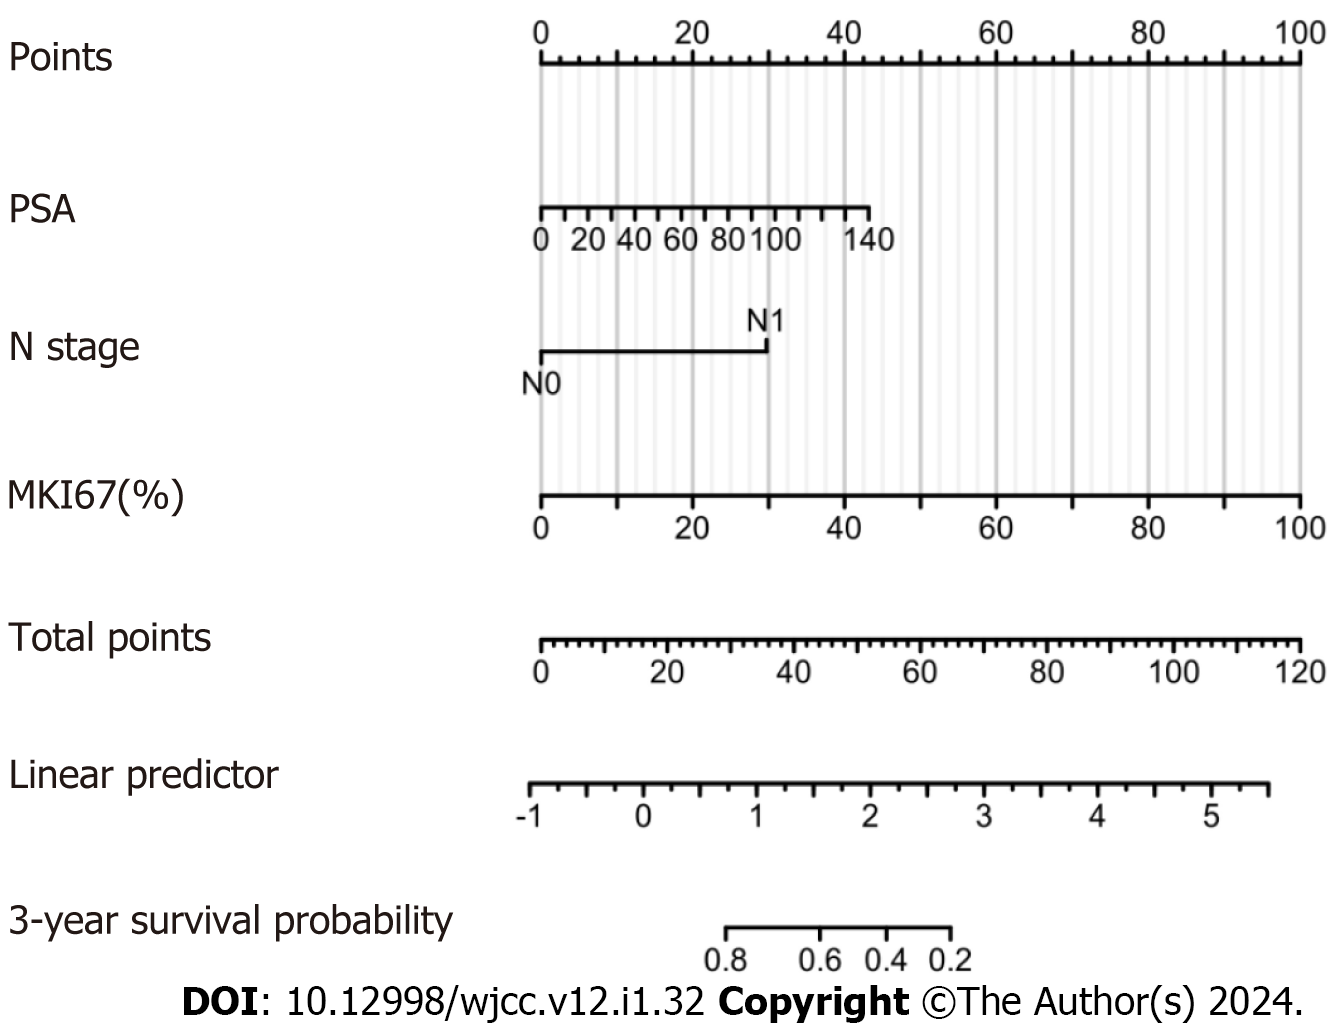
Figure 4 Nomogram for predicting 3-year progress free interval of prostate cancer.
PSA: Prostate-specific antigen; MKI67: Marker Ki-67.
- Citation: Song Z, Zhou Q, Zhang JL, Ouyang J, Zhang ZY. Marker Ki-67 is a potential biomarker for the diagnosis and prognosis of prostate cancer based on two cohorts. World J Clin Cases 2024; 12(1): 32-41
- URL: https://www.wjgnet.com/2307-8960/full/v12/i1/32.htm
- DOI: https://dx.doi.org/10.12998/wjcc.v12.i1.32


