Copyright
©The Author(s) 2023.
World J Clin Cases. Dec 16, 2023; 11(35): 8300-8309
Published online Dec 16, 2023. doi: 10.12998/wjcc.v11.i35.8300
Published online Dec 16, 2023. doi: 10.12998/wjcc.v11.i35.8300
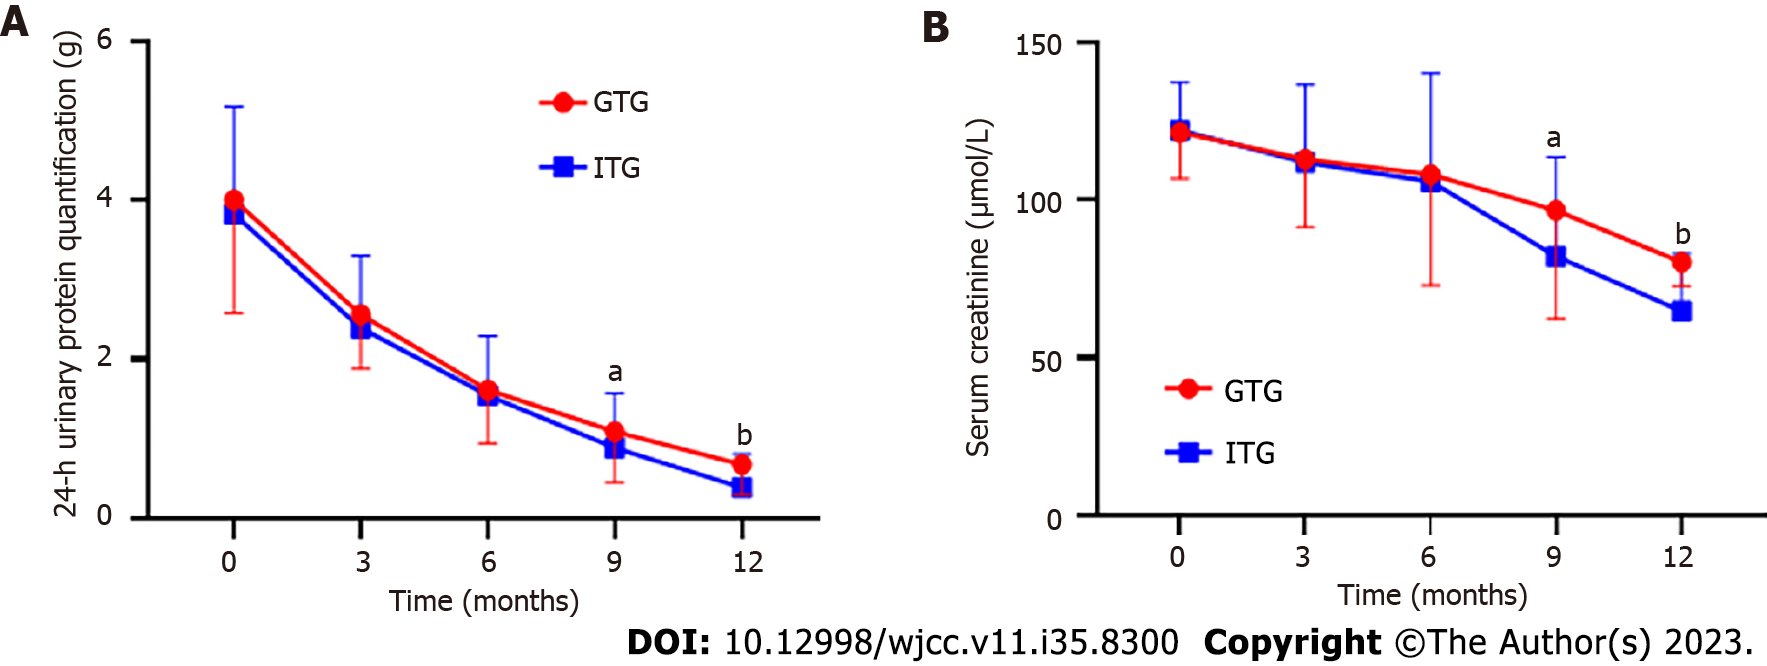
Figure 1 Changes in renal function and proteinuria before and after treatment in both glucocorticoid therapy group and immunosuppressive therapy group.
A: Changes in the trend of urinary protein quantity over 24 h of treatment in the two groups; B: Change in the trend of serum creatinine in the two groups over time. aP < 0.05 compared to glucocorticoid therapy group (GTG). bP < 0.01 compared to GTG. GTG: Glucocorticoid therapy group; ITG: Immunosuppressive therapy group.
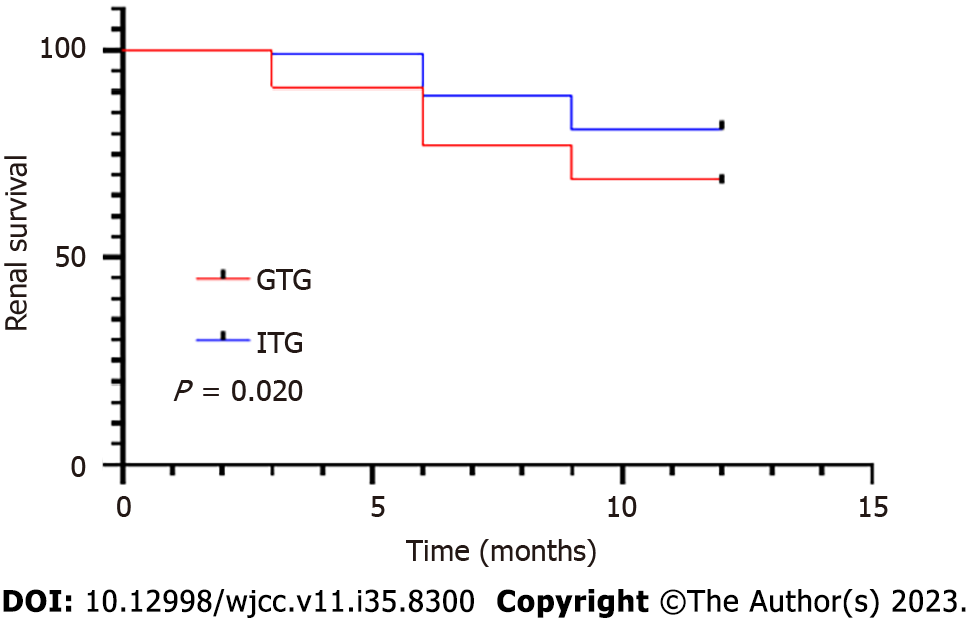
Figure 2 Kaplan–Meier survival curves of patients with no endpoint events in the glucocorticoid therapy group and immunosuppressive therapy group.
GTG: Glucocorticoid therapy group; ITG: Immunosuppressive therapy group.
- Citation: Meng MJ, Hu L, Fan Y, Gao H, Chen HZ, Chen CM, Qi Z, Liu B. Efficacy of prednisone combined with mycophenolate mofetil for immunoglobulin A nephropathy with moderate-to-severe renal dysfunction. World J Clin Cases 2023; 11(35): 8300-8309
- URL: https://www.wjgnet.com/2307-8960/full/v11/i35/8300.htm
- DOI: https://dx.doi.org/10.12998/wjcc.v11.i35.8300


