Copyright
©The Author(s) 2023.
World J Clin Cases. Nov 26, 2023; 11(33): 7951-7964
Published online Nov 26, 2023. doi: 10.12998/wjcc.v11.i33.7951
Published online Nov 26, 2023. doi: 10.12998/wjcc.v11.i33.7951
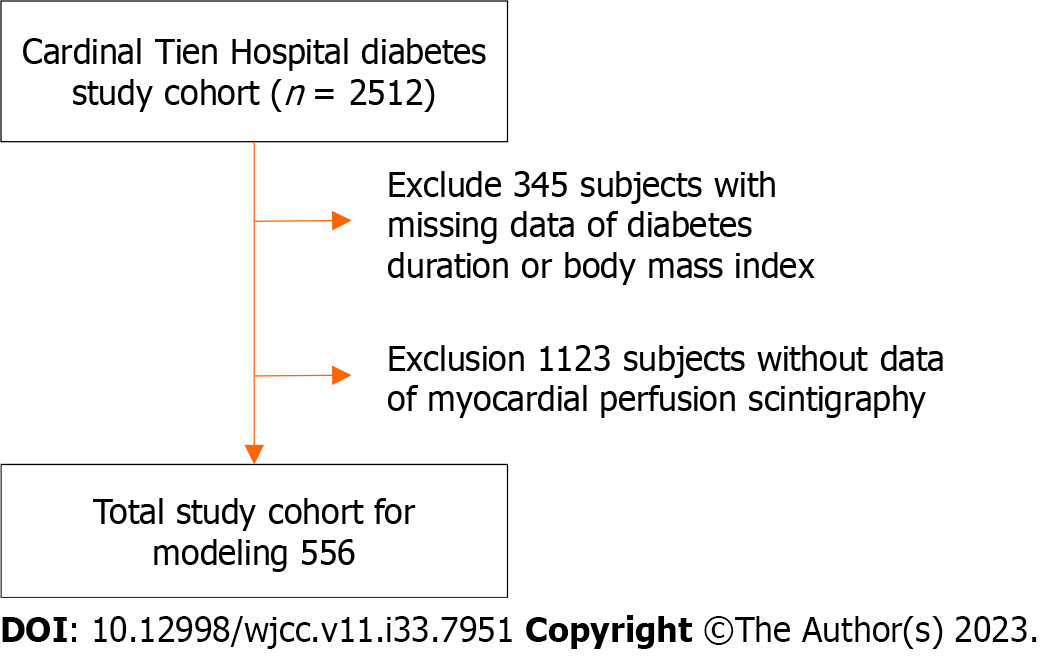
Figure 1 Flowchart of sample selection from the Cardinal Tien Hospital Diabetes Study Cohort.
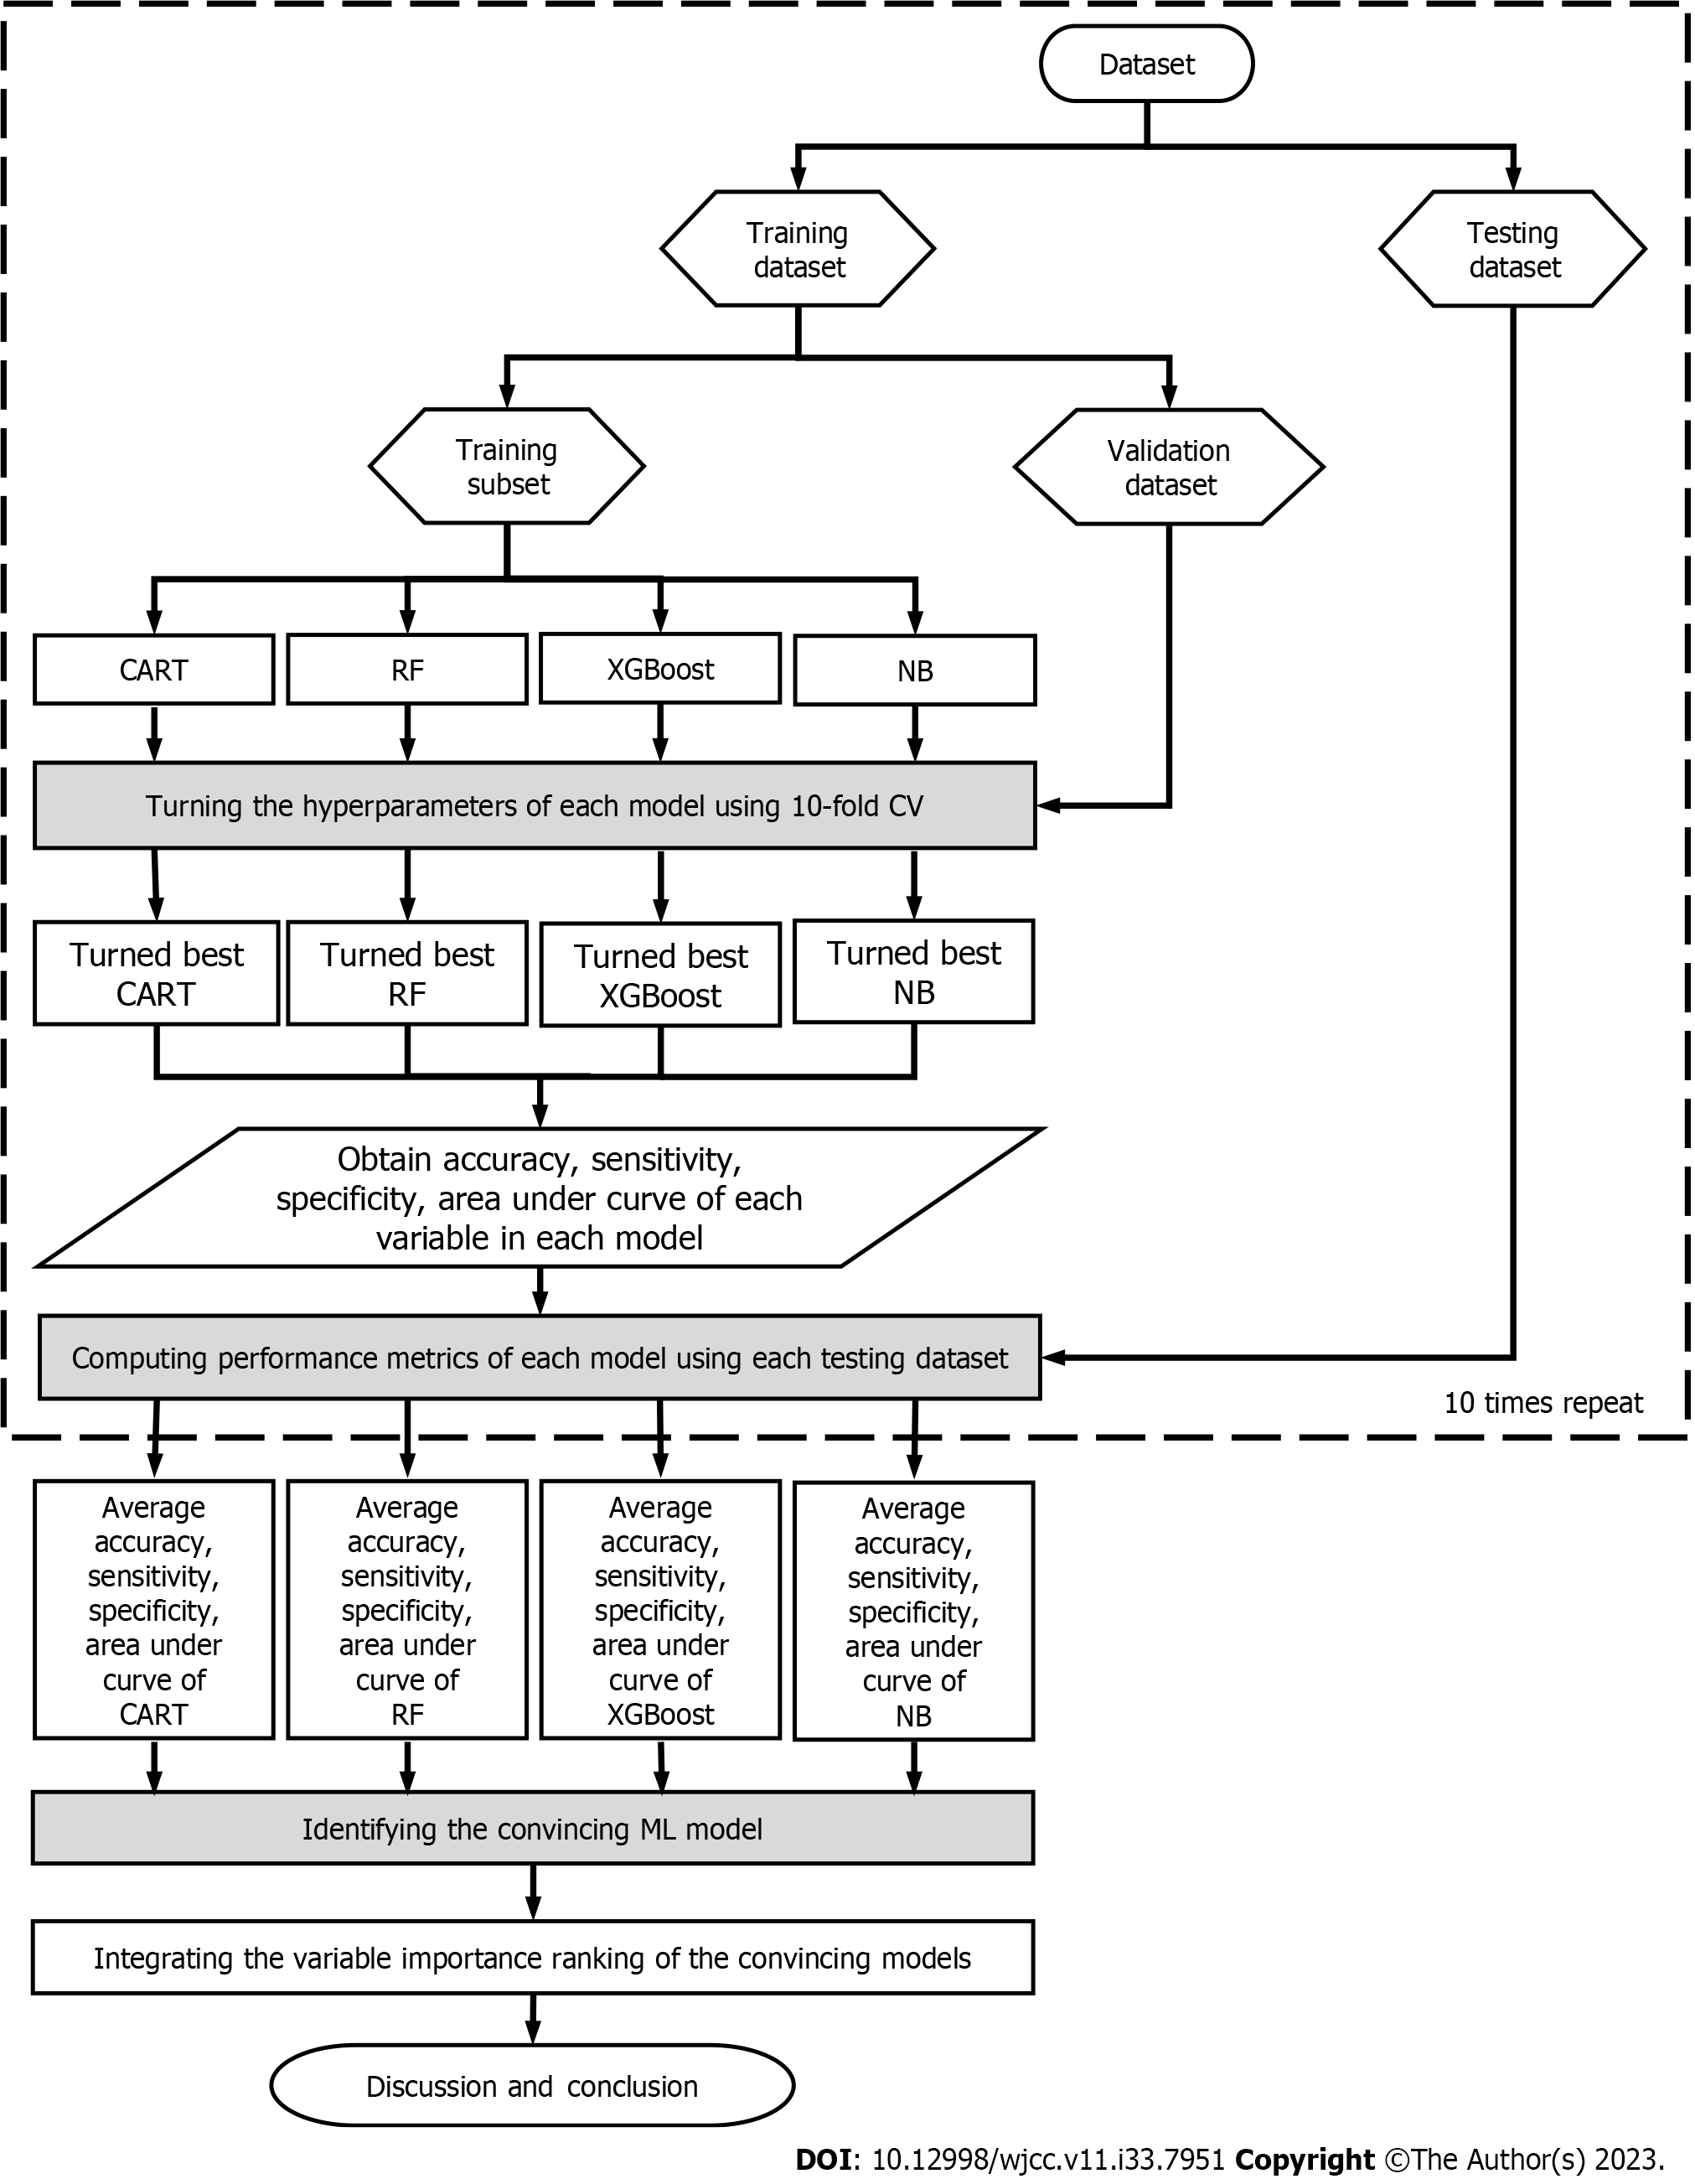
Figure 2 Proposed scheme for four machine learning methods.
CART: Classification and regression tree; RF: random forest; XGBoost: eXtreme gradient boosting; NB: Naïve Byes.
Figure 3 Integrated importance ranking of all risk factors.
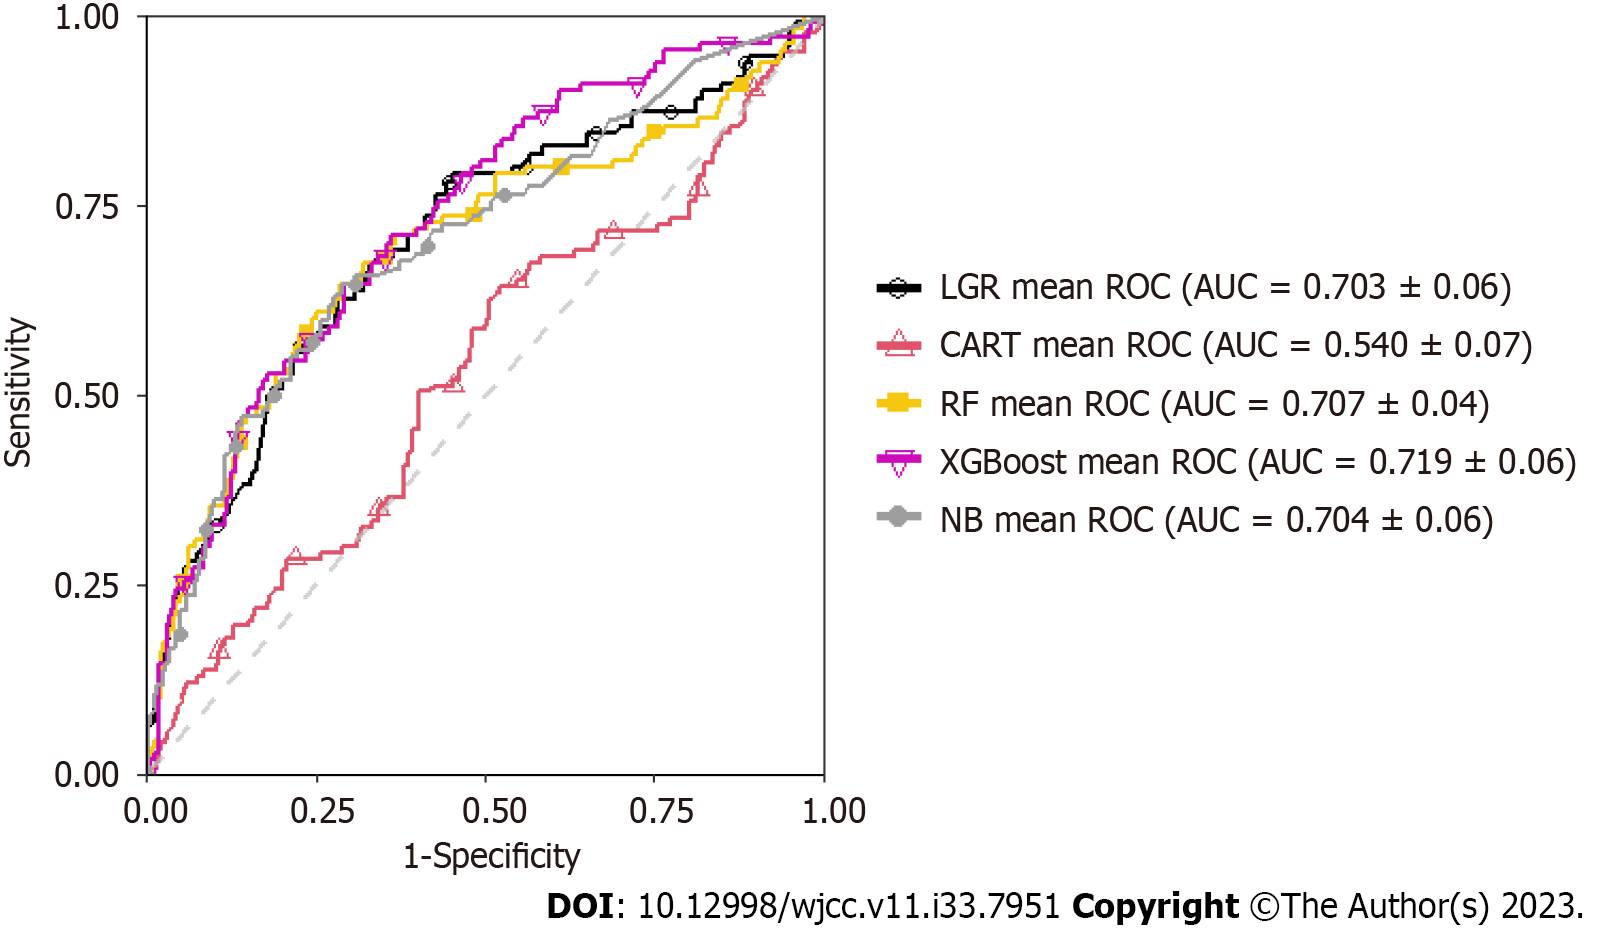
Figure 4 Receiver operation curve of logistic regression and other four different machine learning methods.
LGR: Logistic regression; CART: Classification and regression tree; RF: Random forest; XGBoost: eXtreme gradient boosting; NB: Naïve Byes.
- Citation: Yang CC, Peng CH, Huang LY, Chen FY, Kuo CH, Wu CZ, Hsia TL, Lin CY. Comparison between multiple logistic regression and machine learning methods in prediction of abnormal thallium scans in type 2 diabetes. World J Clin Cases 2023; 11(33): 7951-7964
- URL: https://www.wjgnet.com/2307-8960/full/v11/i33/7951.htm
- DOI: https://dx.doi.org/10.12998/wjcc.v11.i33.7951


