Copyright
©The Author(s) 2023.
World J Clin Cases. Nov 6, 2023; 11(31): 7690-7698
Published online Nov 6, 2023. doi: 10.12998/wjcc.v11.i31.7690
Published online Nov 6, 2023. doi: 10.12998/wjcc.v11.i31.7690
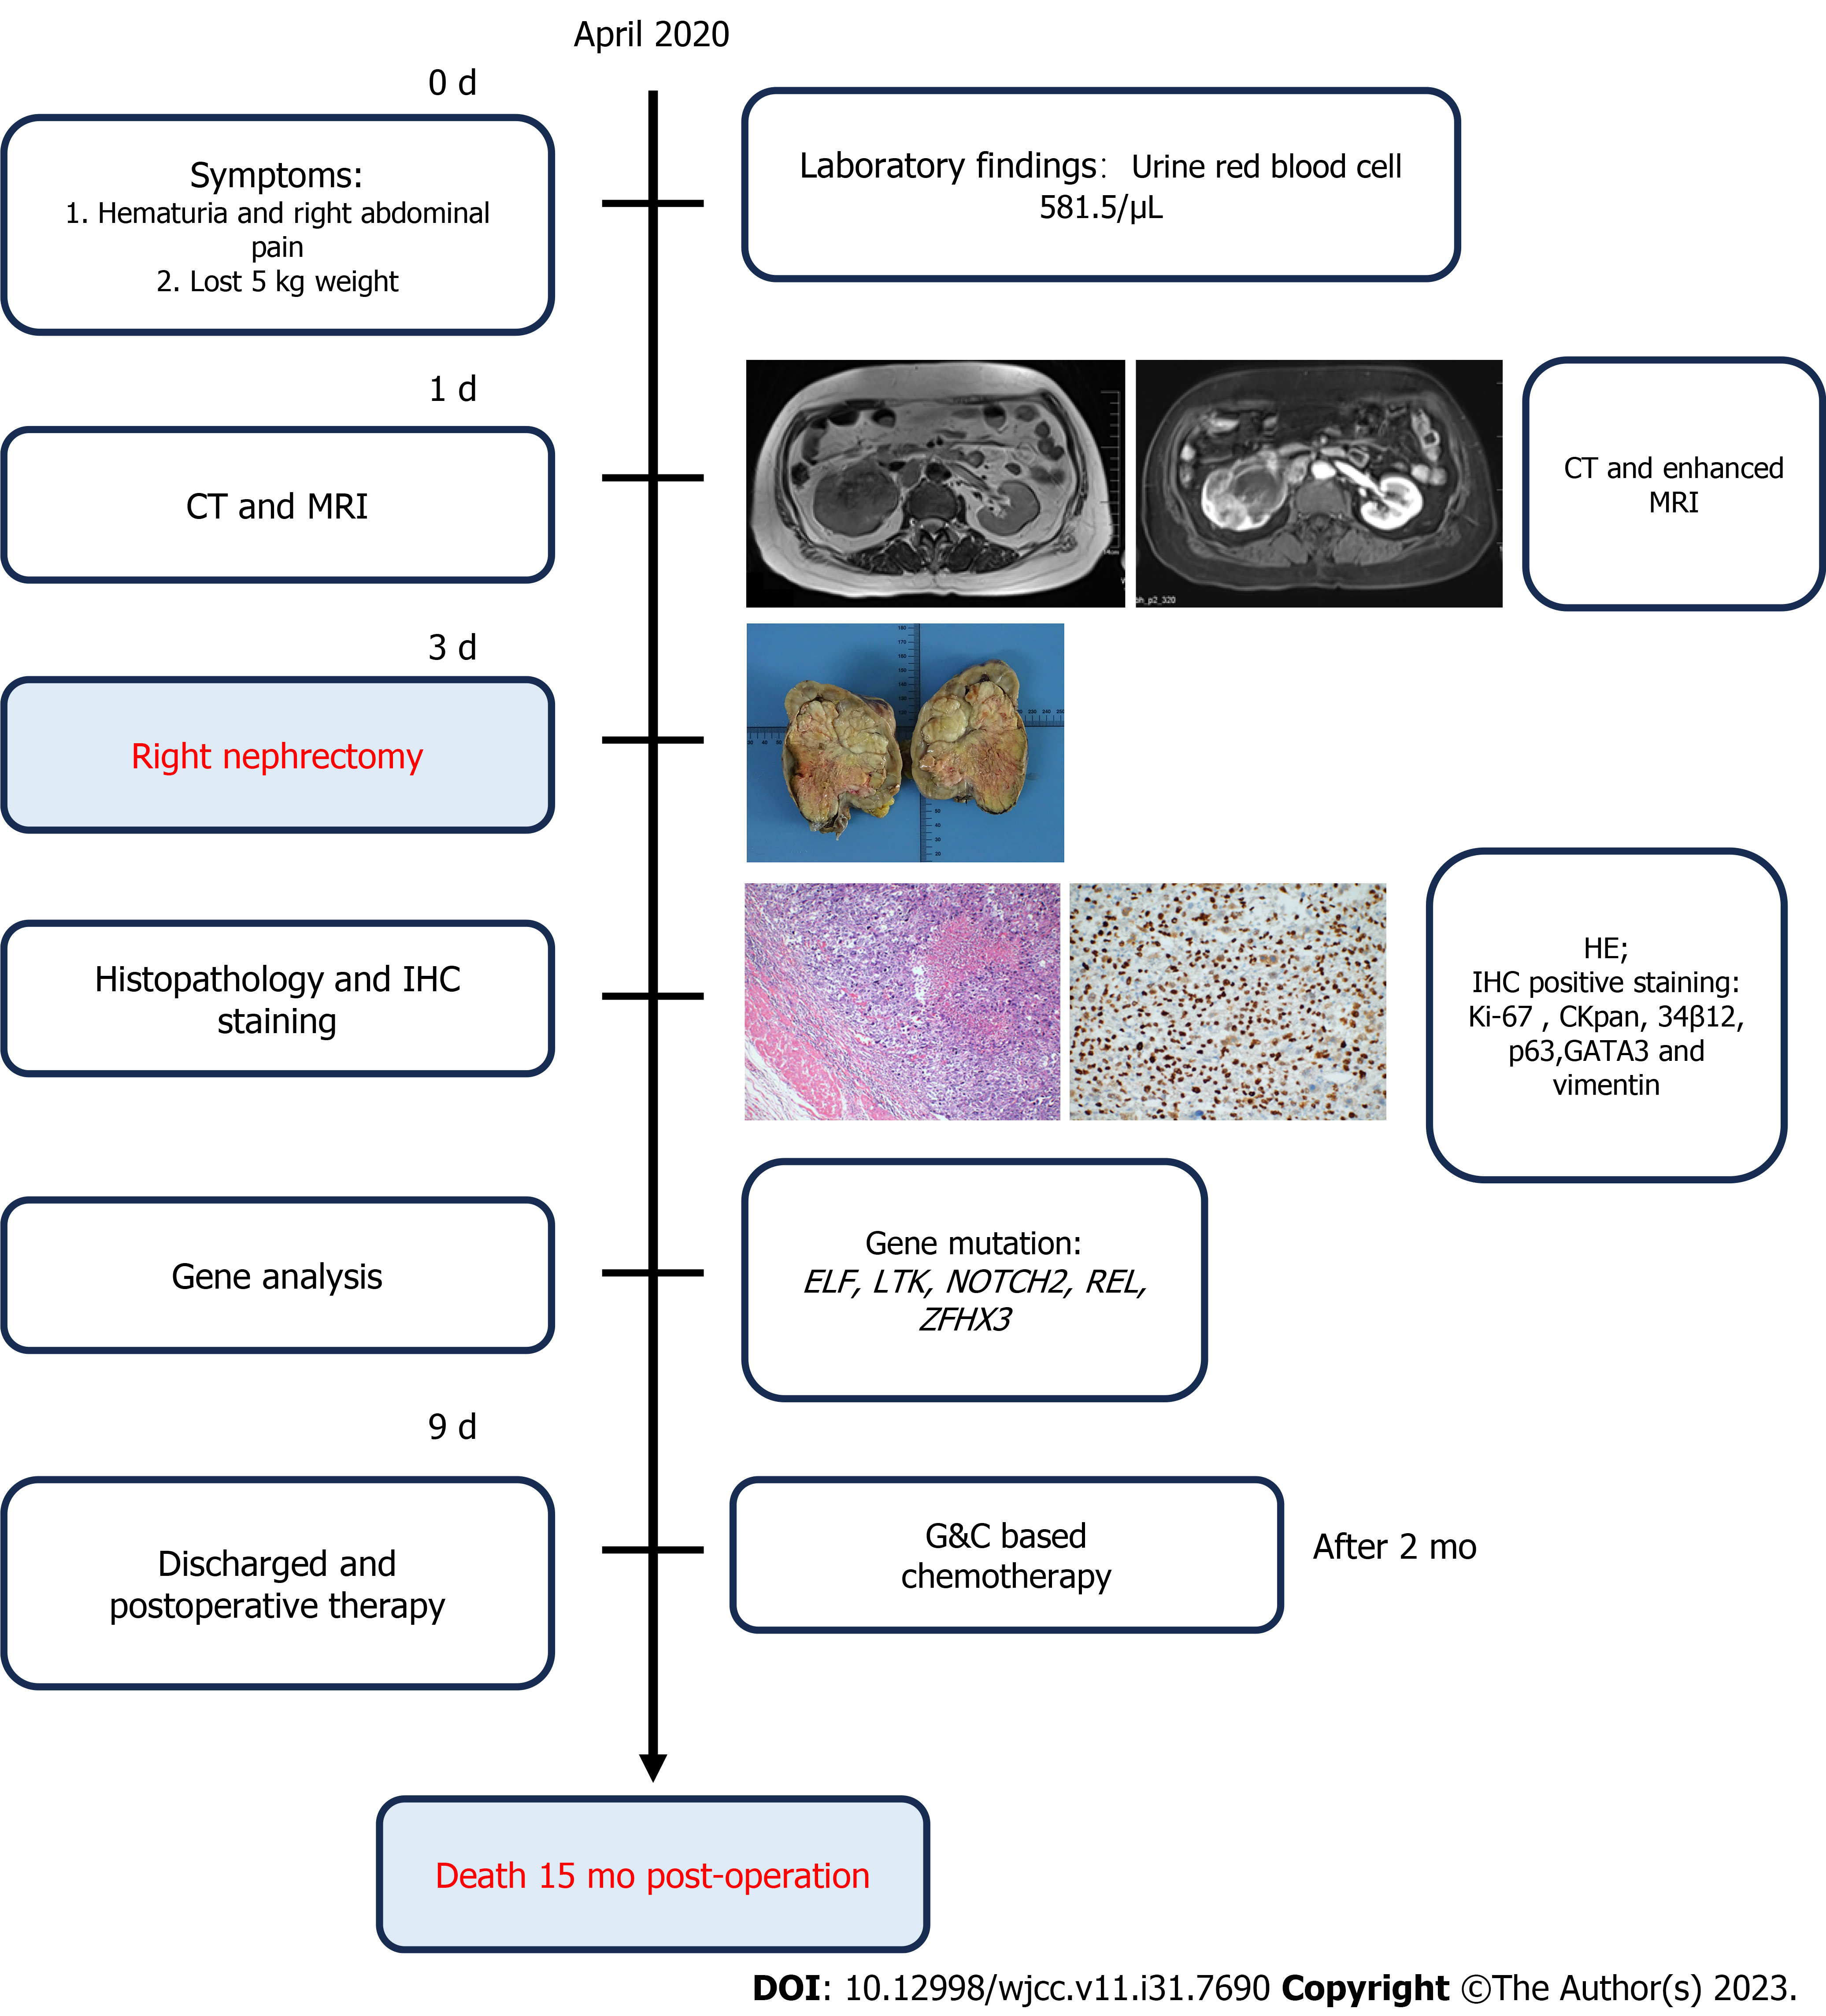
Figure 1 Patient diagnosis and treatment process flowchart.
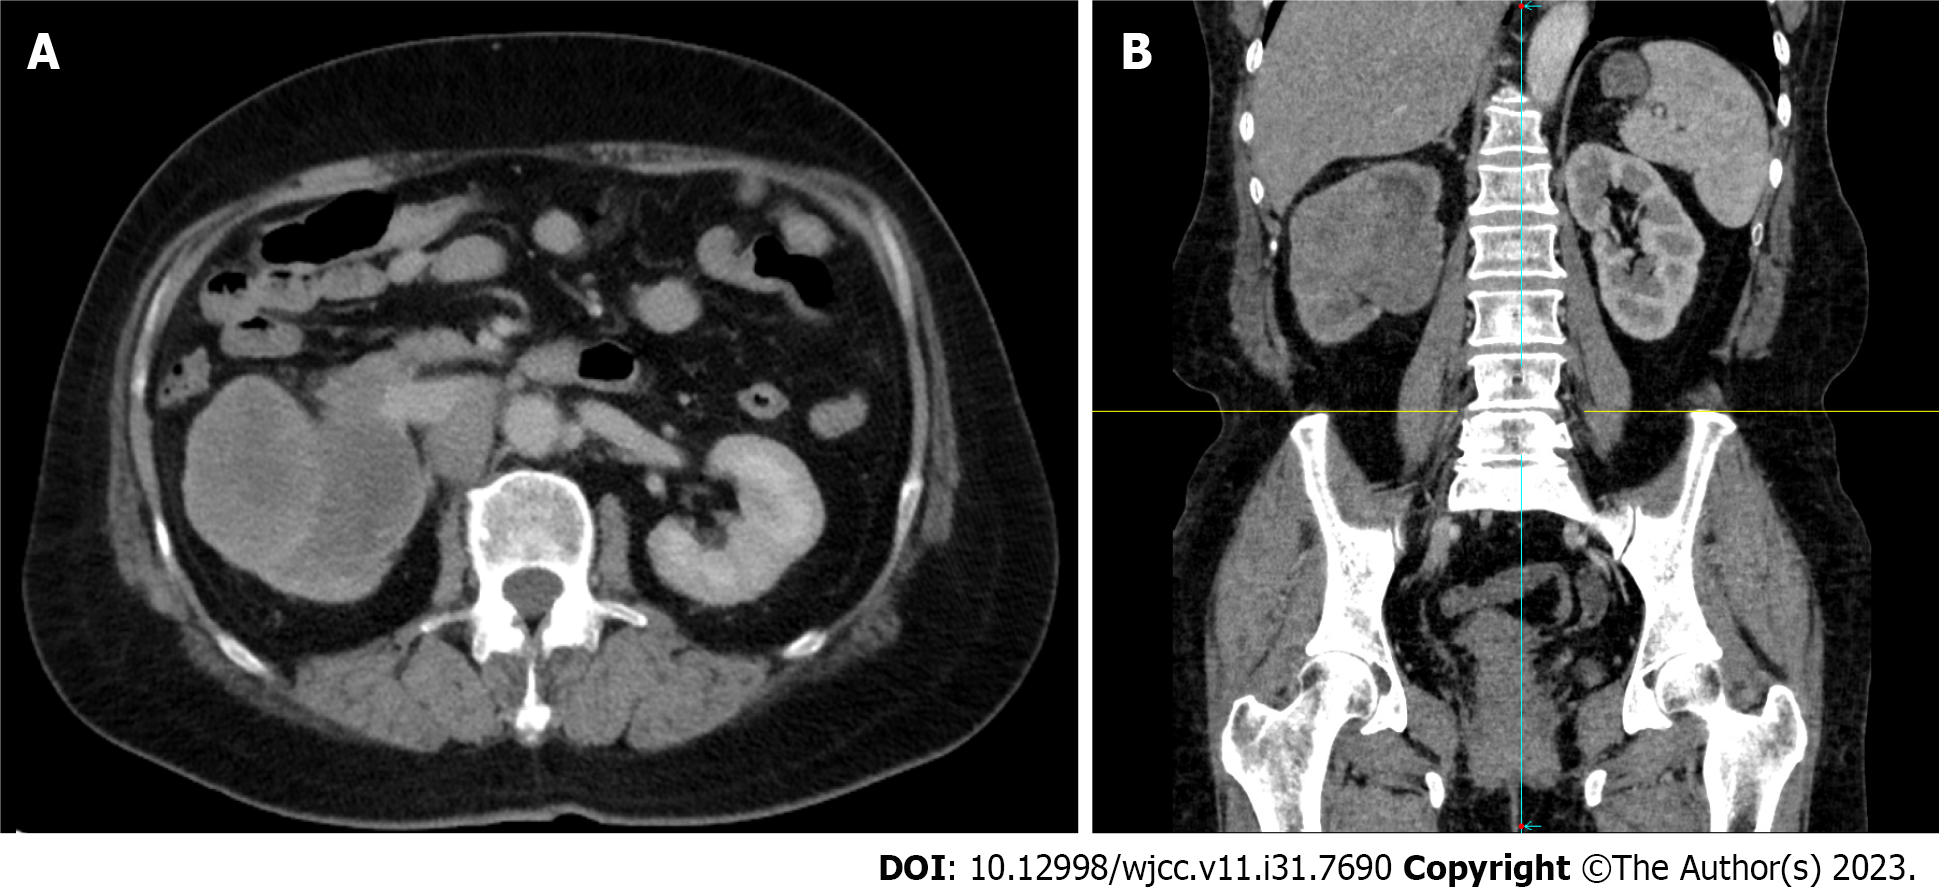
Figure 2 Computed tomography scans.
A: Cross-section; B: Coronal-section.
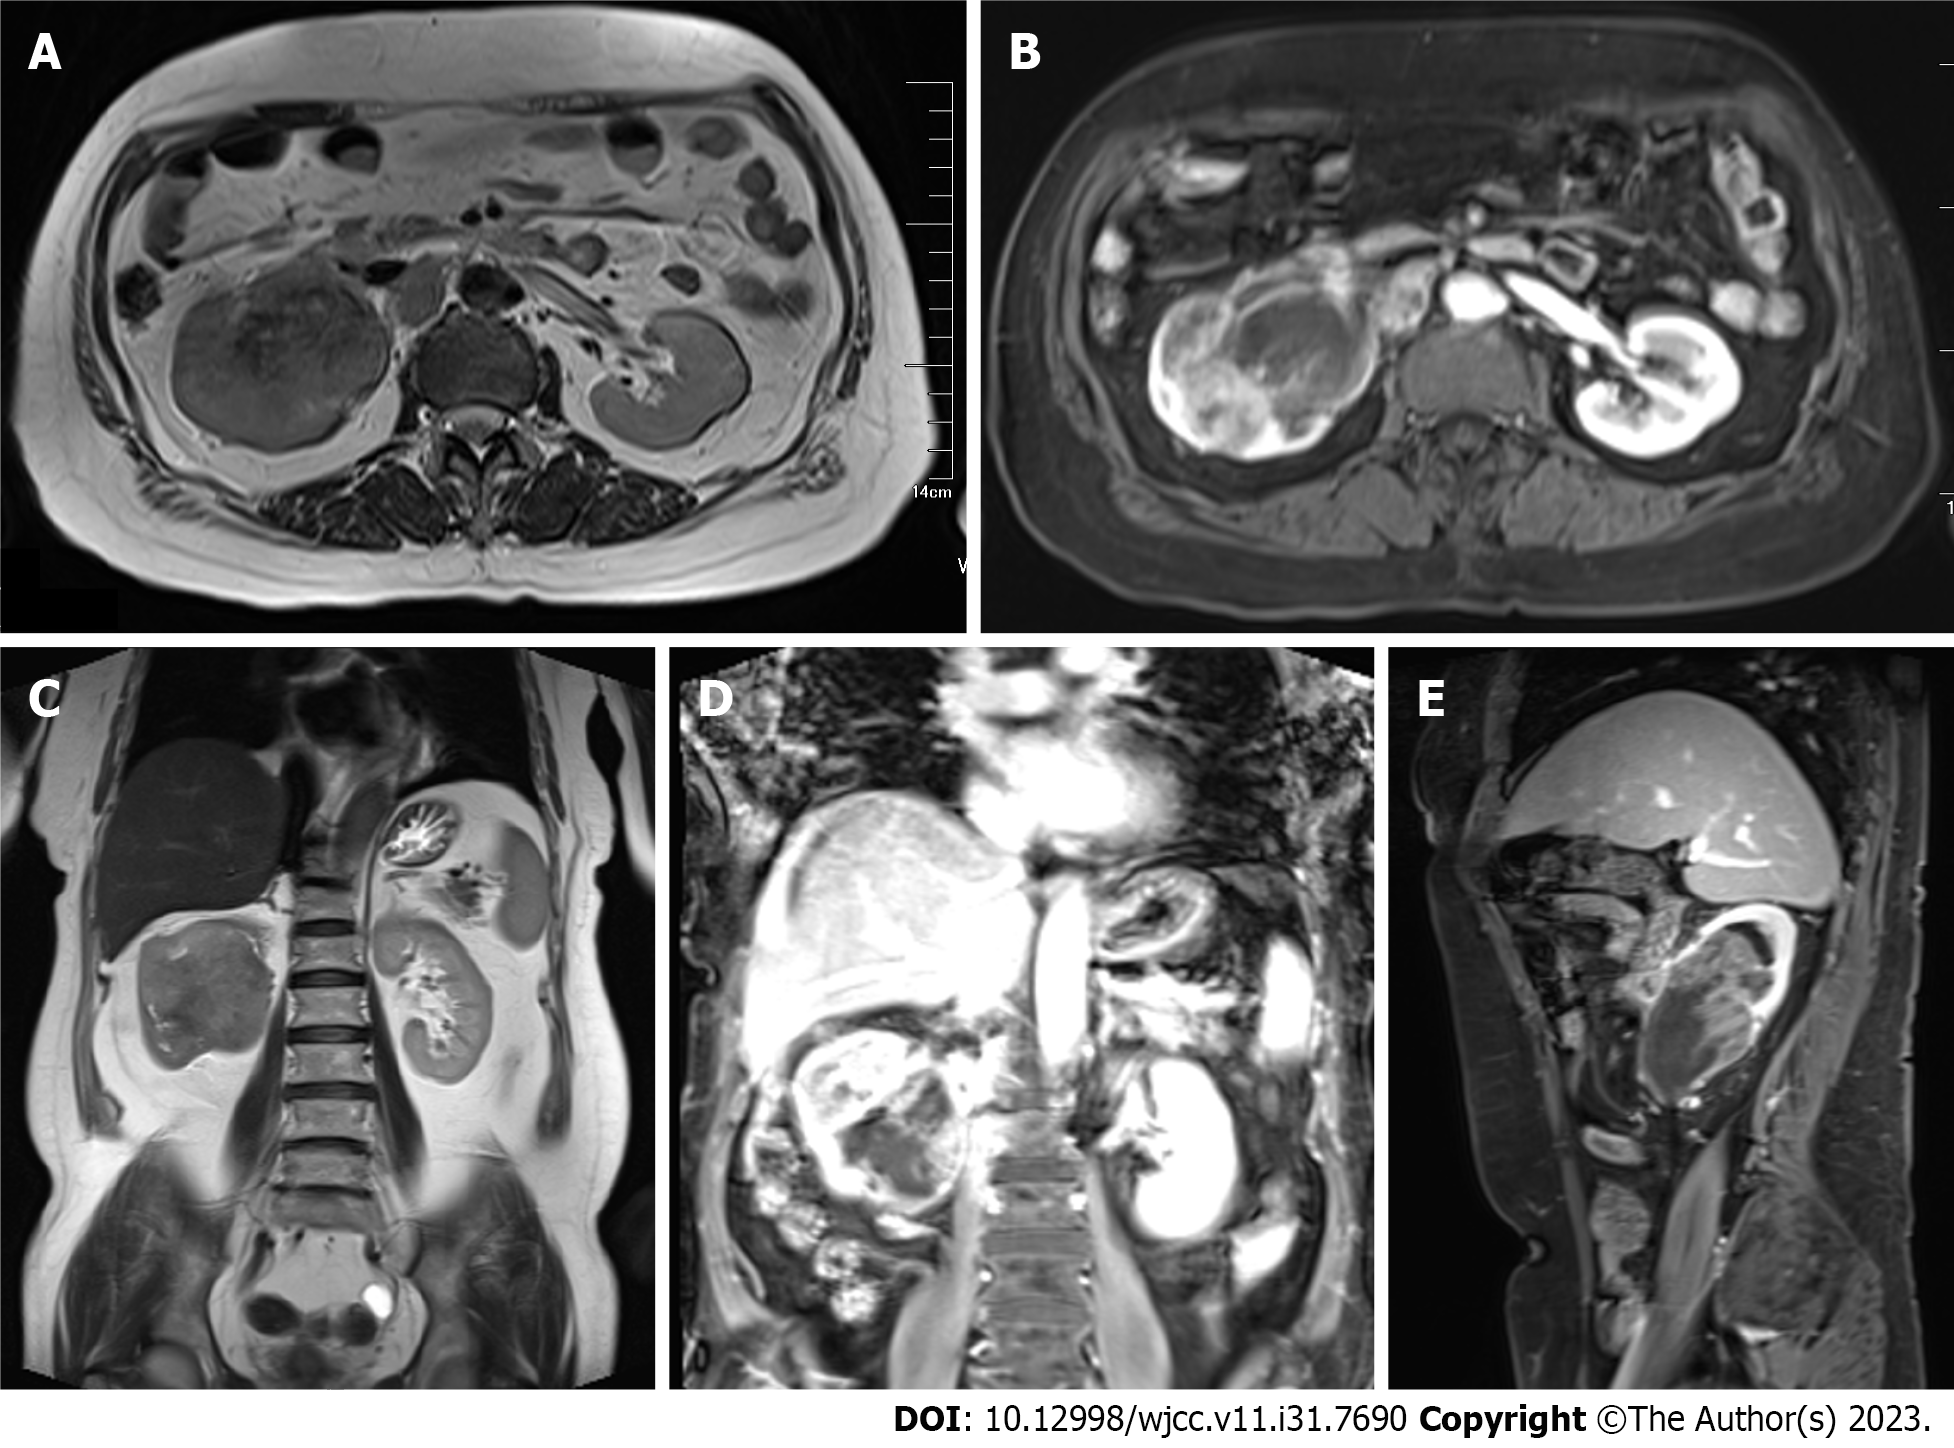
Figure 3 Unenhanced and enhanced magnetic resonance imaging.
A: T2 cross-section; B: T1 cross-section; C: T2 coronal-section; D: Enhanced magnetic resonance imaging (MRI) coronal-section; E: Enhanced MRI sagittal-section.
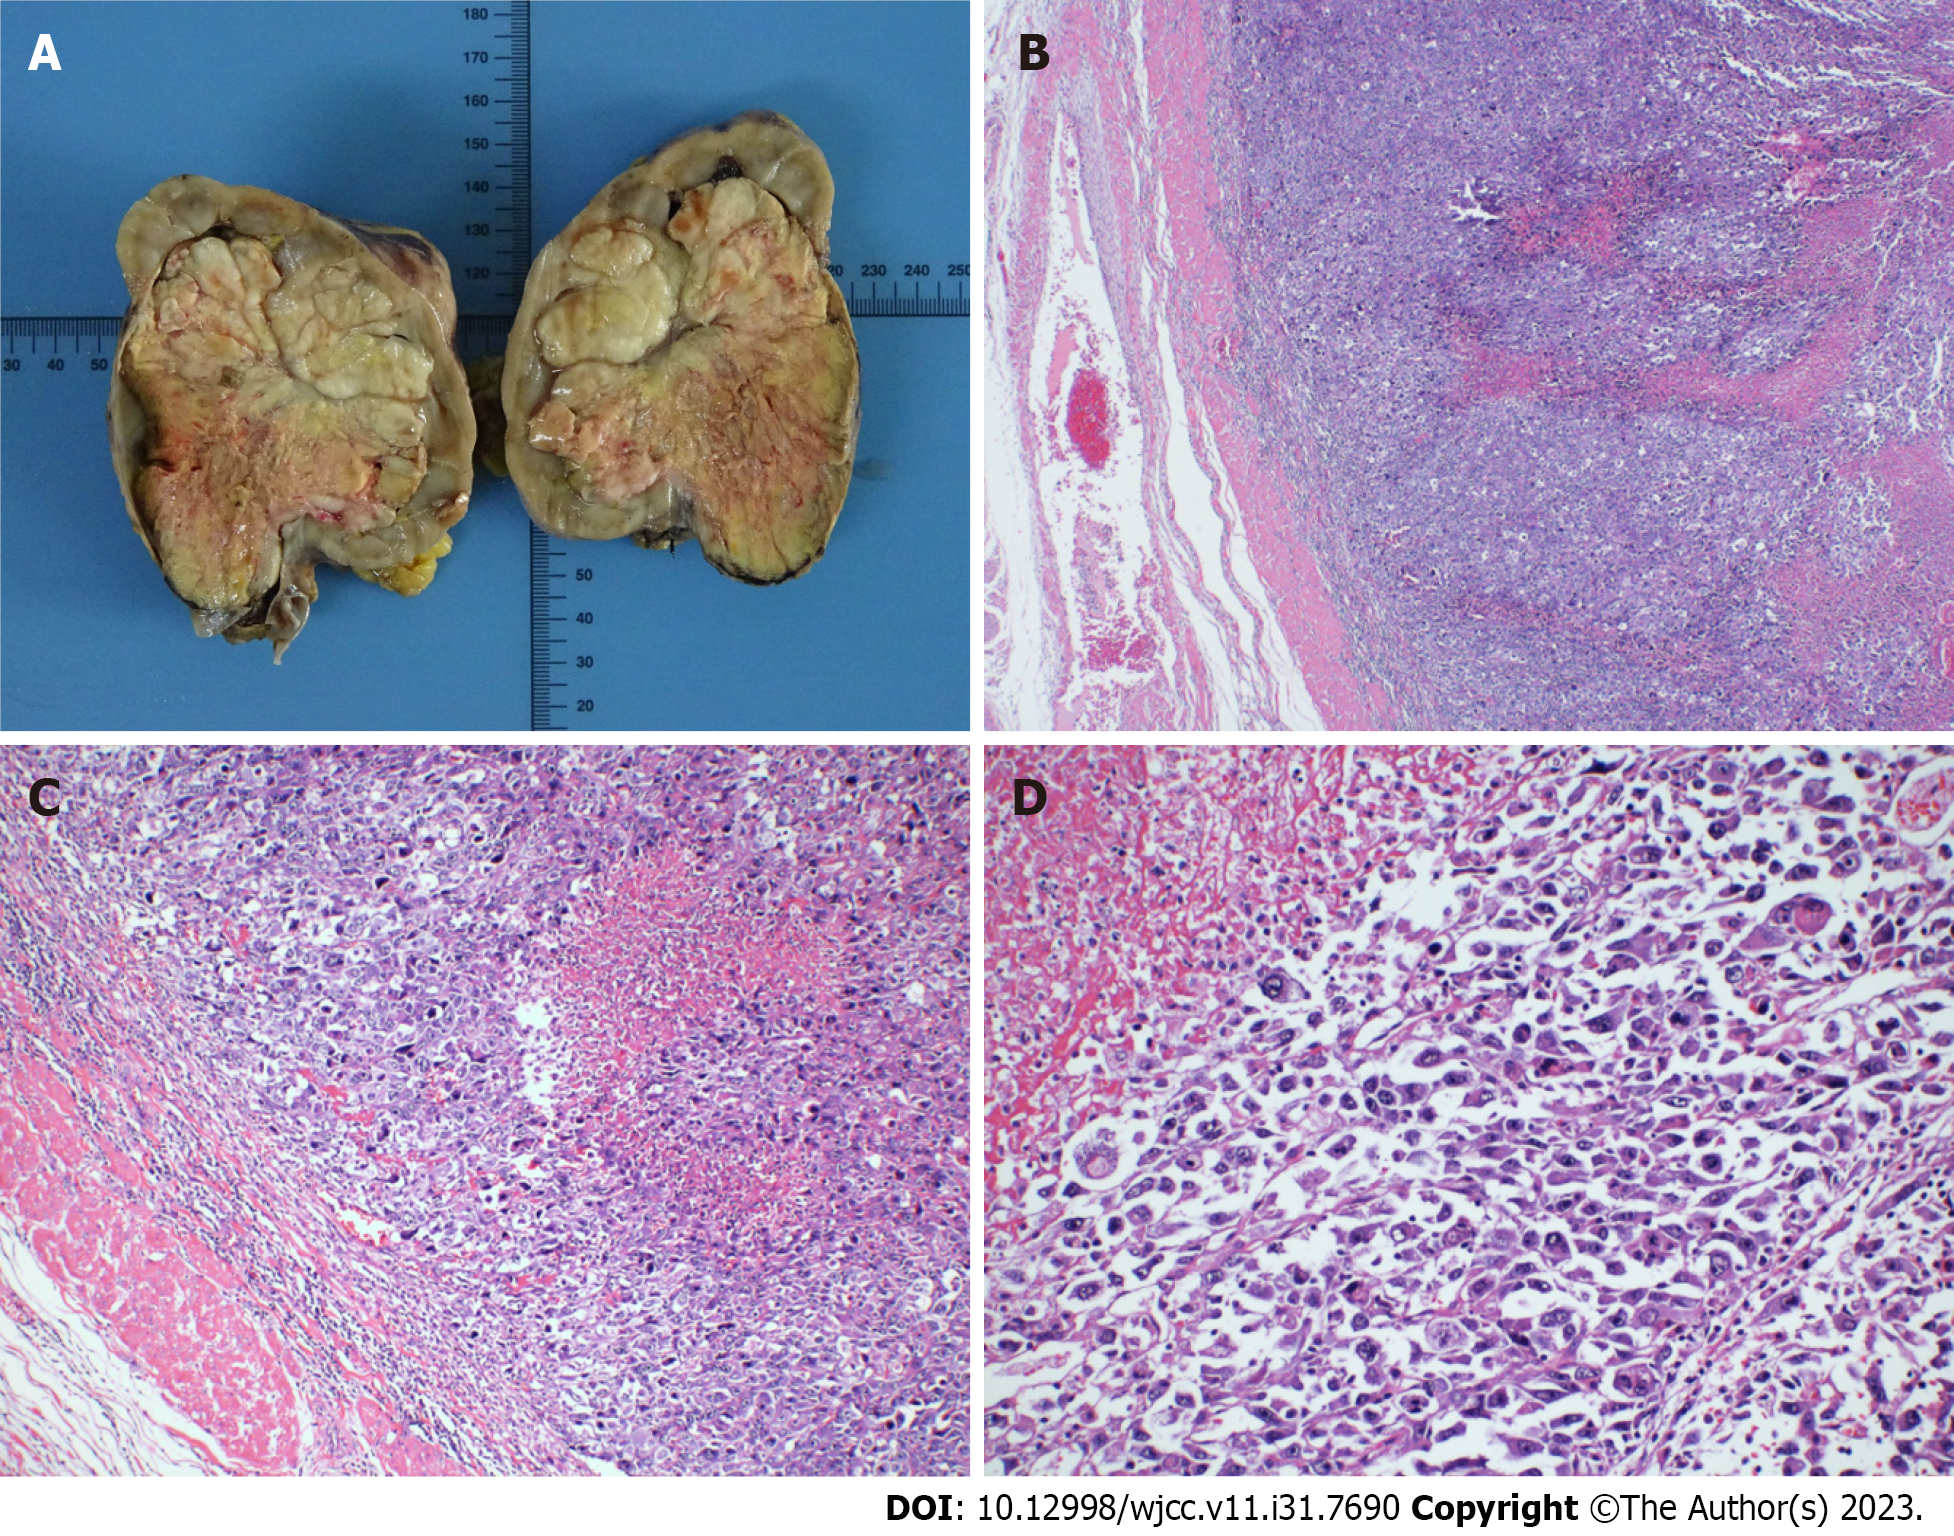
Figure 4 Gross morphology of the tumor and HE staining results.
A: Gross morphology; B-D: HE staining images at 40 × (B), 100 × (C), and 200 × (D).
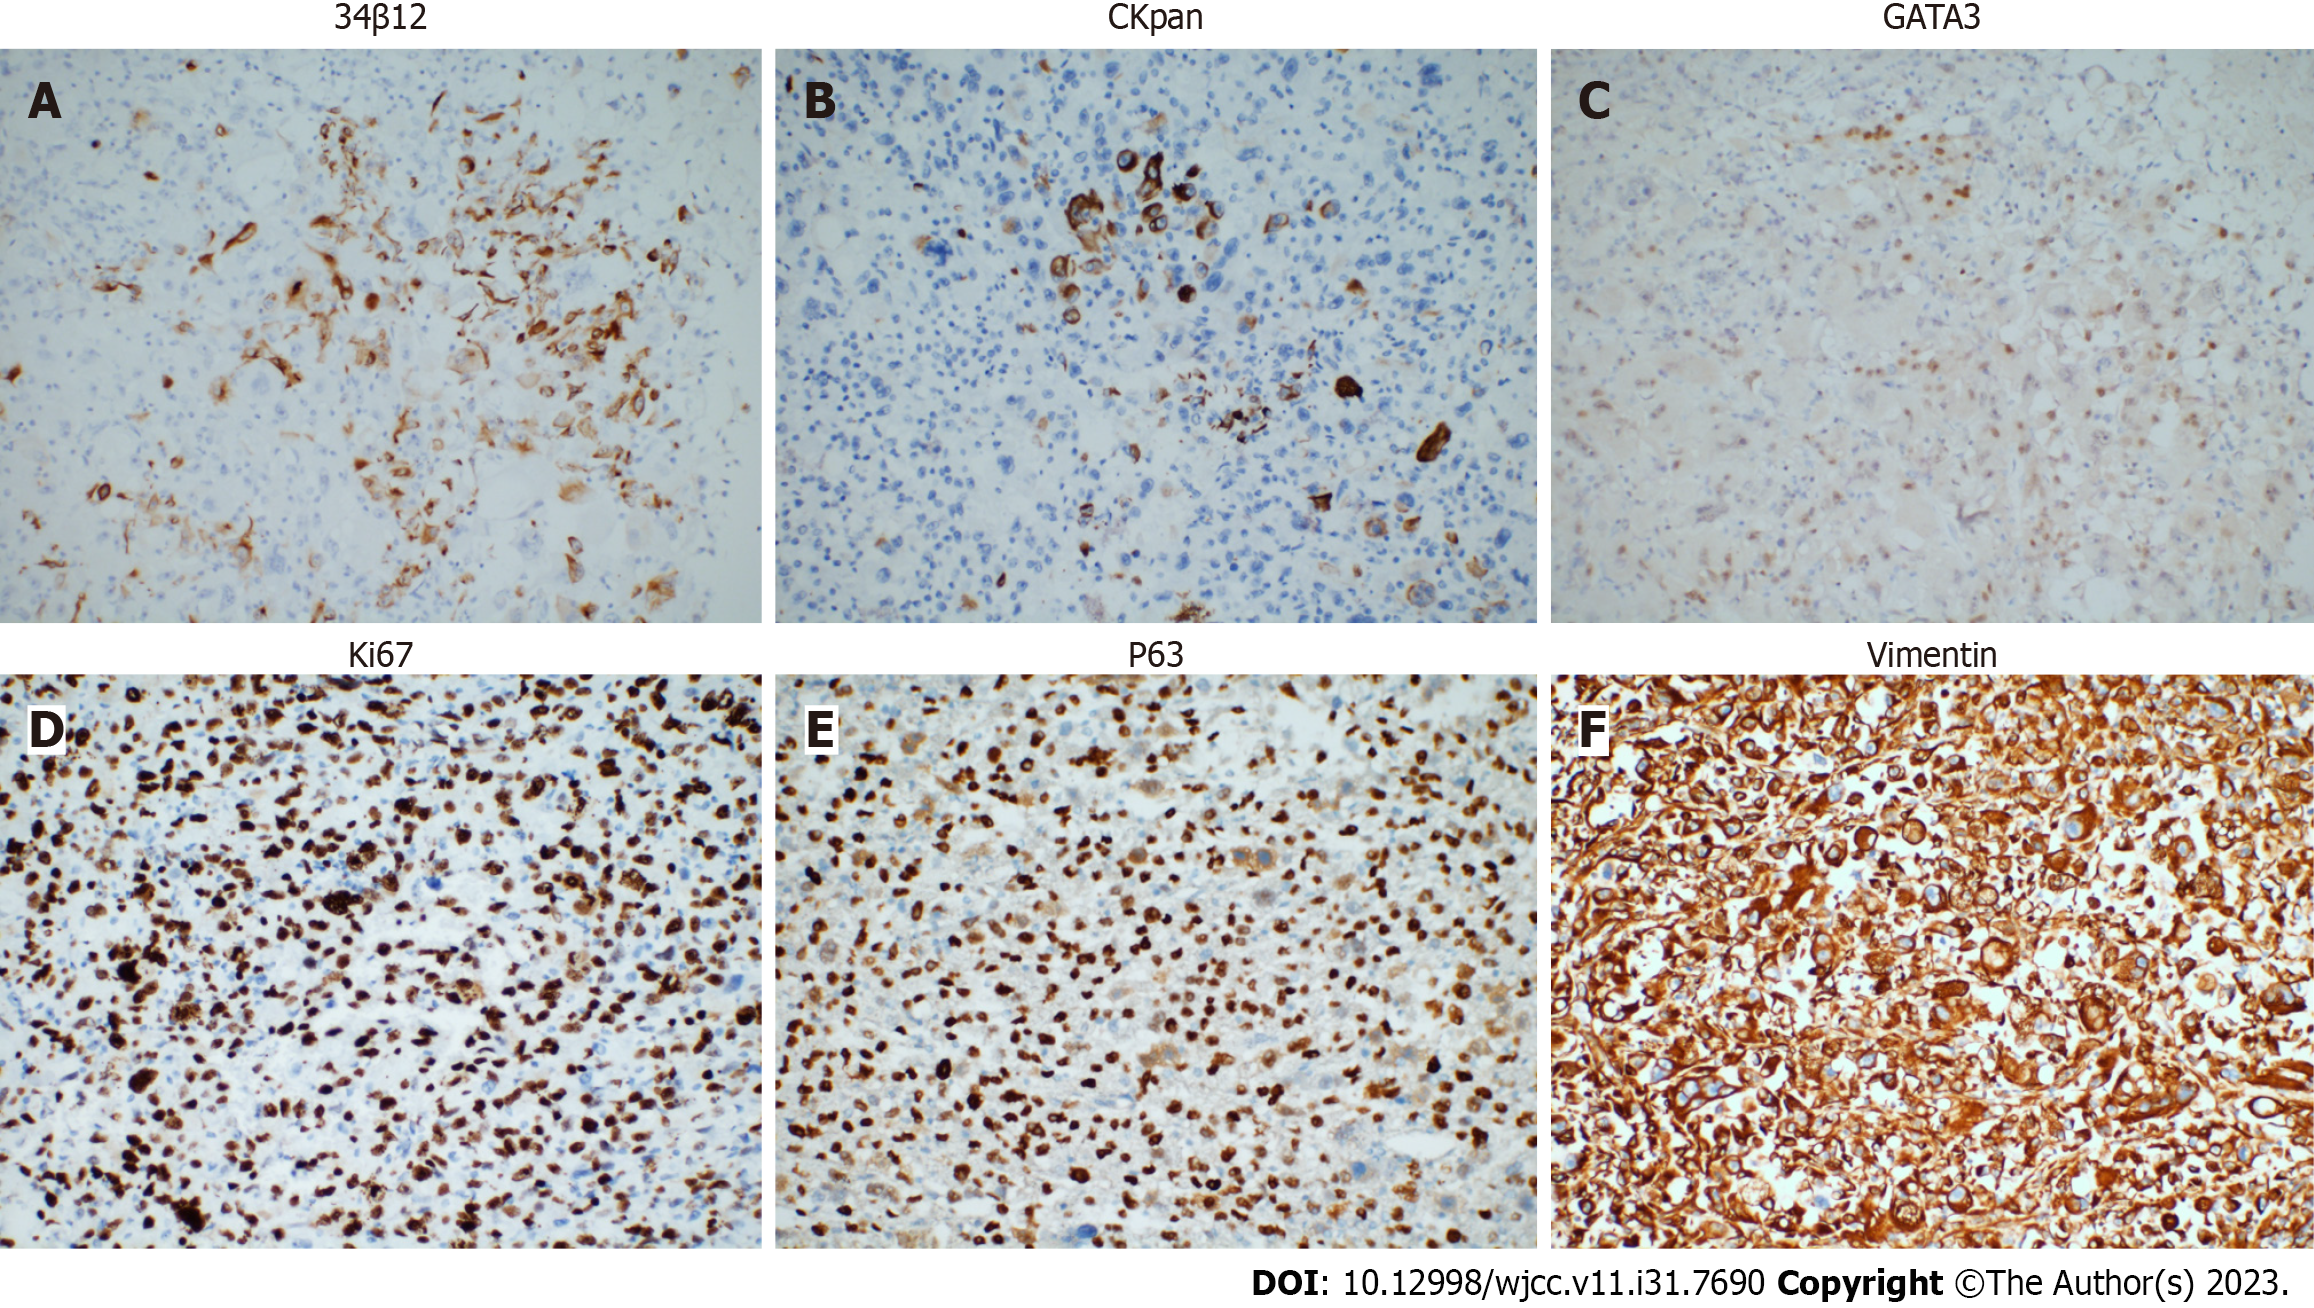
Figure 5 Immunohistochemical staining results.
A: 34β12; B: CKpan; C: GATA3; D: Ki67; E: P63; F: Vimentin. Magnification: 200 ×.
- Citation: Guan HY, Wang J, Wang JX, Chen QH, Lu J, He L. Renal pelvis sarcomatoid carcinoma with renal vein tumor thrombus: A case report and literature review. World J Clin Cases 2023; 11(31): 7690-7698
- URL: https://www.wjgnet.com/2307-8960/full/v11/i31/7690.htm
- DOI: https://dx.doi.org/10.12998/wjcc.v11.i31.7690


