Copyright
©The Author(s) 2023.
World J Clin Cases. Nov 6, 2023; 11(31): 7593-7609
Published online Nov 6, 2023. doi: 10.12998/wjcc.v11.i31.7593
Published online Nov 6, 2023. doi: 10.12998/wjcc.v11.i31.7593
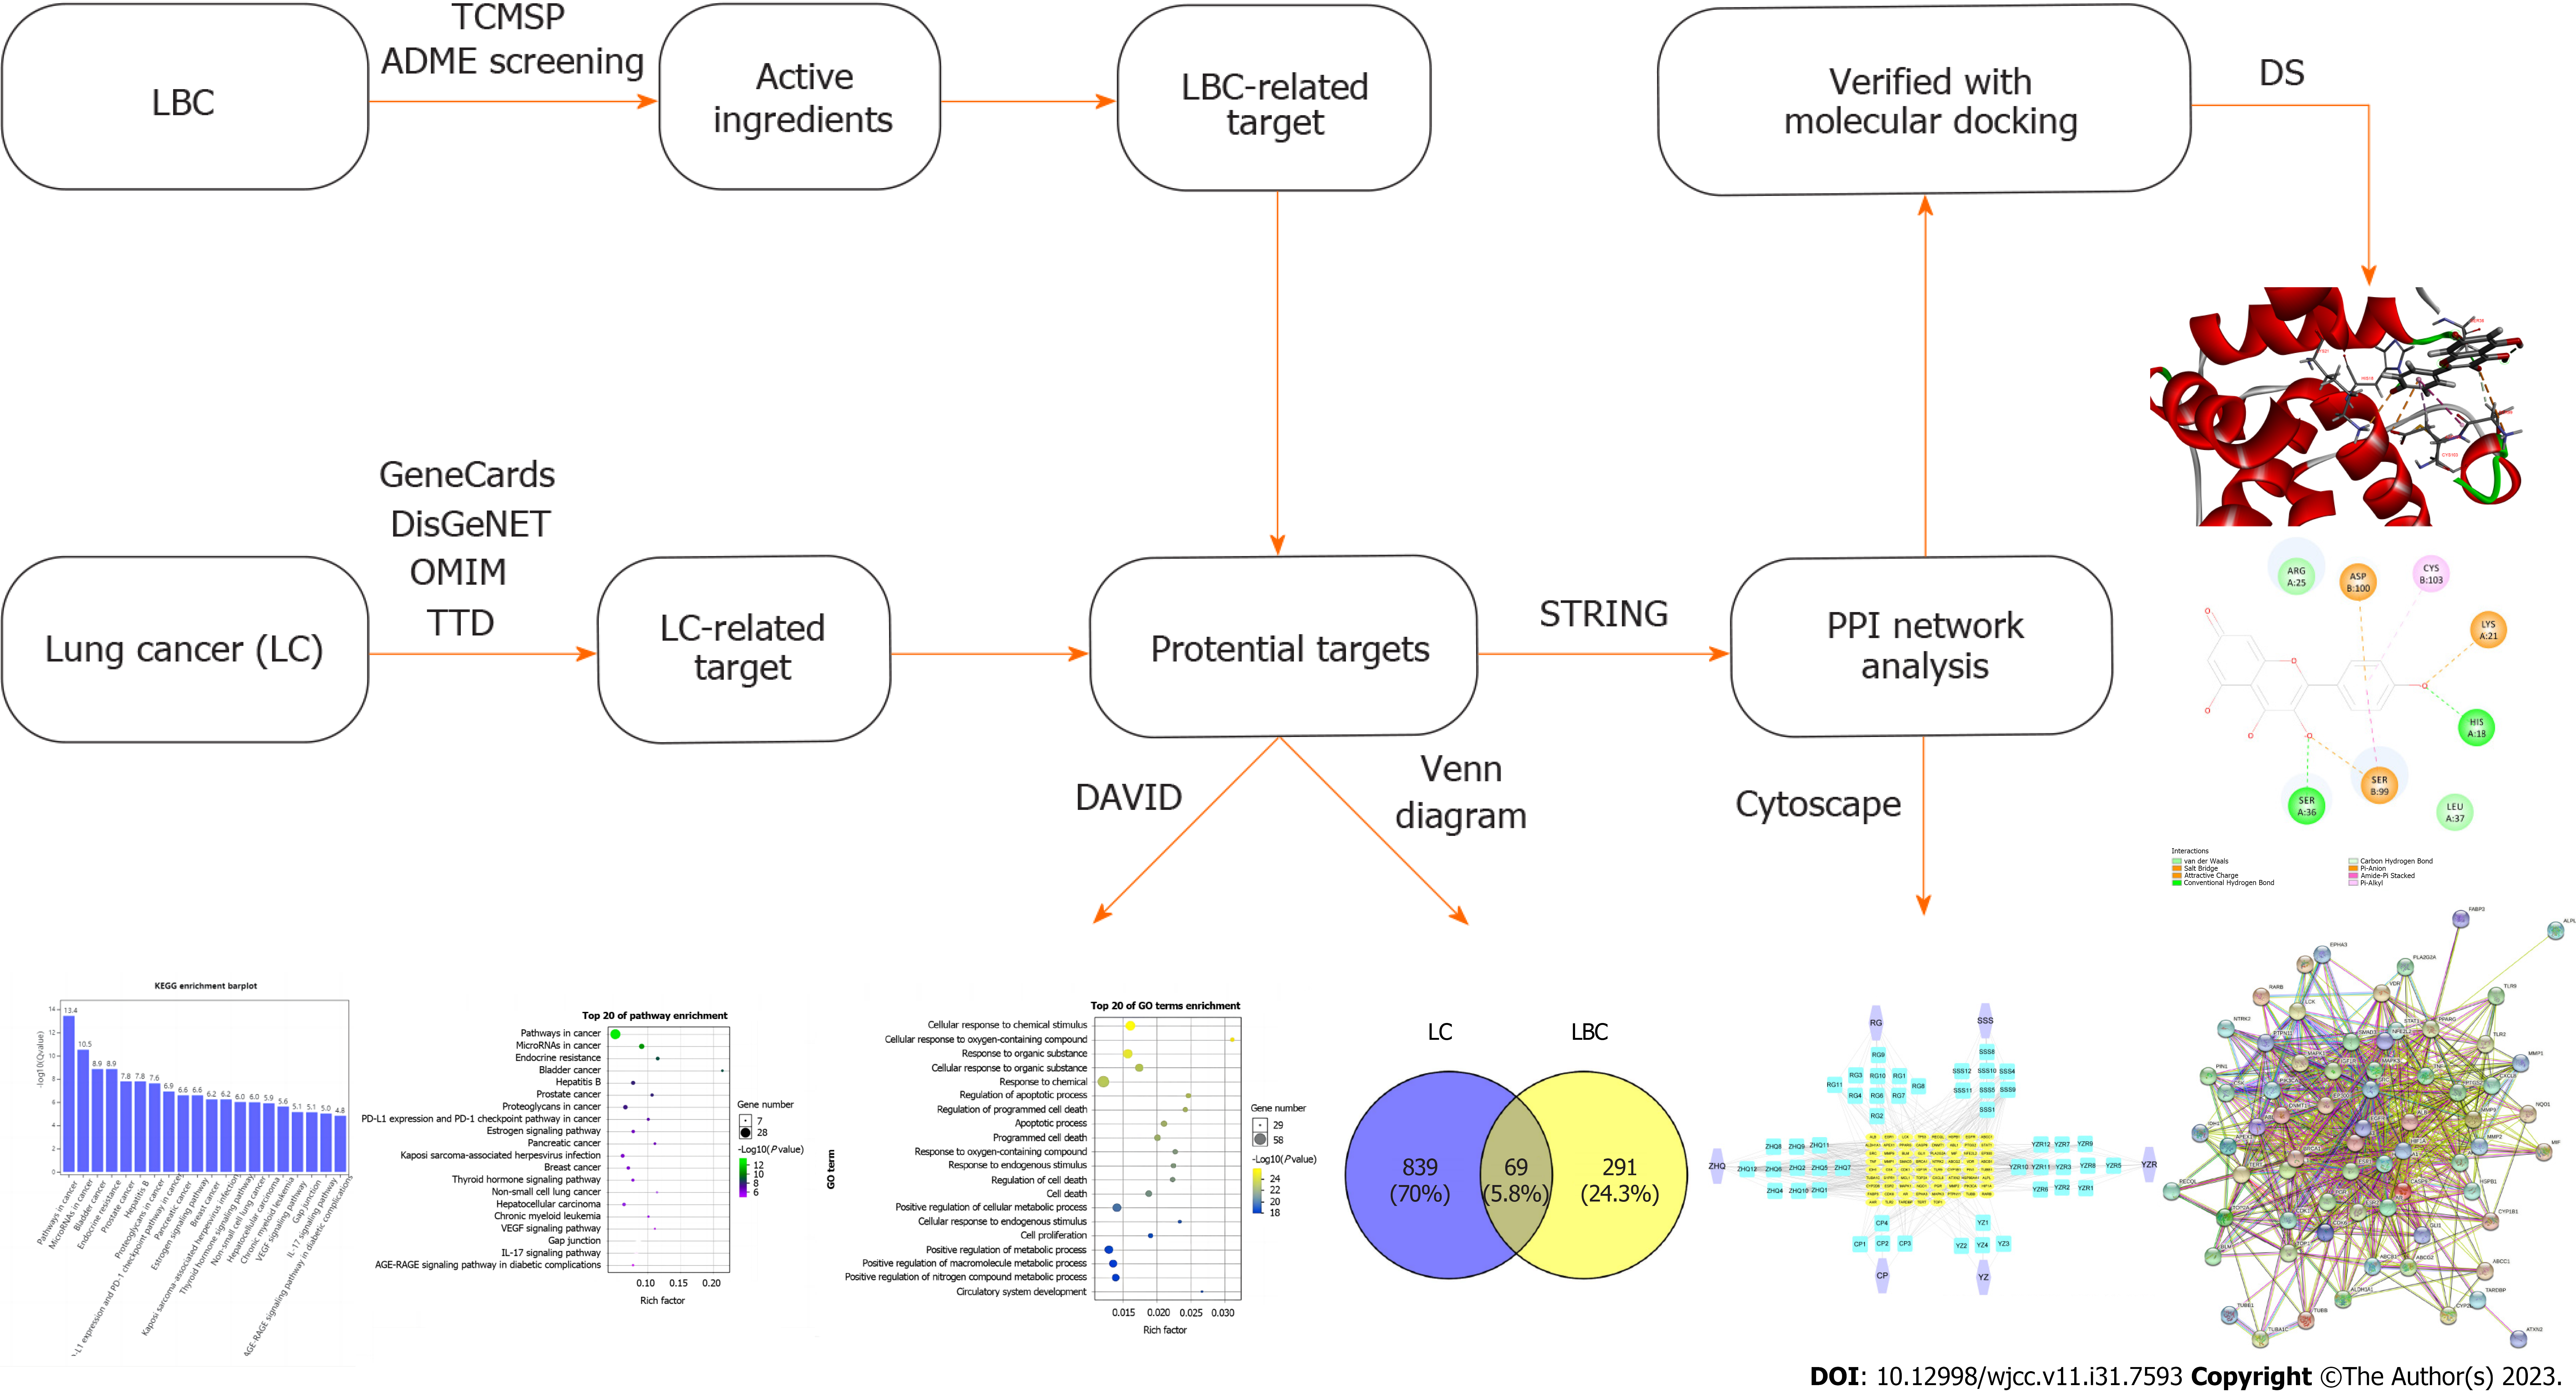
Figure 1 Workflow diagram for assessing the treatment of lung cancer using Liu-Wei-Bu-Qi capsule.
LBC: Liu-Wei-Bu-Qi capsule; LC: Lung cancer; TCMSP: Traditional Chinese Medicine Systems Pharmacology; ADME: Absorptio, Distribution, Metabolism, Excretion; DS: Discovery Studio; TTD: Therapeutic Target Database; OMIM: Online mendelian inheritance in man; DAVID: Database for Annotation, Visualization and Integrated Discovery; STRING: Search tool for the retrieval of interacting genes; PPI: Protein-protein interaction.
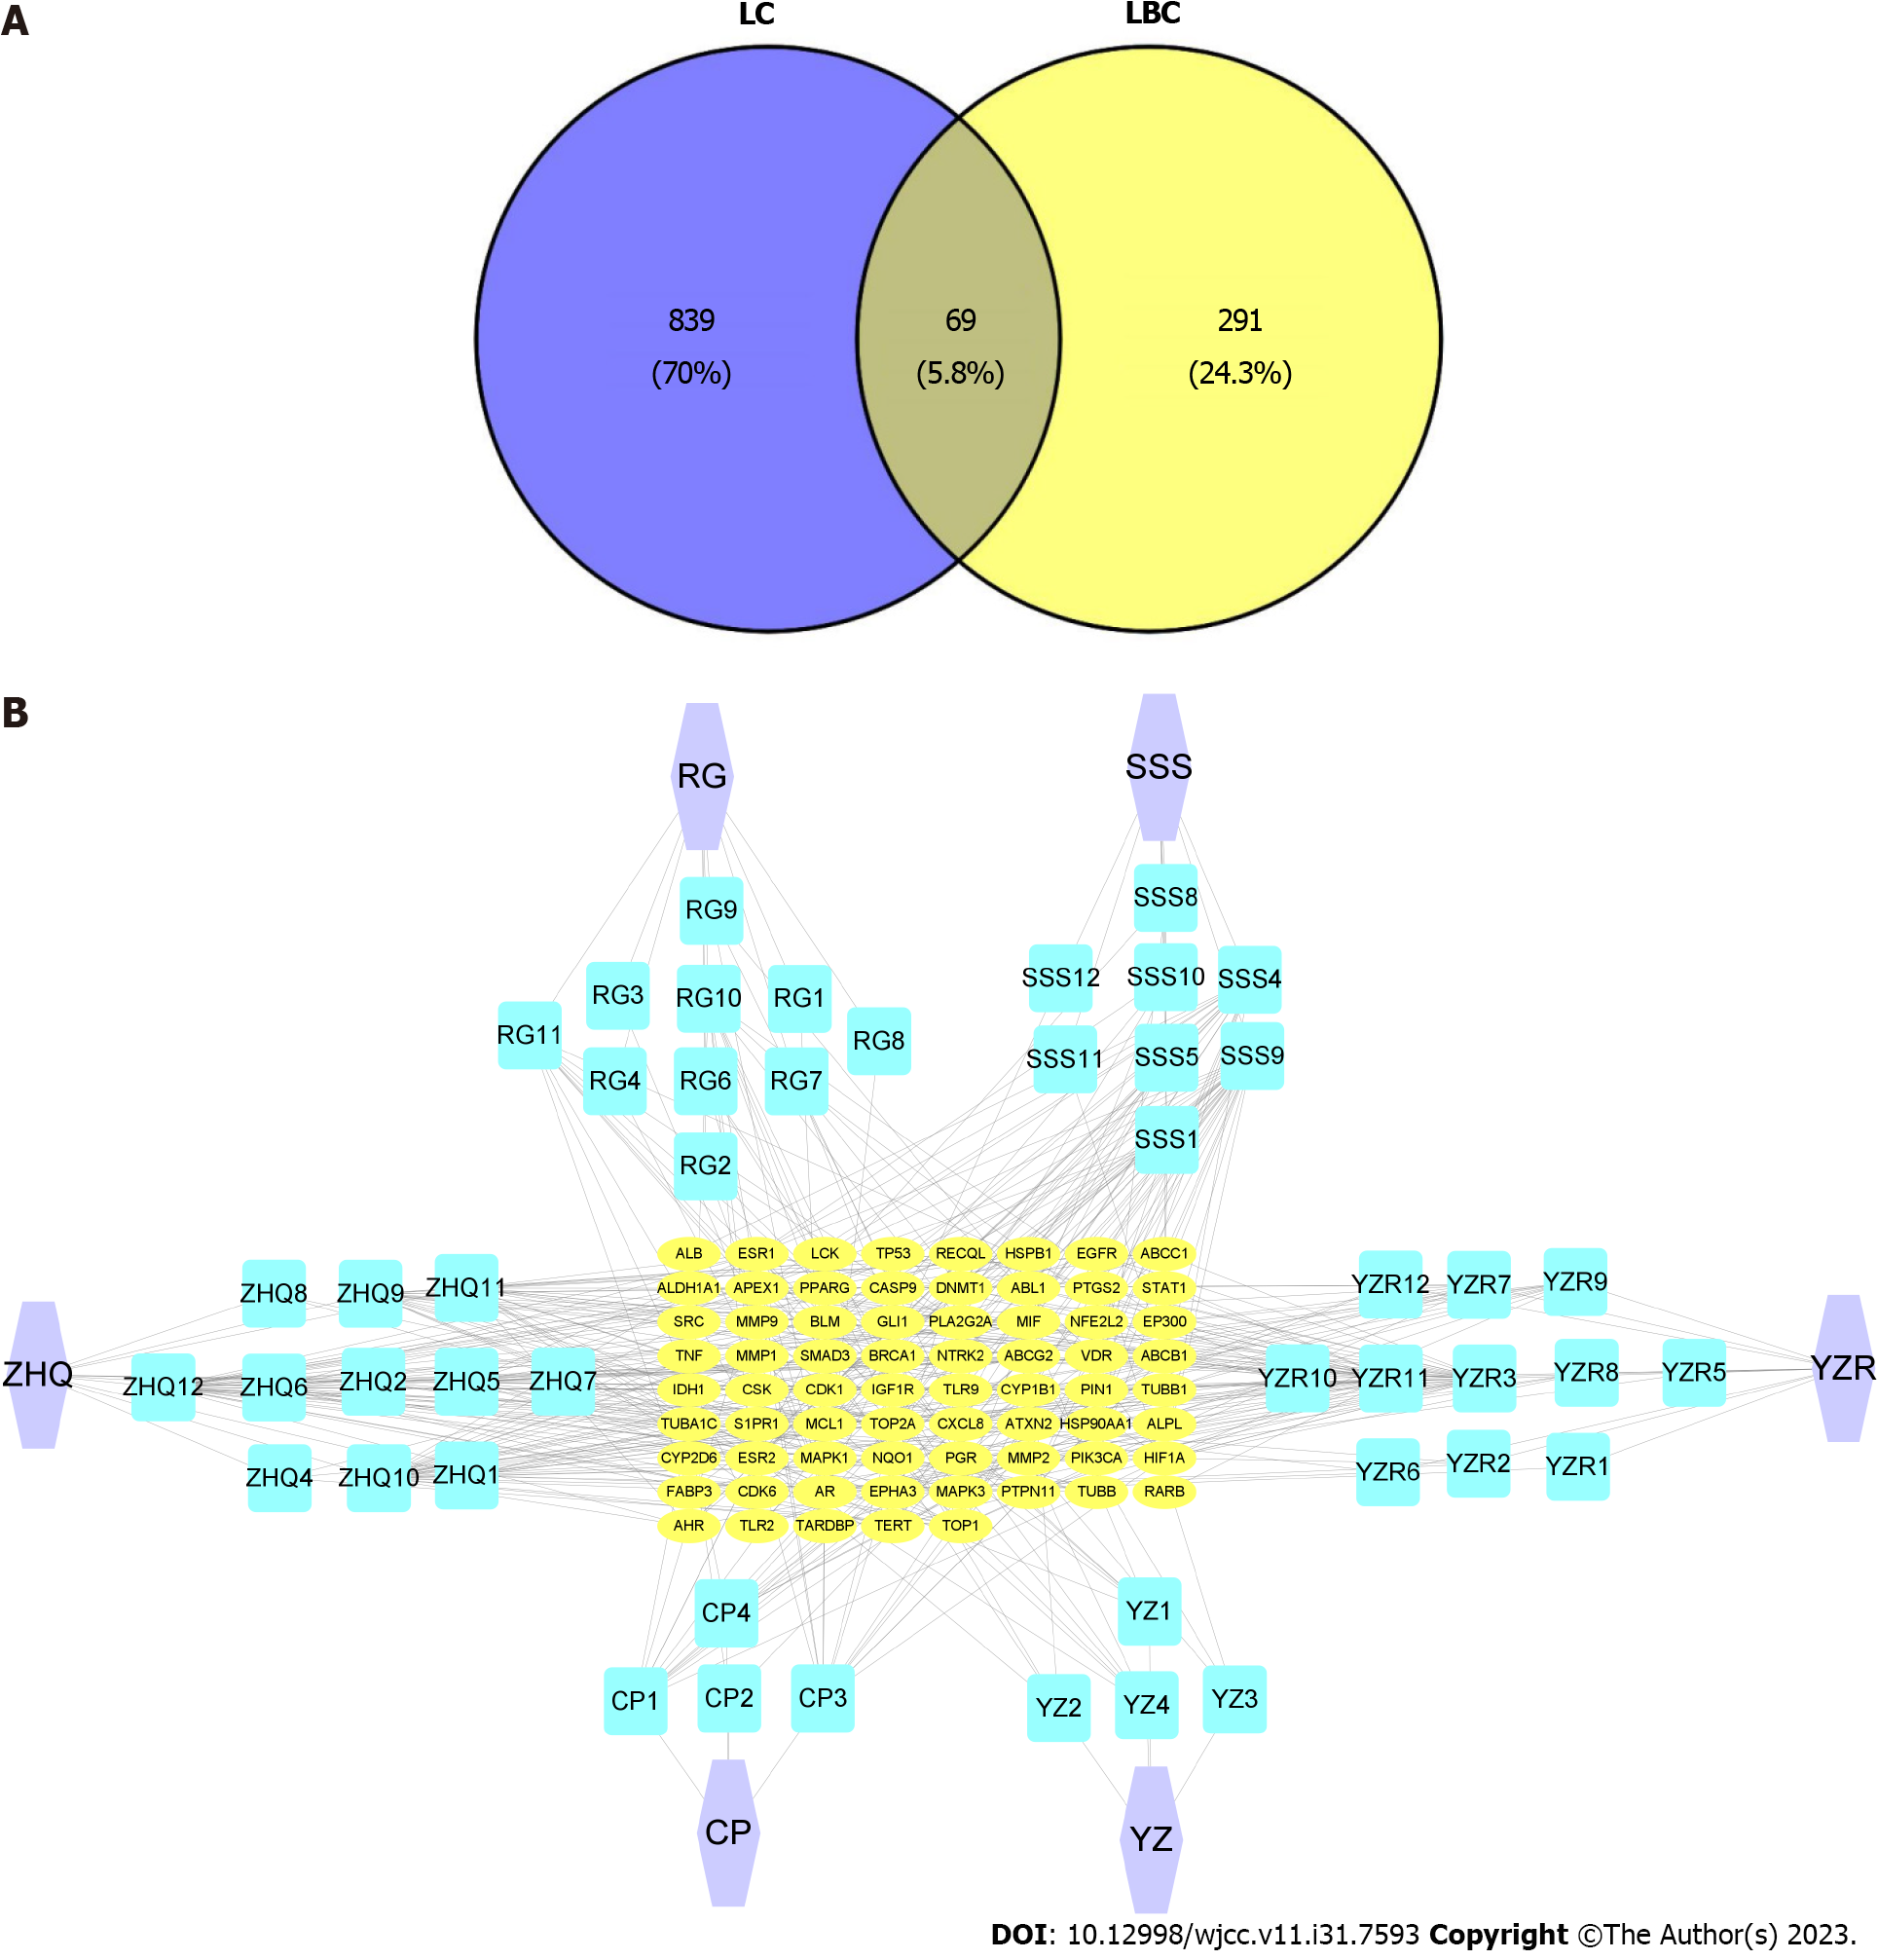
Figure 2 Interaction network diagram of Liu-Wei-Bu-Qi capsule-based treatment of lung cancer.
A: The Venn diagram of targets that overlapped between lung cancer-related and active ingredient-related targets; B: The ‘Herbs-Ingredients-Targets’ interaction network. Purple hexagons indicate Chinese herbs, blue squares indicate ingredients; yellow ovals indicate targets. LC: Lung cancer; LBC: Liu-Wei-Bu-Qi capsule; RG: Rou-Gui; SSS: Sheng-Shai-Shen; ZHQ: Zhi-Huang-Qi; YZR: Yi-Zhi-Ren; YZ: Yu-Zhu; CP: Chen-Pi.
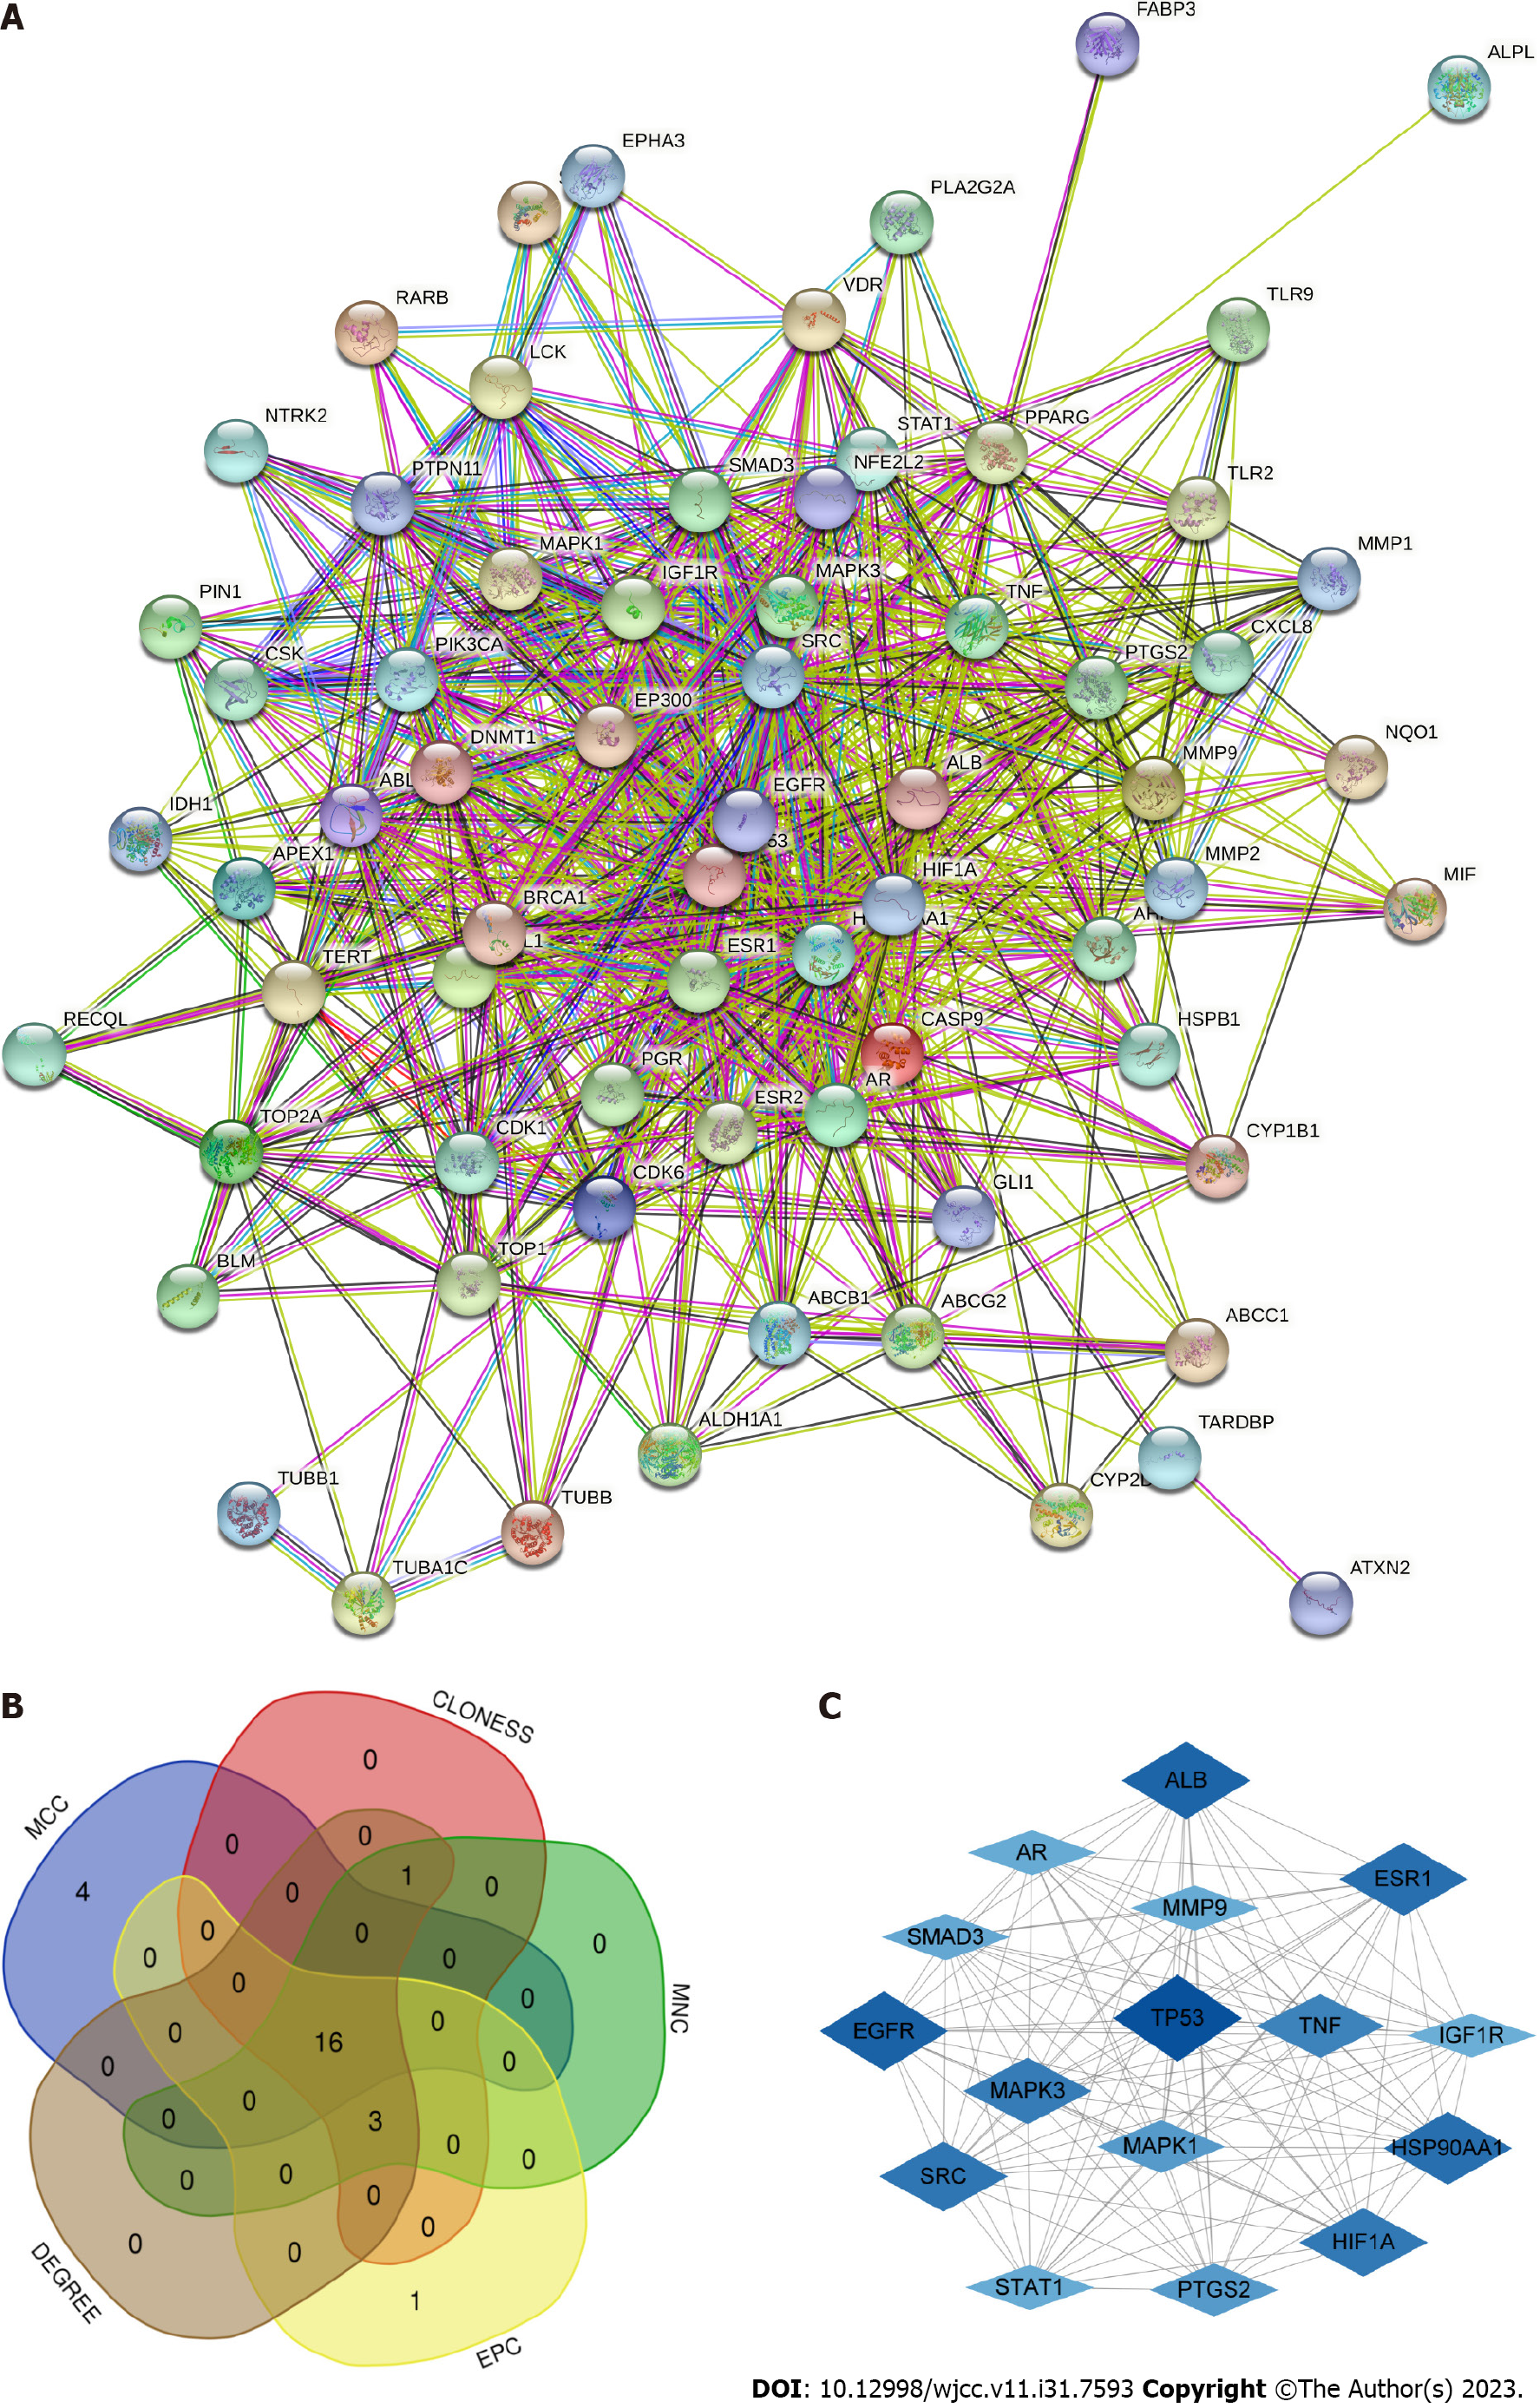
Figure 3 Protein-Protein Interaction Network.
A: All target protein interaction networks; B: Venn diagram based on five parameters; C: The network of hub targets.
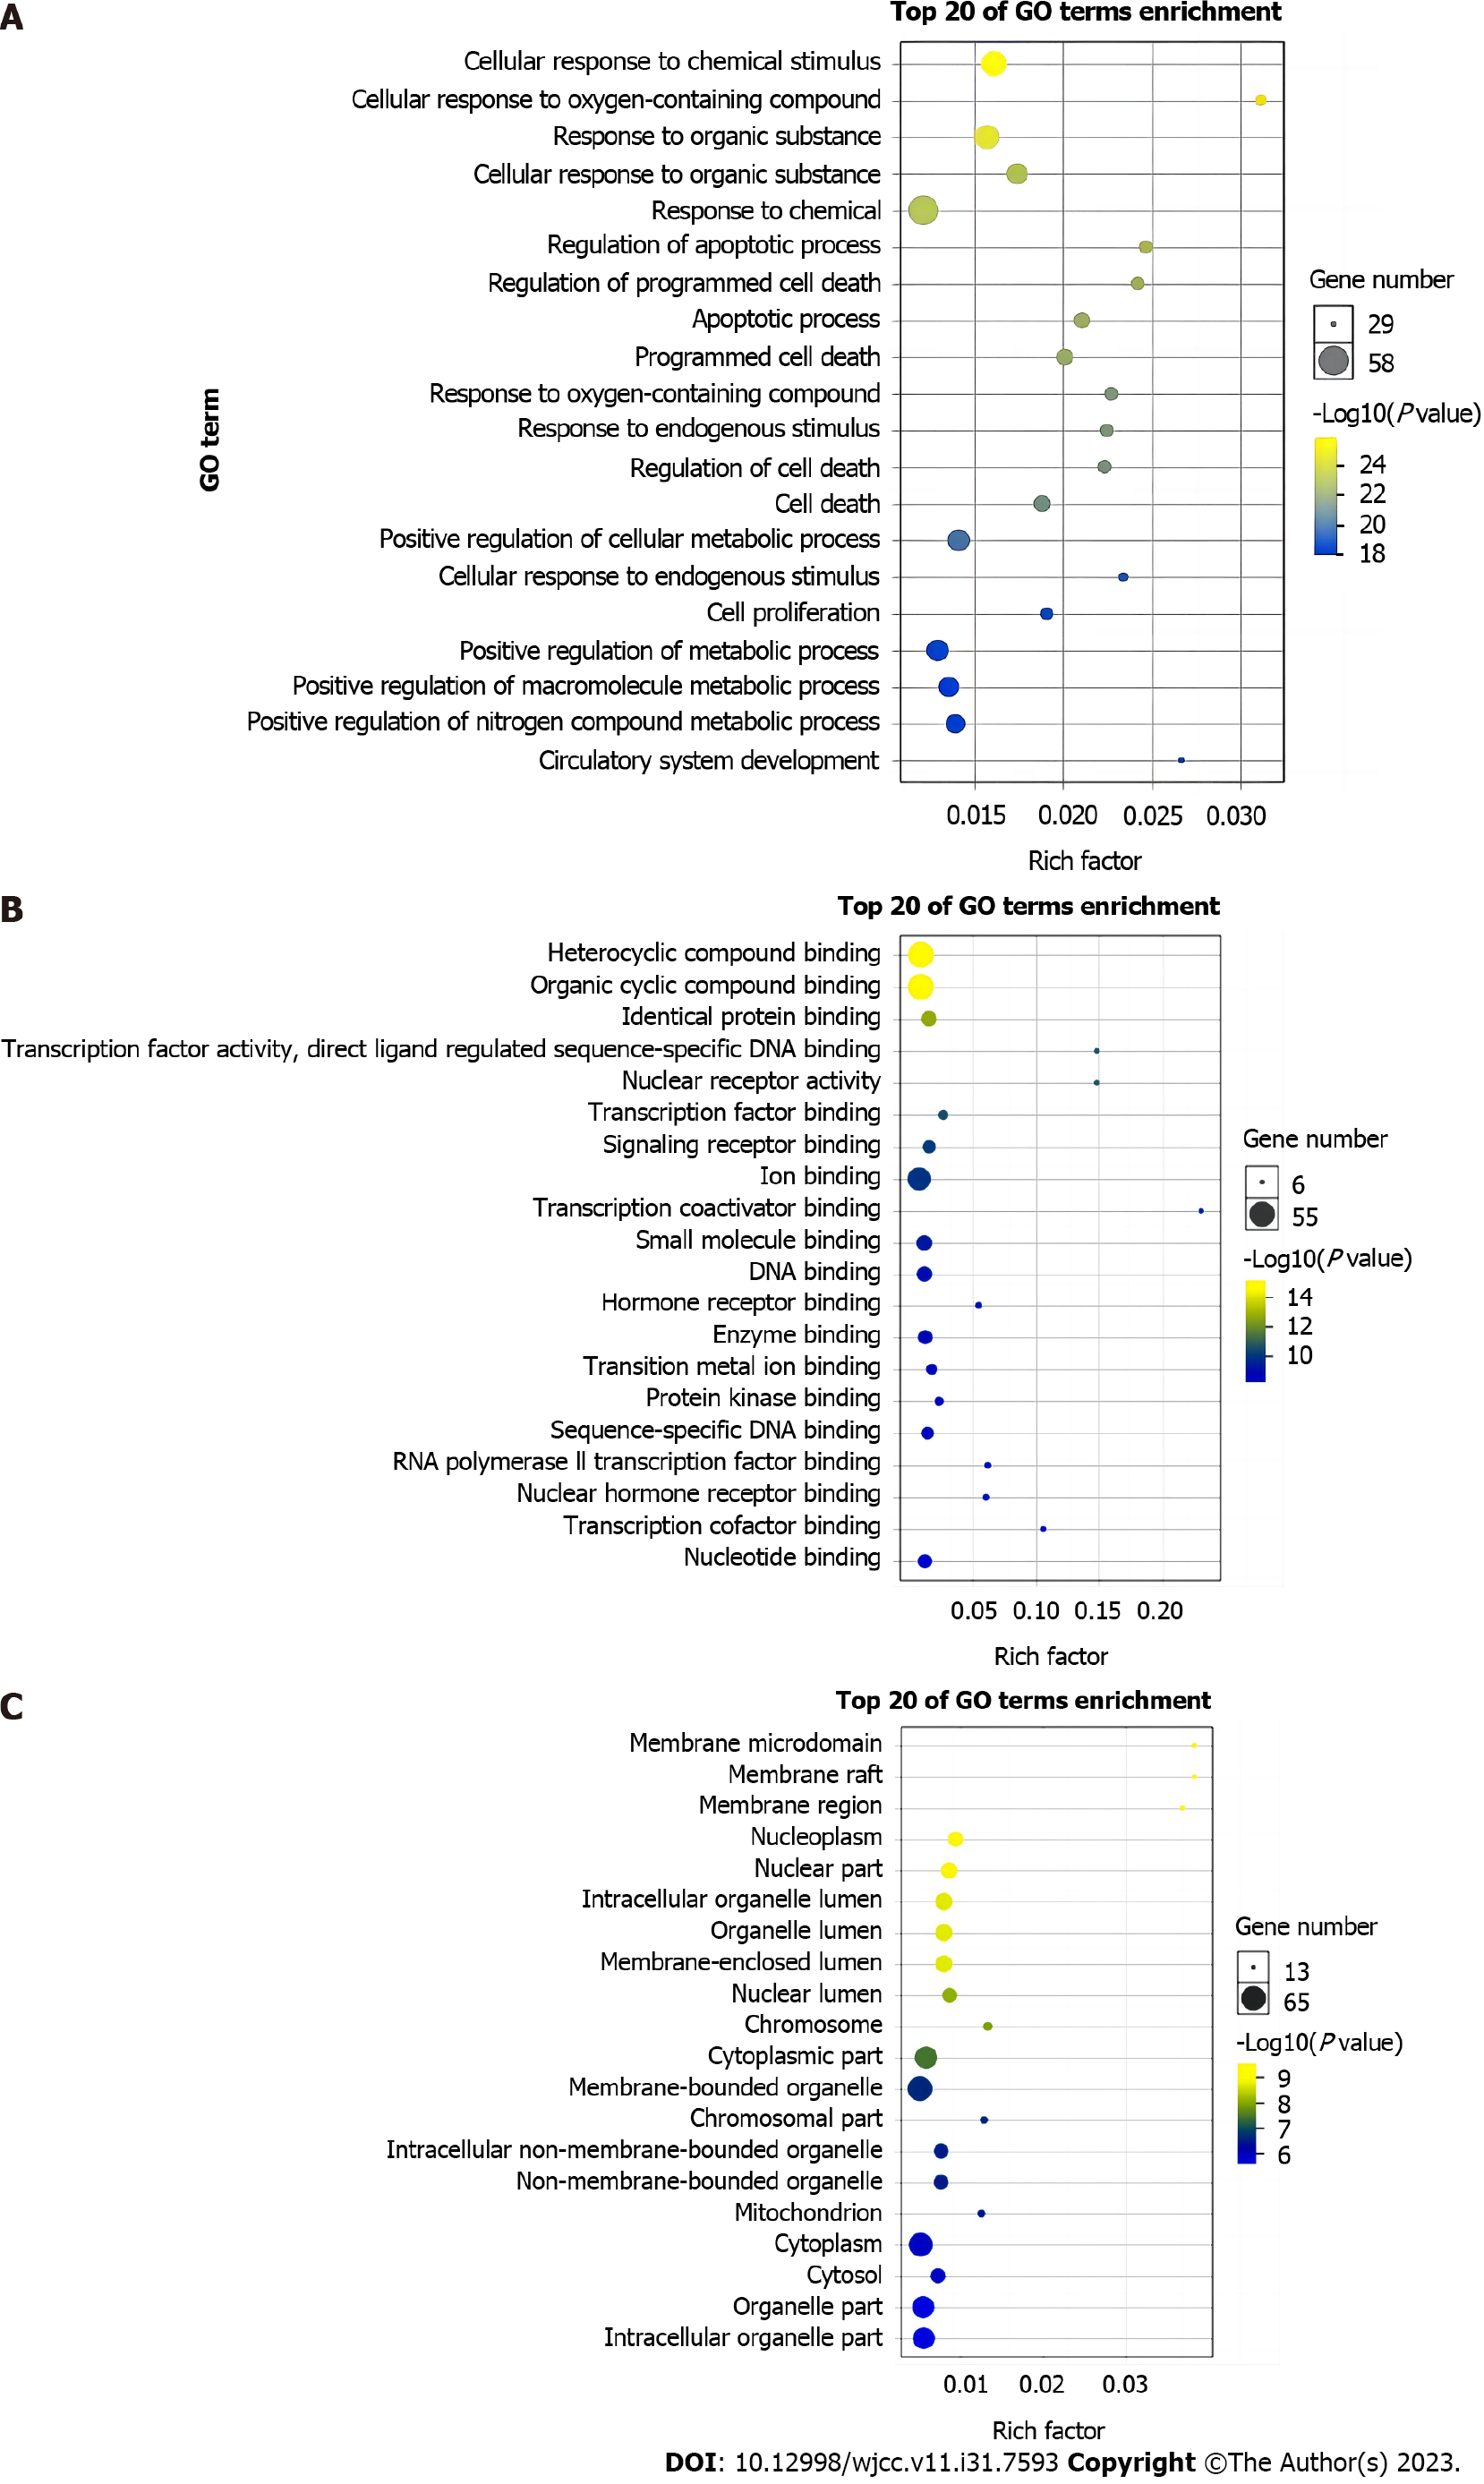
Figure 4 Gene Ontology enrichment results.
A: Key terms of biological processes analysis results; B: Key terms of molecular functions analysis results; C: Key terms of cellular components analysis results. DNA: Deoxyribonucleic acid; RNA: Ribonucleic acid.
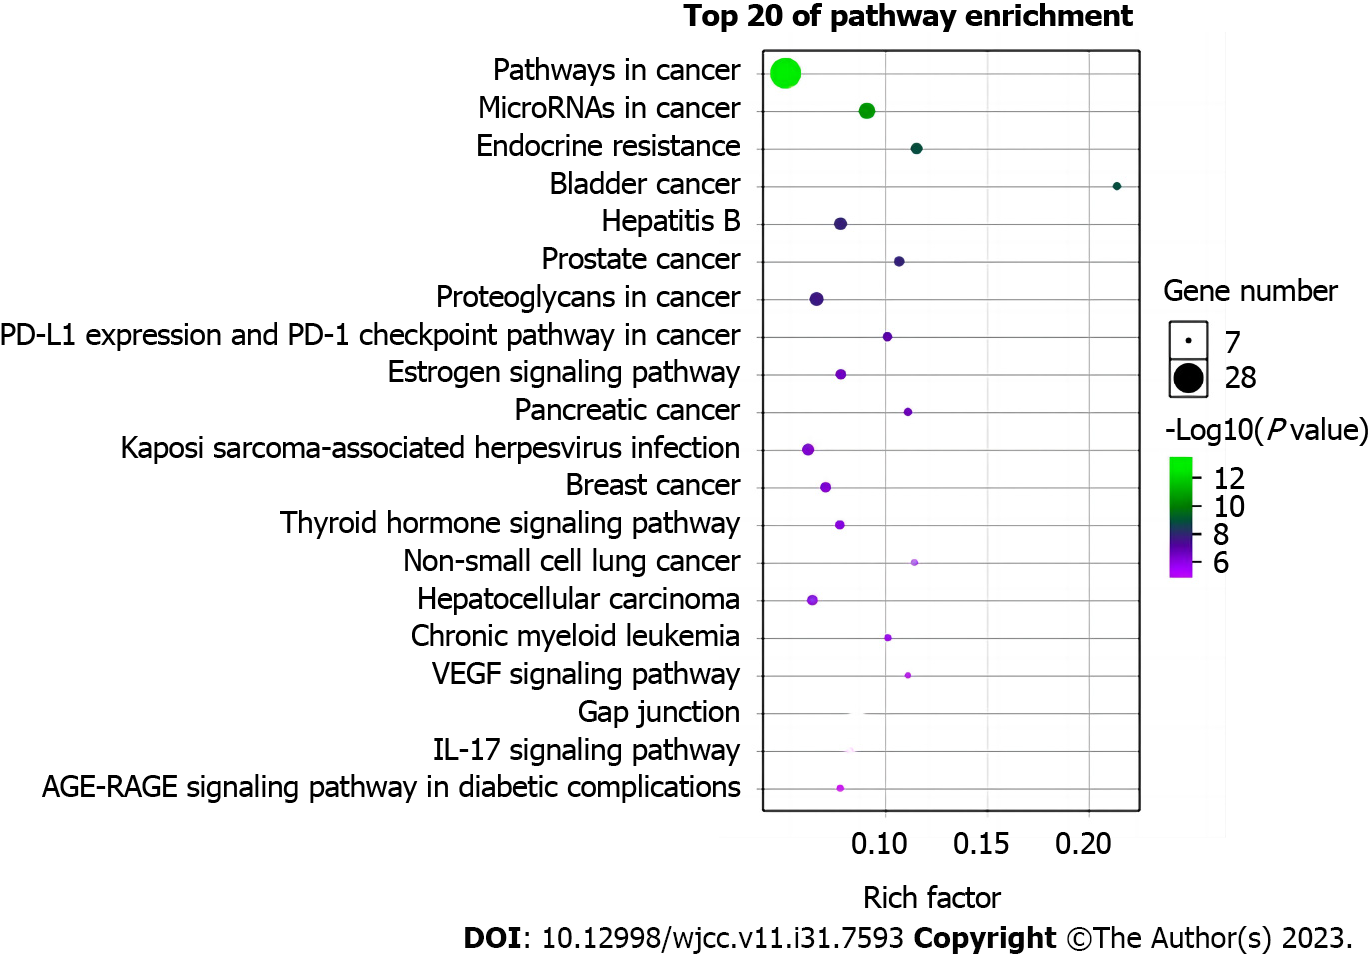
Figure 5 Kyoto Encyclopedia of Genes and Genomes pathway enrichment diagram.
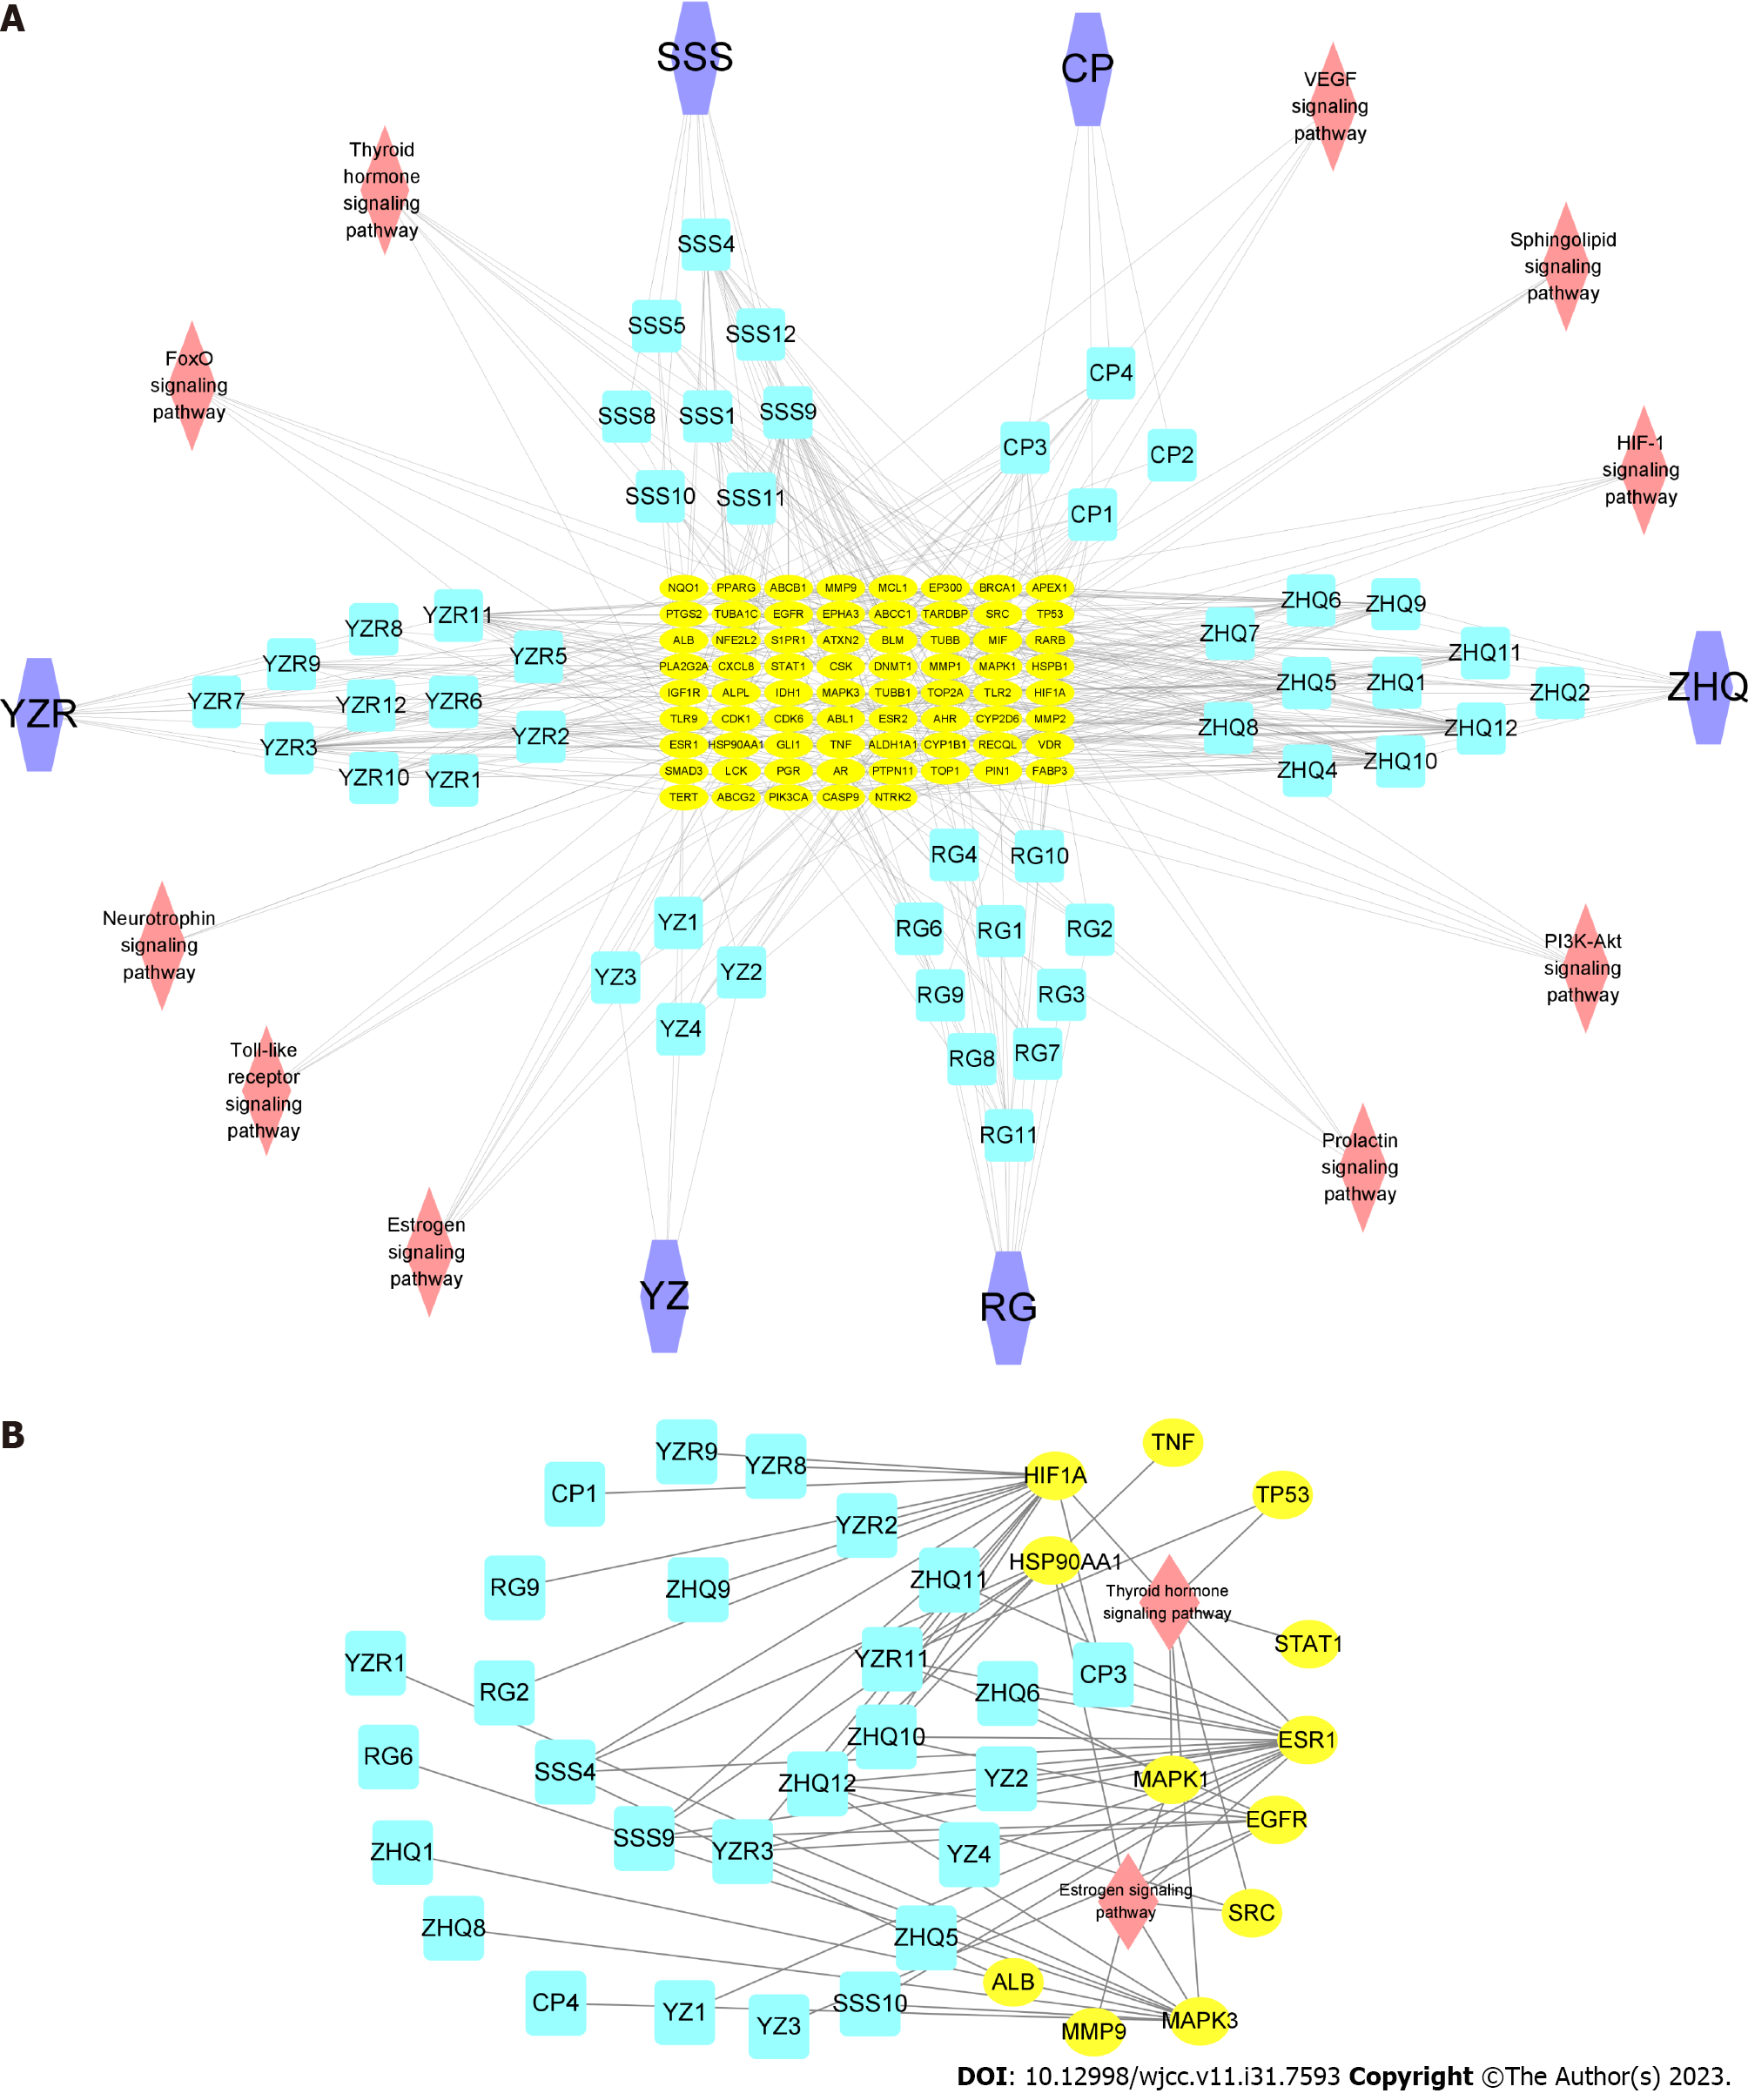
Figure 6 ‘Ingredients-Target-Pathway’ network.
A: “Liu-Wei-Bu-Qi capsule-ingredient-target-pathway” network, B: “Key target-ingredient-pathway” network. Purple hexagons indicate a single herb, blue squares indicate ingredients, yellow ovals indicate targets, and red diamonds indicate pathways.
Figure 7 Molecular docking simulations of targets and compounds.
A: Docking of HIF1A and kaempferol; B: Docking of HIF1A and quercetin; C: Docking of MAPK1 and formononetin; D: Docking of SRC and quercetin; E: Docking of TNF and quercetin; F: Docking of MAPK3 and quercetin; G: Docking of HSP90AA1 and kaempferol; H: Docking of HSP90AA1 and quercetin; I: Docking of ALB and dianthramine; J: Docking of TP53 and protocatechuic acid; K: Docking of ESR1and kaempferol; L: Docking of ESR1 and quercetin.
- Citation: Yang Q, Li LY. Network pharmacological and molecular docking study of the effect of Liu-Wei-Bu-Qi capsule on lung cancer. World J Clin Cases 2023; 11(31): 7593-7609
- URL: https://www.wjgnet.com/2307-8960/full/v11/i31/7593.htm
- DOI: https://dx.doi.org/10.12998/wjcc.v11.i31.7593


