Copyright
©The Author(s) 2023.
World J Clin Cases. Oct 26, 2023; 11(30): 7350-7362
Published online Oct 26, 2023. doi: 10.12998/wjcc.v11.i30.7350
Published online Oct 26, 2023. doi: 10.12998/wjcc.v11.i30.7350
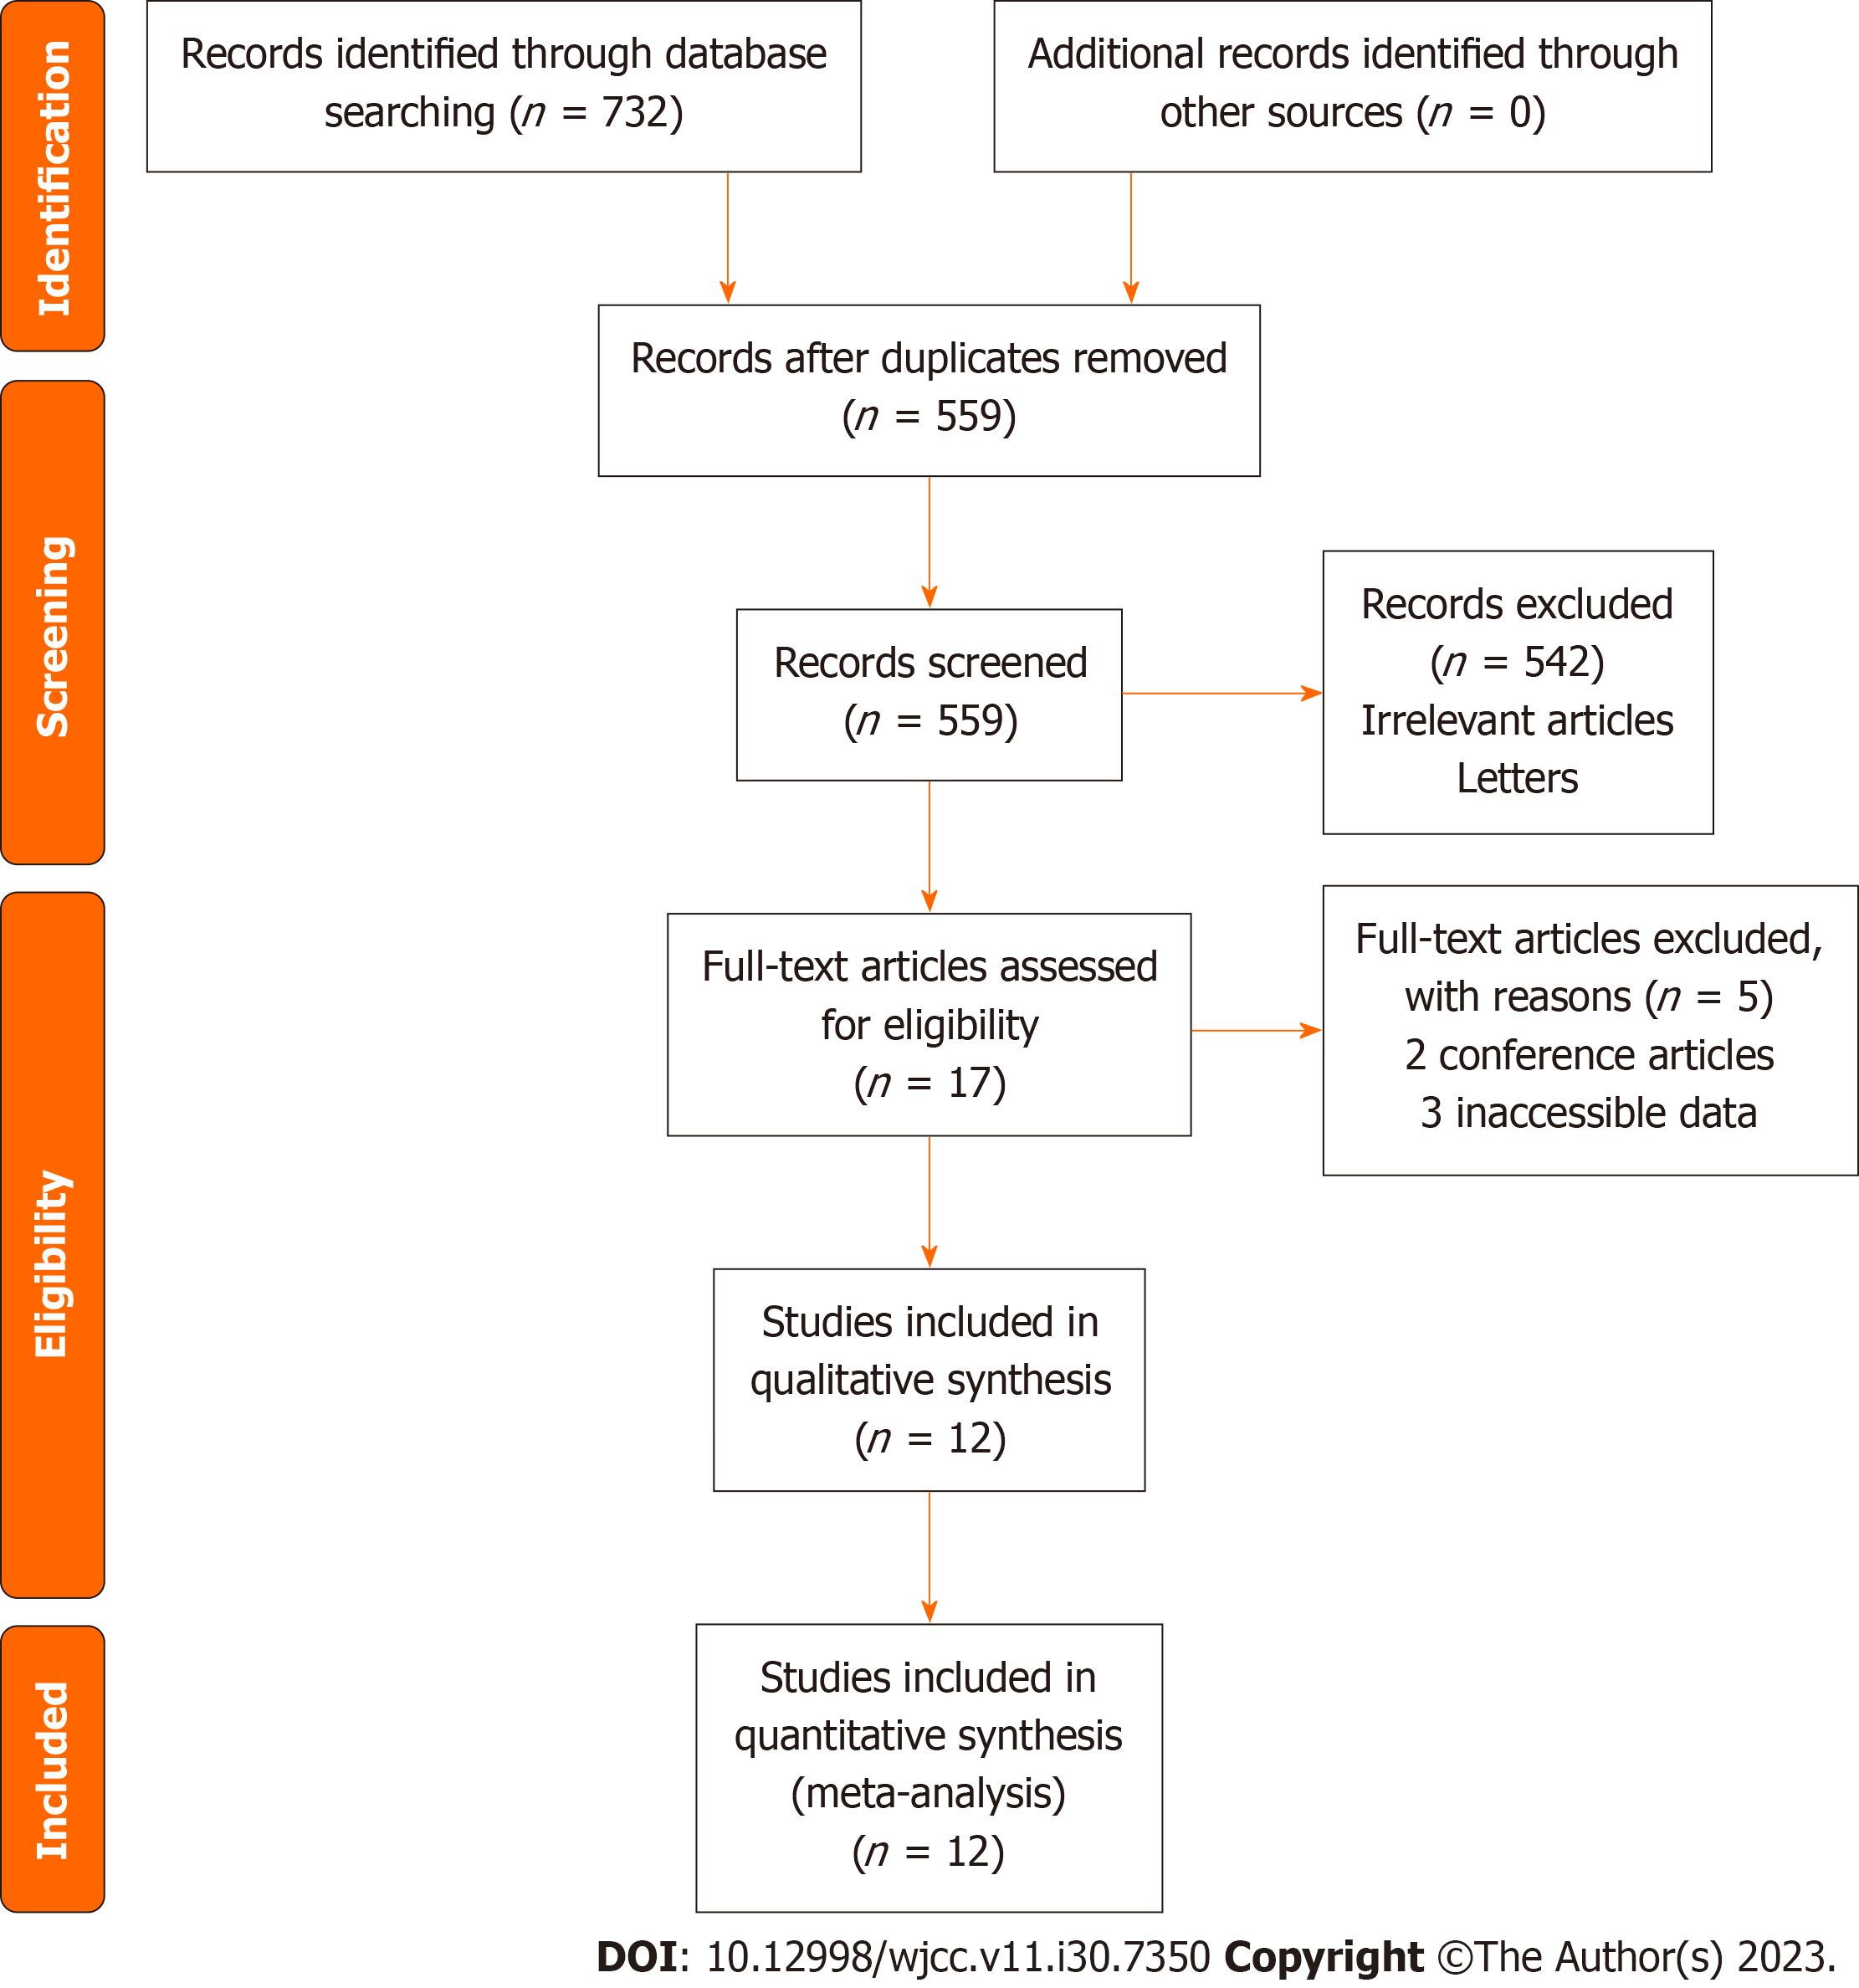
Figure 1 Flow diagram of the literature selection process.
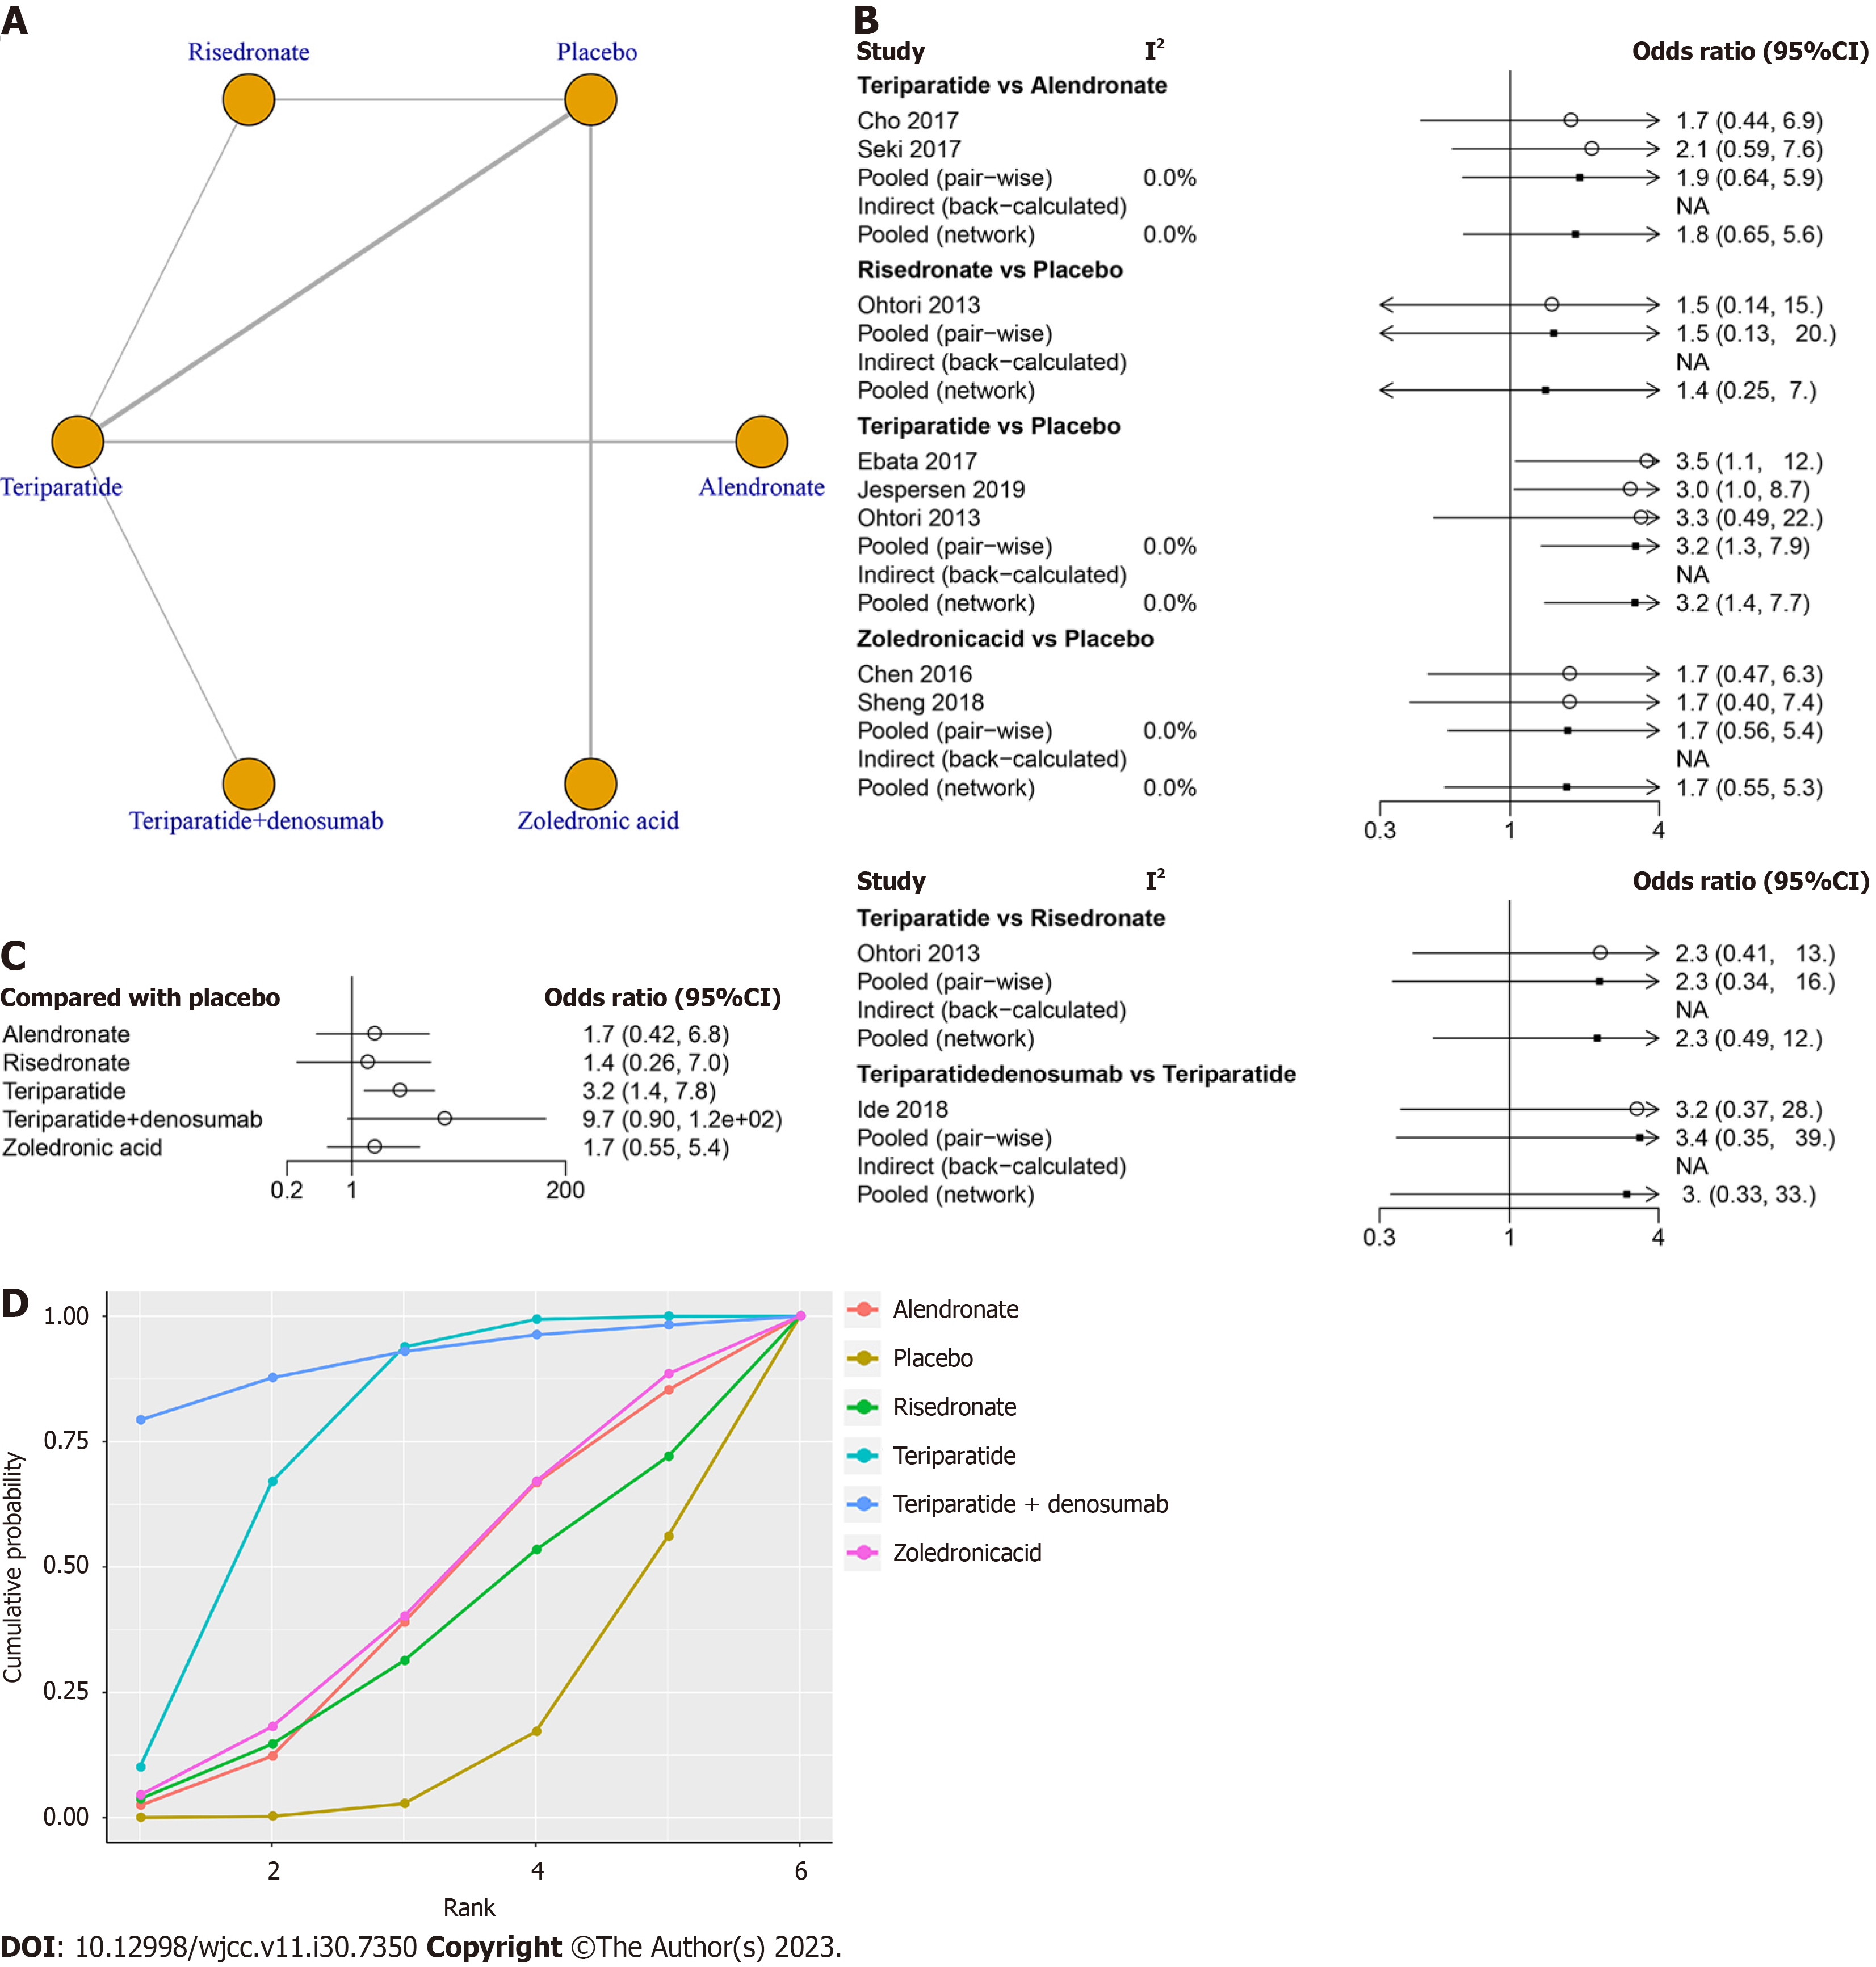
Figure 2 Network meta-analysis of fusion rate between risedronate, teriparatide, teriparatide combined with denosumab, zoledronic acid, alendronate and placebo.
A: Network structure diagram of fusion rate; B: Heterogeneity of the included studies; C: Forest plot of the fusion rate of the drugs compared with placebo; D: Surface under the cumulative ranking curve of different drugs for fusion rate.
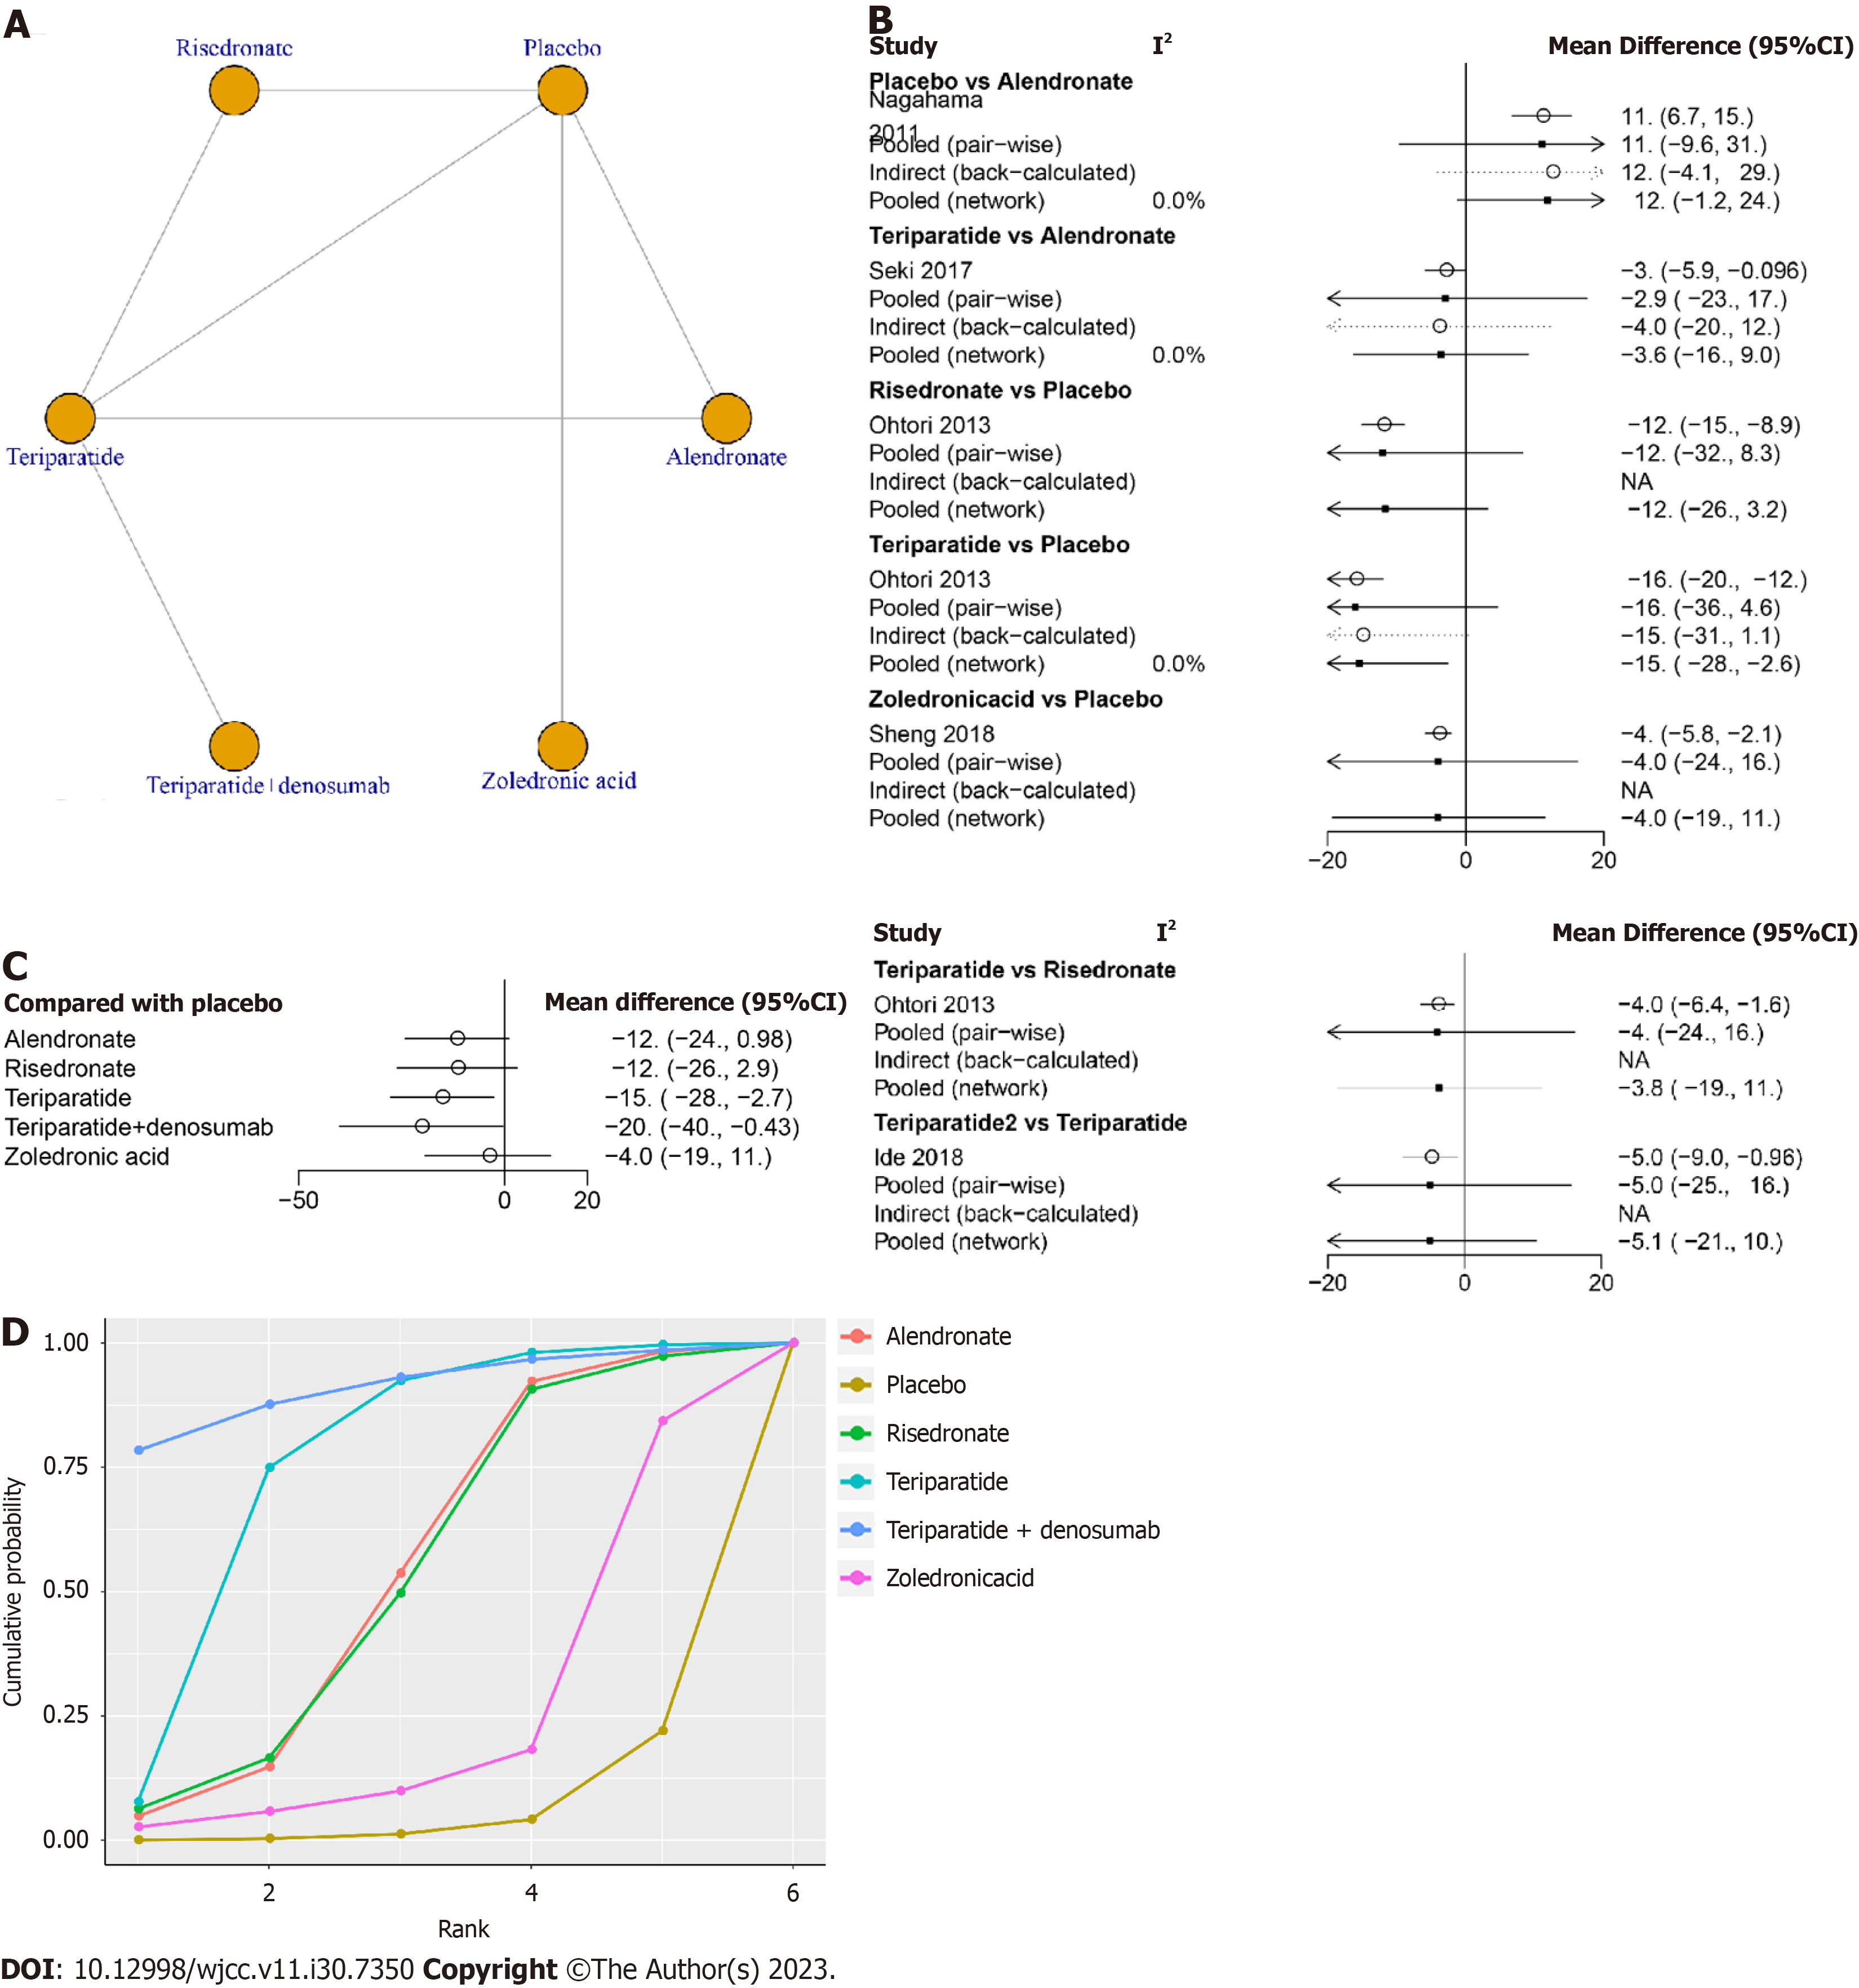
Figure 3 Network meta-analysis of Oswestry disability index between risedronate, teriparatide, teriparatide combined with denosumab, zoledronic acid, alendronate and placebo.
A: Network structure diagram of Oswestry disability index (ODI); B: Heterogeneity of the included studies; C: Forest plot of the ODI of the drugs compared with placebo; D: Surface under the cumulative ranking curve of different drugs for ODI.
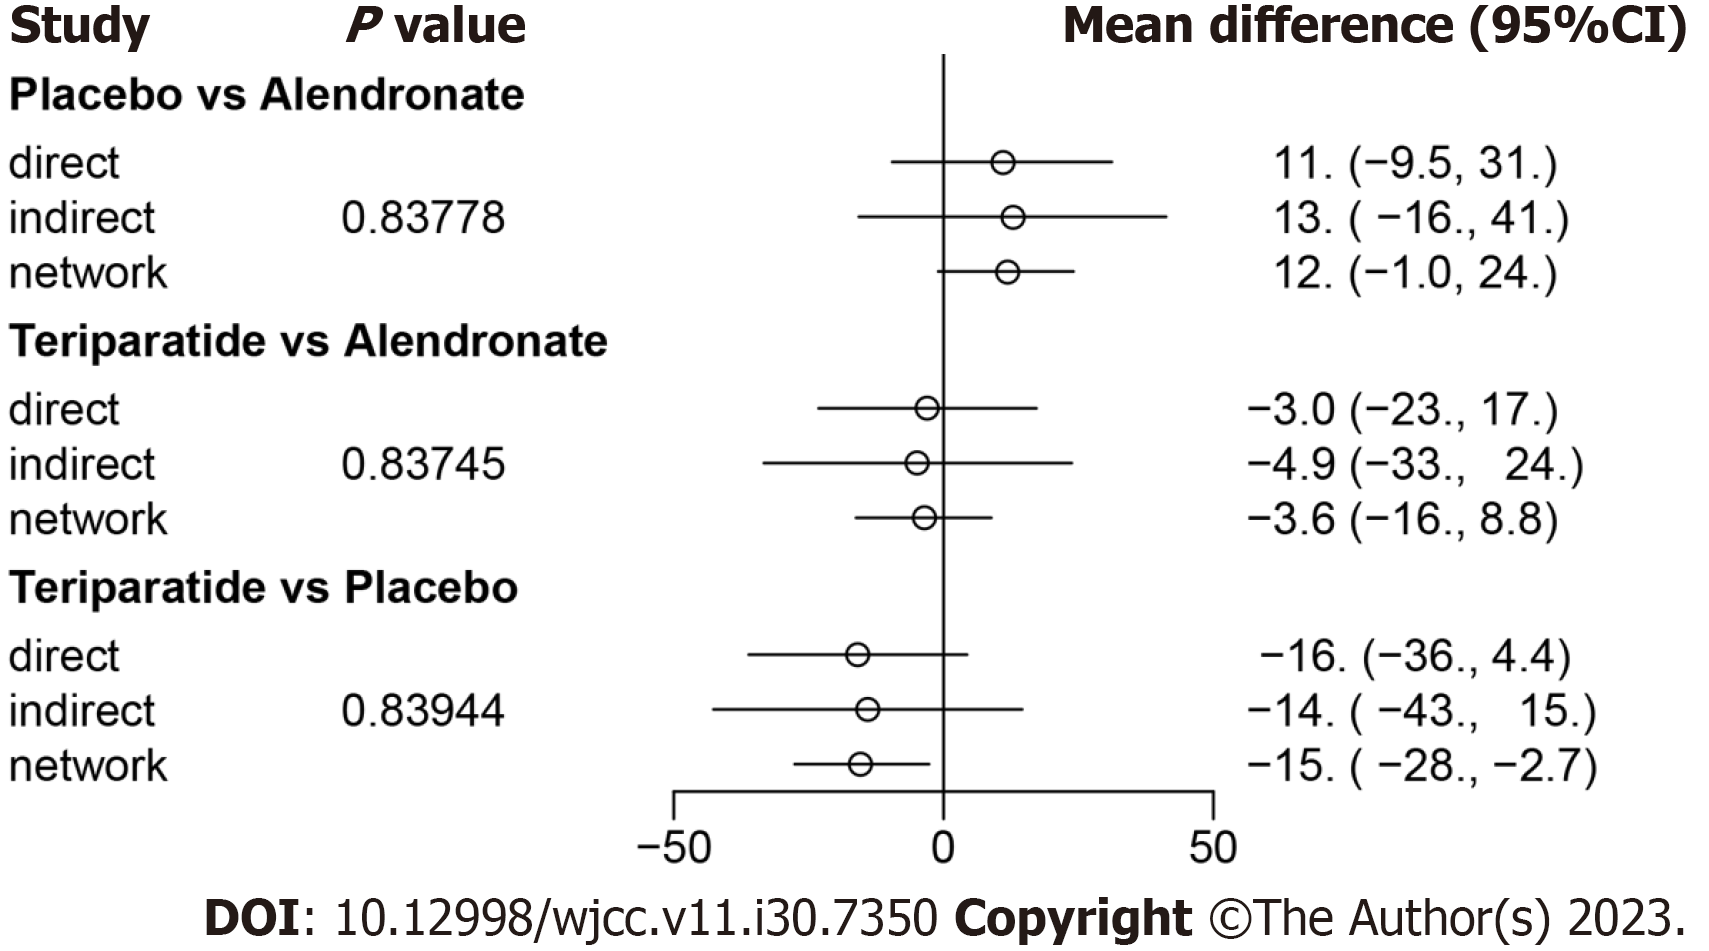
Figure 4 Comparison between direct and indirect evidence: Oswestry disability index.
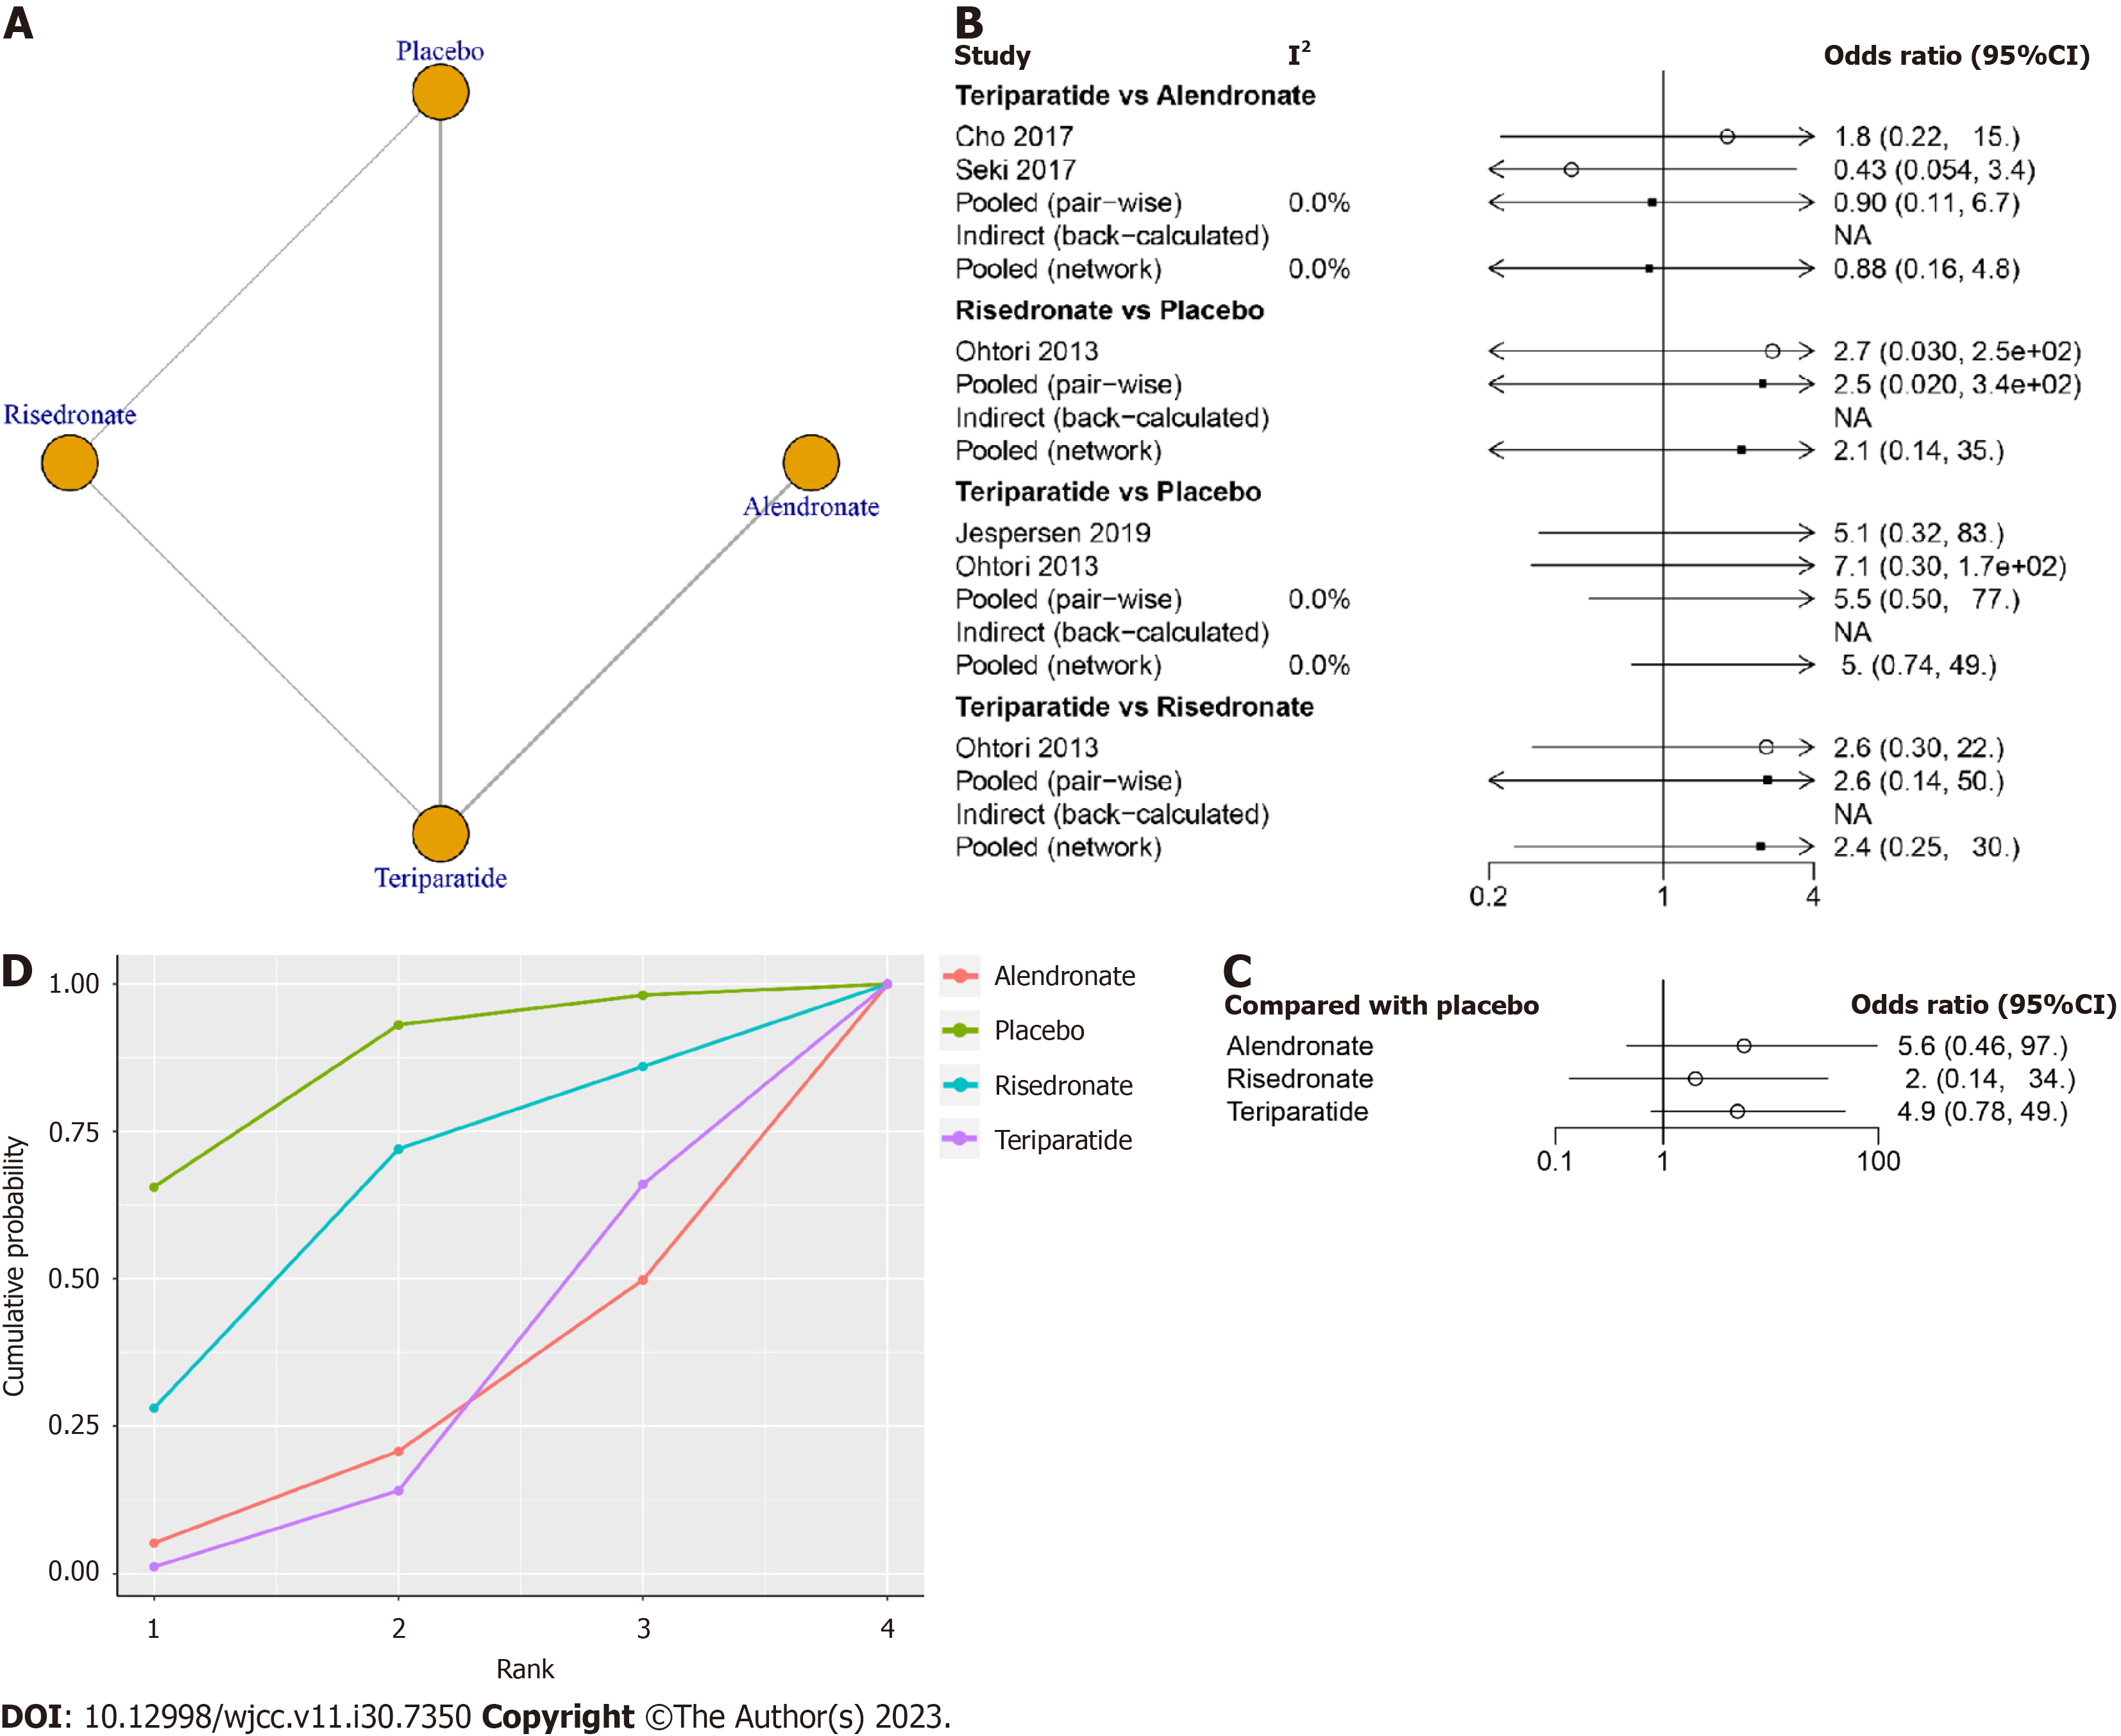
Figure 5 Network meta-analysis of adverse events between risedronate, teriparatide, teriparatide combined with denosumab, zoledronic acid, alendronate and placebo.
A: Network structure diagrams of adverse events; B: Heterogeneity of the included studies; C: Forest plot of the adverse events of the drugs compared with placebo; D: Surface under the cumulative ranking curve probabilities of different drugs for adverse events.
- Citation: He XY, Chen HX, Zhao ZR. Efficacy and safety of different anti-osteoporotic drugs for the spinal fusion surgery: A network meta-analysis. World J Clin Cases 2023; 11(30): 7350-7362
- URL: https://www.wjgnet.com/2307-8960/full/v11/i30/7350.htm
- DOI: https://dx.doi.org/10.12998/wjcc.v11.i30.7350


