Copyright
©The Author(s) 2023.
World J Clin Cases. Oct 16, 2023; 11(29): 7162-7169
Published online Oct 16, 2023. doi: 10.12998/wjcc.v11.i29.7162
Published online Oct 16, 2023. doi: 10.12998/wjcc.v11.i29.7162
Figure 1 A 67-year-old man received multiple image examination, but each gastrointestinal active bleeding point was different.
A: Esophagogastroduodenoscopy (EGD) showed three gastric ulcers, which were suspected Dieulafoy lesions; B: Small bowel endoscopy showed a shallow ulcer with pigmented spots in the small bowel; C: EGD showed duodenal diverticulum on the third portion; D: 99mTc-red blood cell scan showed the radioactivity in the middle ascending colon to the hepatic flexure; E: Colonoscopy found two outpunching with dark brown content and mild oozing in the transverse colon.
Figure 2 We suggested the patient be admitted longer to find the bleeder.
A: Computed tomography angiography arrow showed a small aortic aneurysm at the renal level, in contact with the fourth portion of the duodenum (orange arrow); B: 99mTc-red blood cell scan showed an active bleeder at the duodenum level in the lateral view at 19 h, but other anterior views did not see any significant bleeding points (blue arrow).
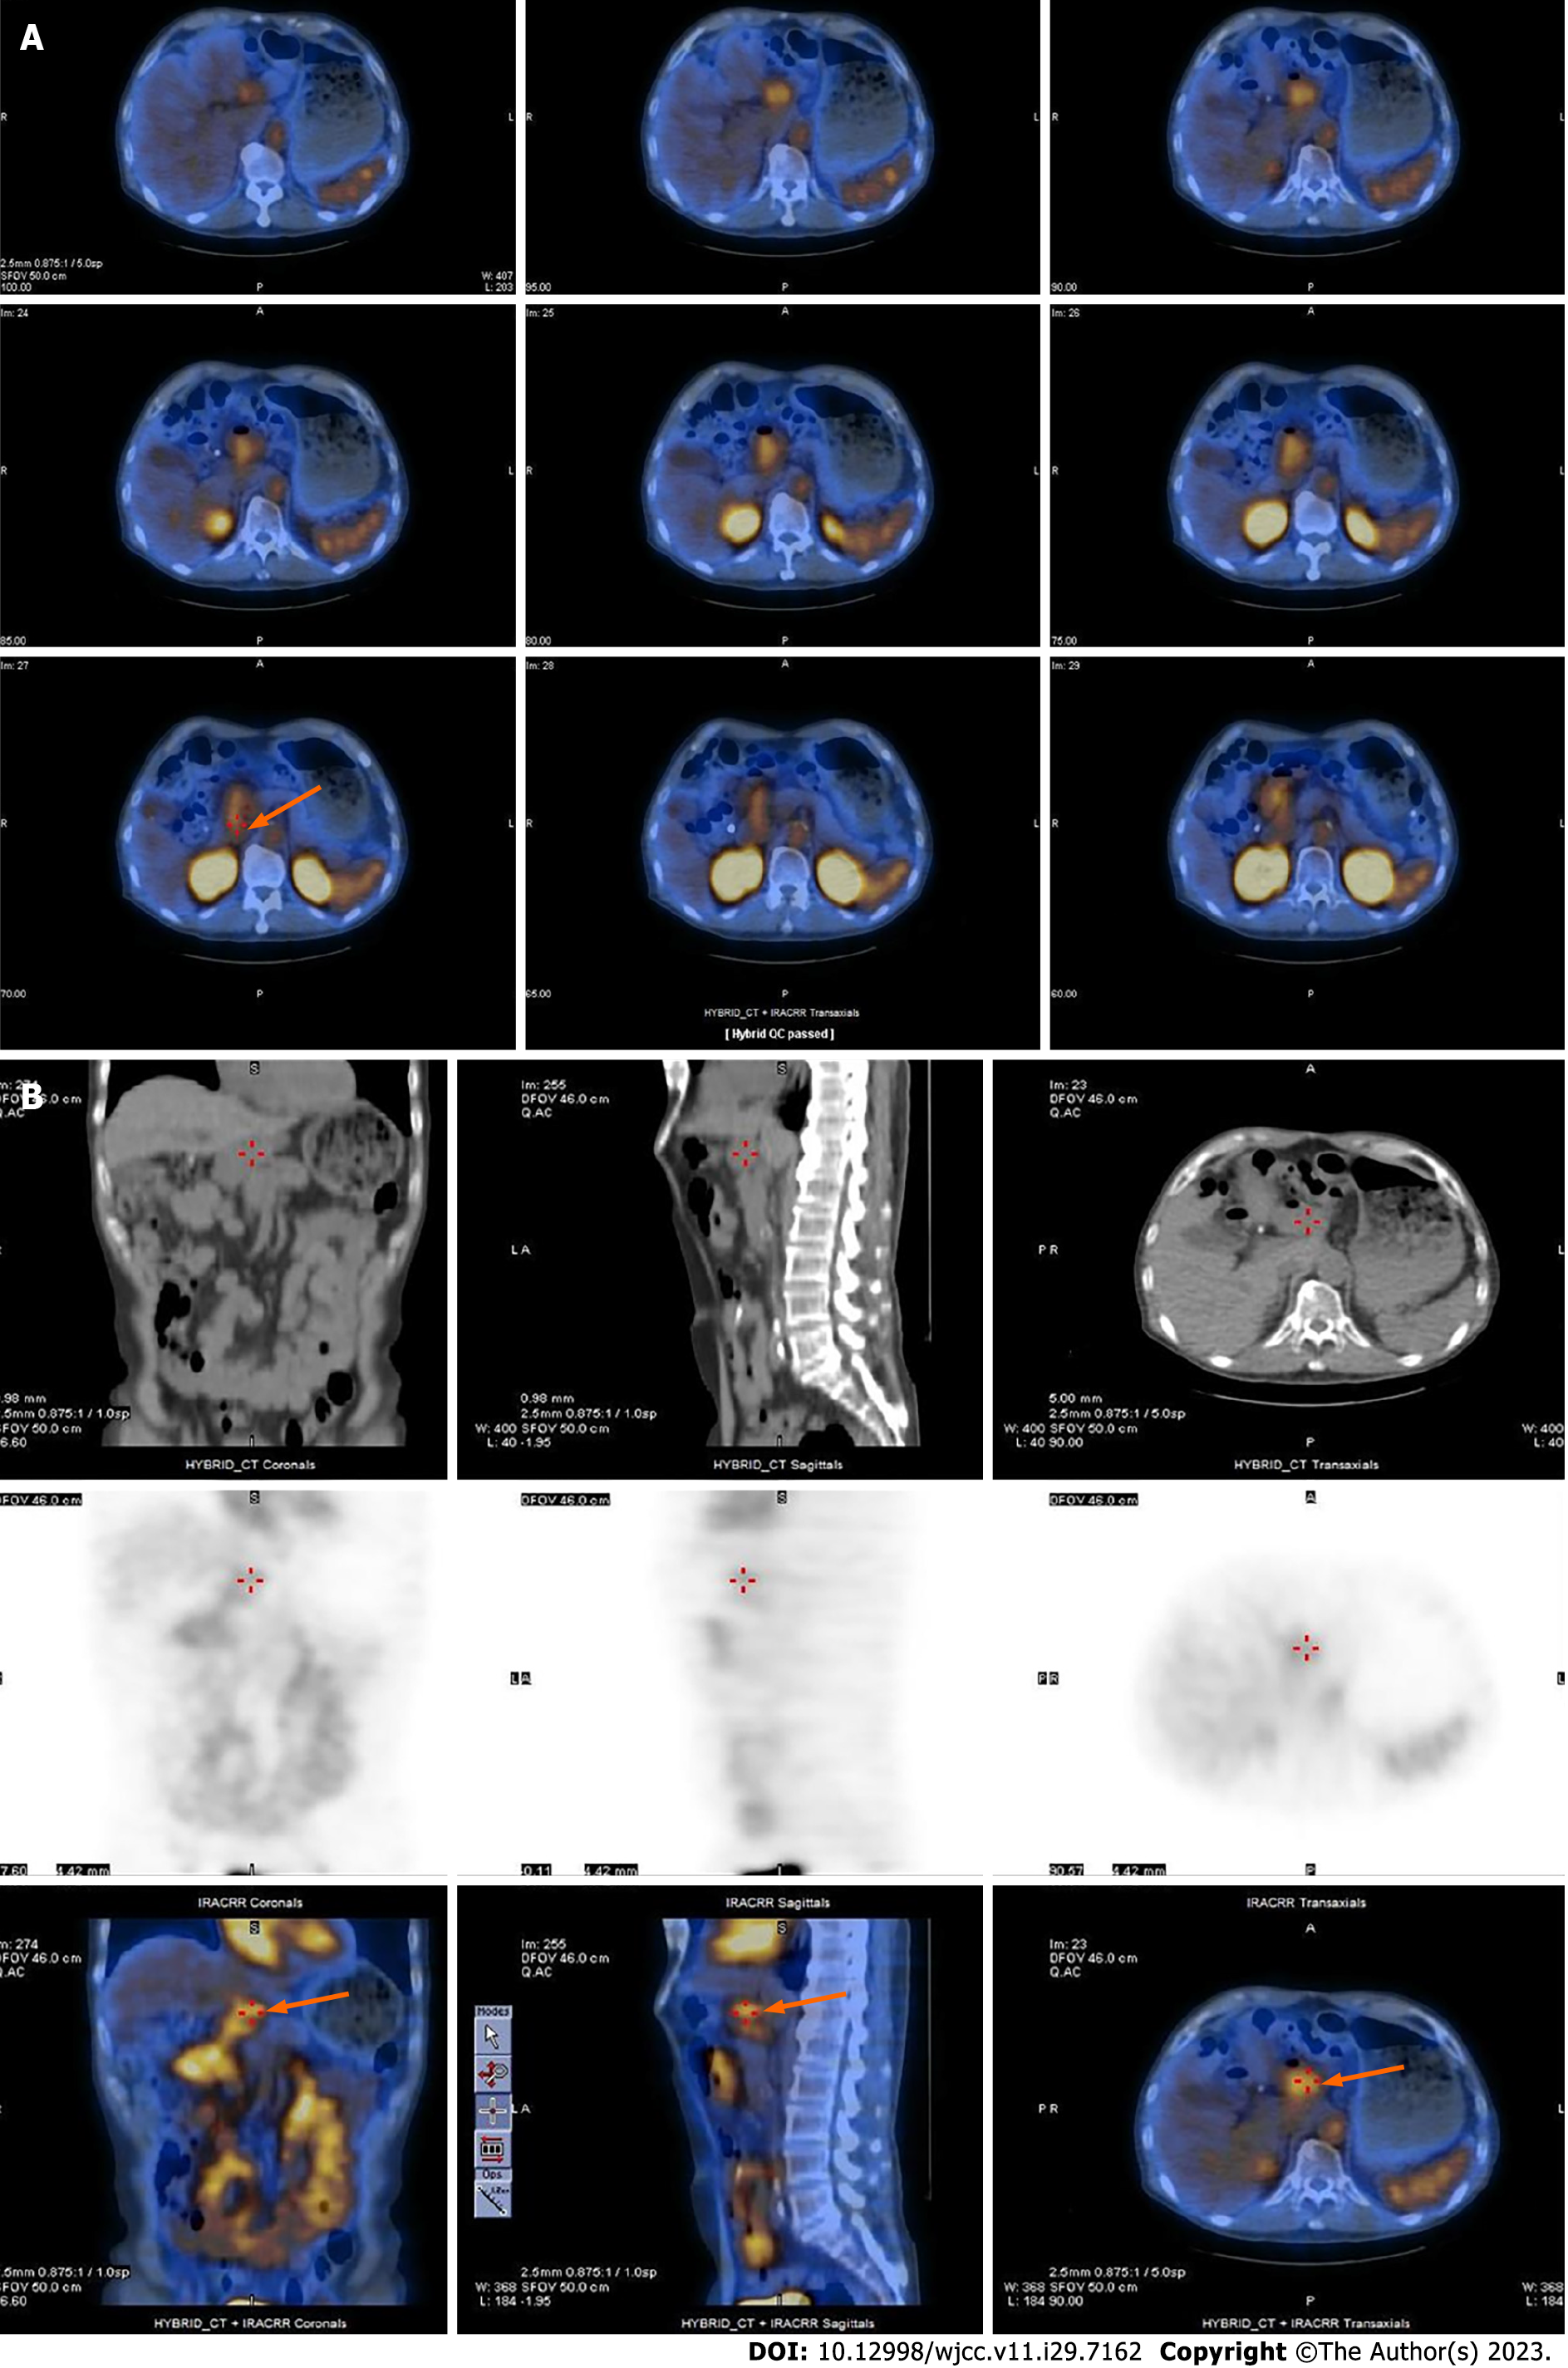
Figure 3 Single-photon emission computed tomography/computed tomography localized a bleeding point at duodenum level.
A: Single-photon emission computed tomography/computed tomography (SPECT/CT) transverse images (orange arrow); B: Top was CT three-dimensional (3D) images, middle was SPECT 3D images, and bottom was SPECT/CT 3D images (orange arrow).
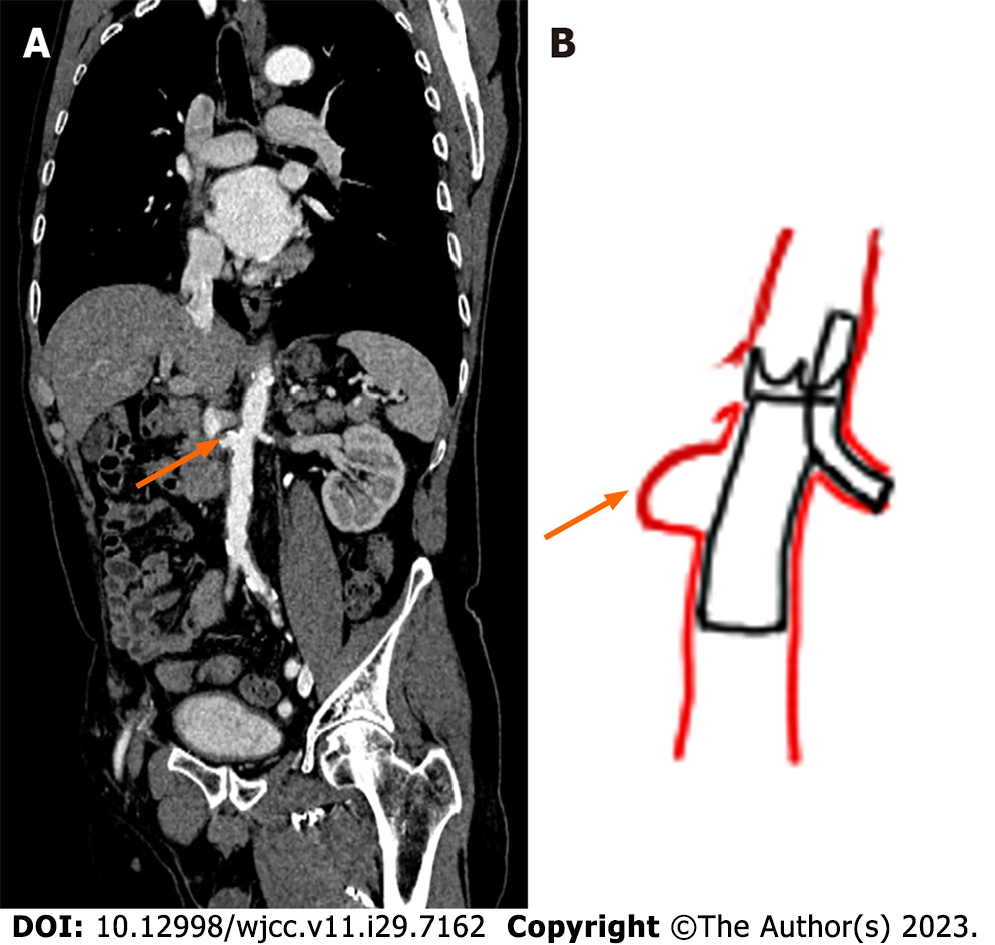
Figure 4 Schematic diagram of percutaneous intravascular stenting of the abdominal aorta.
Orange arrows showed the location of saccular aneurysm. A: Computed tomography angiography coronal image; B: Schematic diagram of the operative procedure.
- Citation: Kuo CL, Chen CF, Su WK, Yang RH, Chang YH. Rare finding of primary aortoduodenal fistula on single-photon emission computed tomography/computed tomography of gastrointestinal bleeding: A case report. World J Clin Cases 2023; 11(29): 7162-7169
- URL: https://www.wjgnet.com/2307-8960/full/v11/i29/7162.htm
- DOI: https://dx.doi.org/10.12998/wjcc.v11.i29.7162


