Copyright
©The Author(s) 2023.
World J Clin Cases. Oct 16, 2023; 11(29): 7091-7100
Published online Oct 16, 2023. doi: 10.12998/wjcc.v11.i29.7091
Published online Oct 16, 2023. doi: 10.12998/wjcc.v11.i29.7091
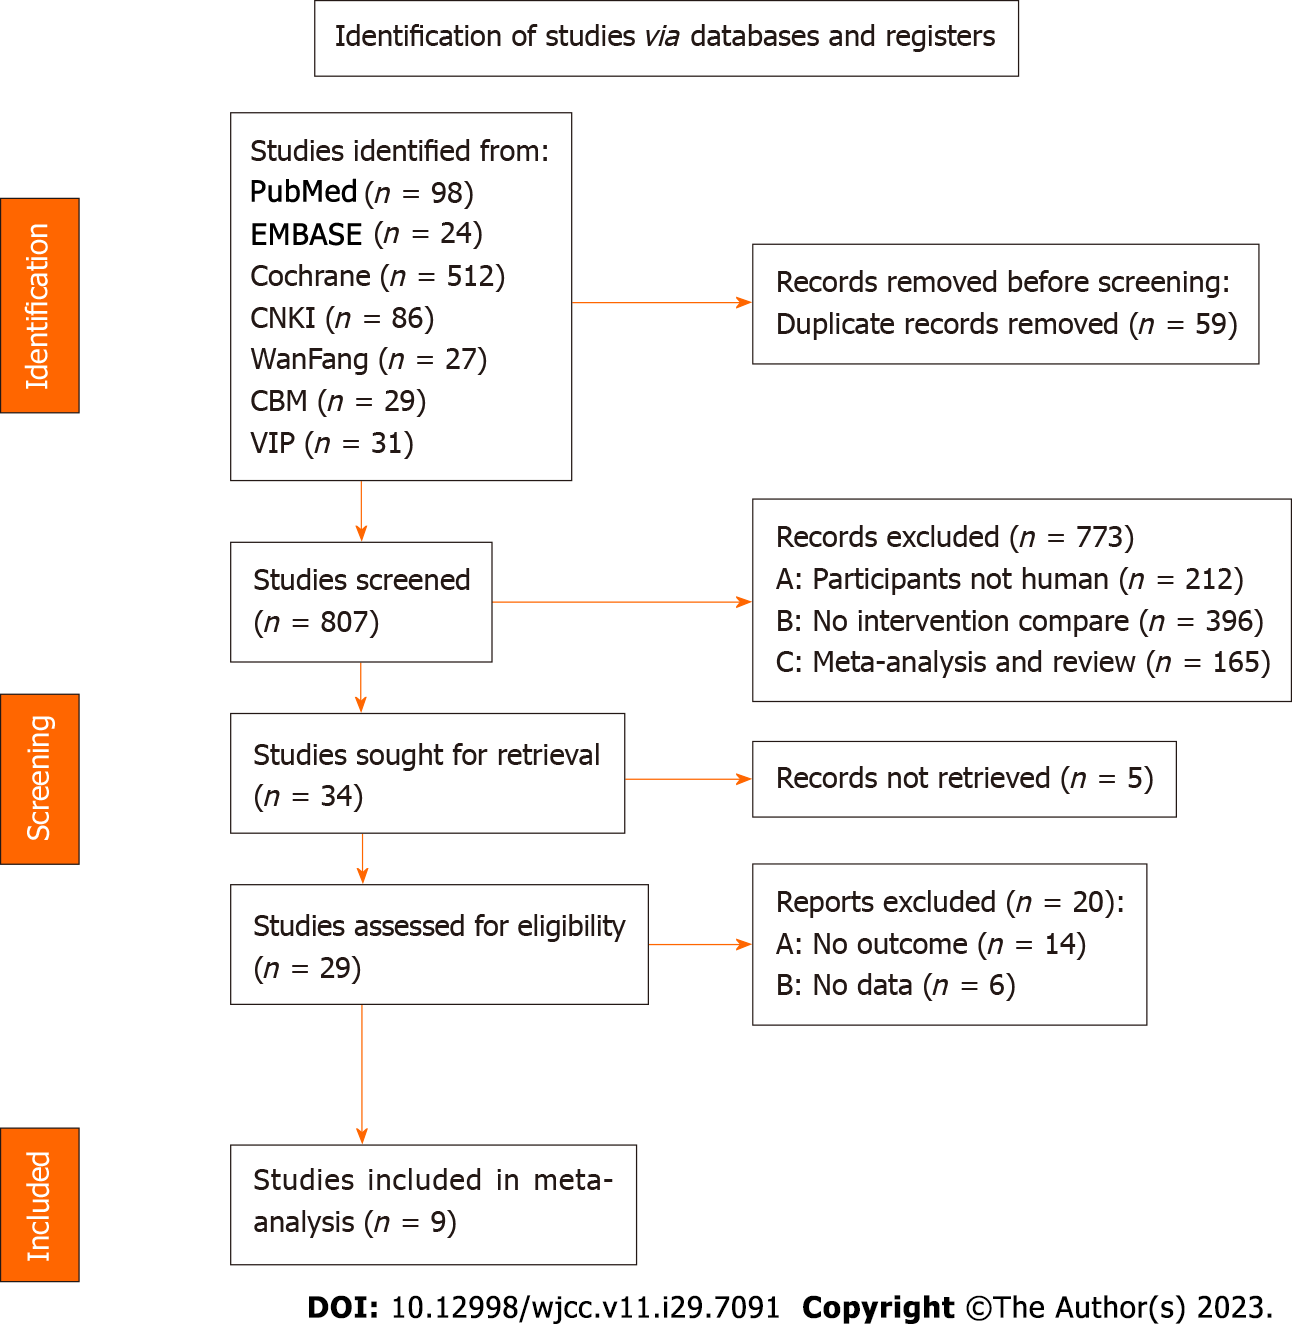
Figure 1
Screening flow chart.
Figure 2
Quality evaluation plot.
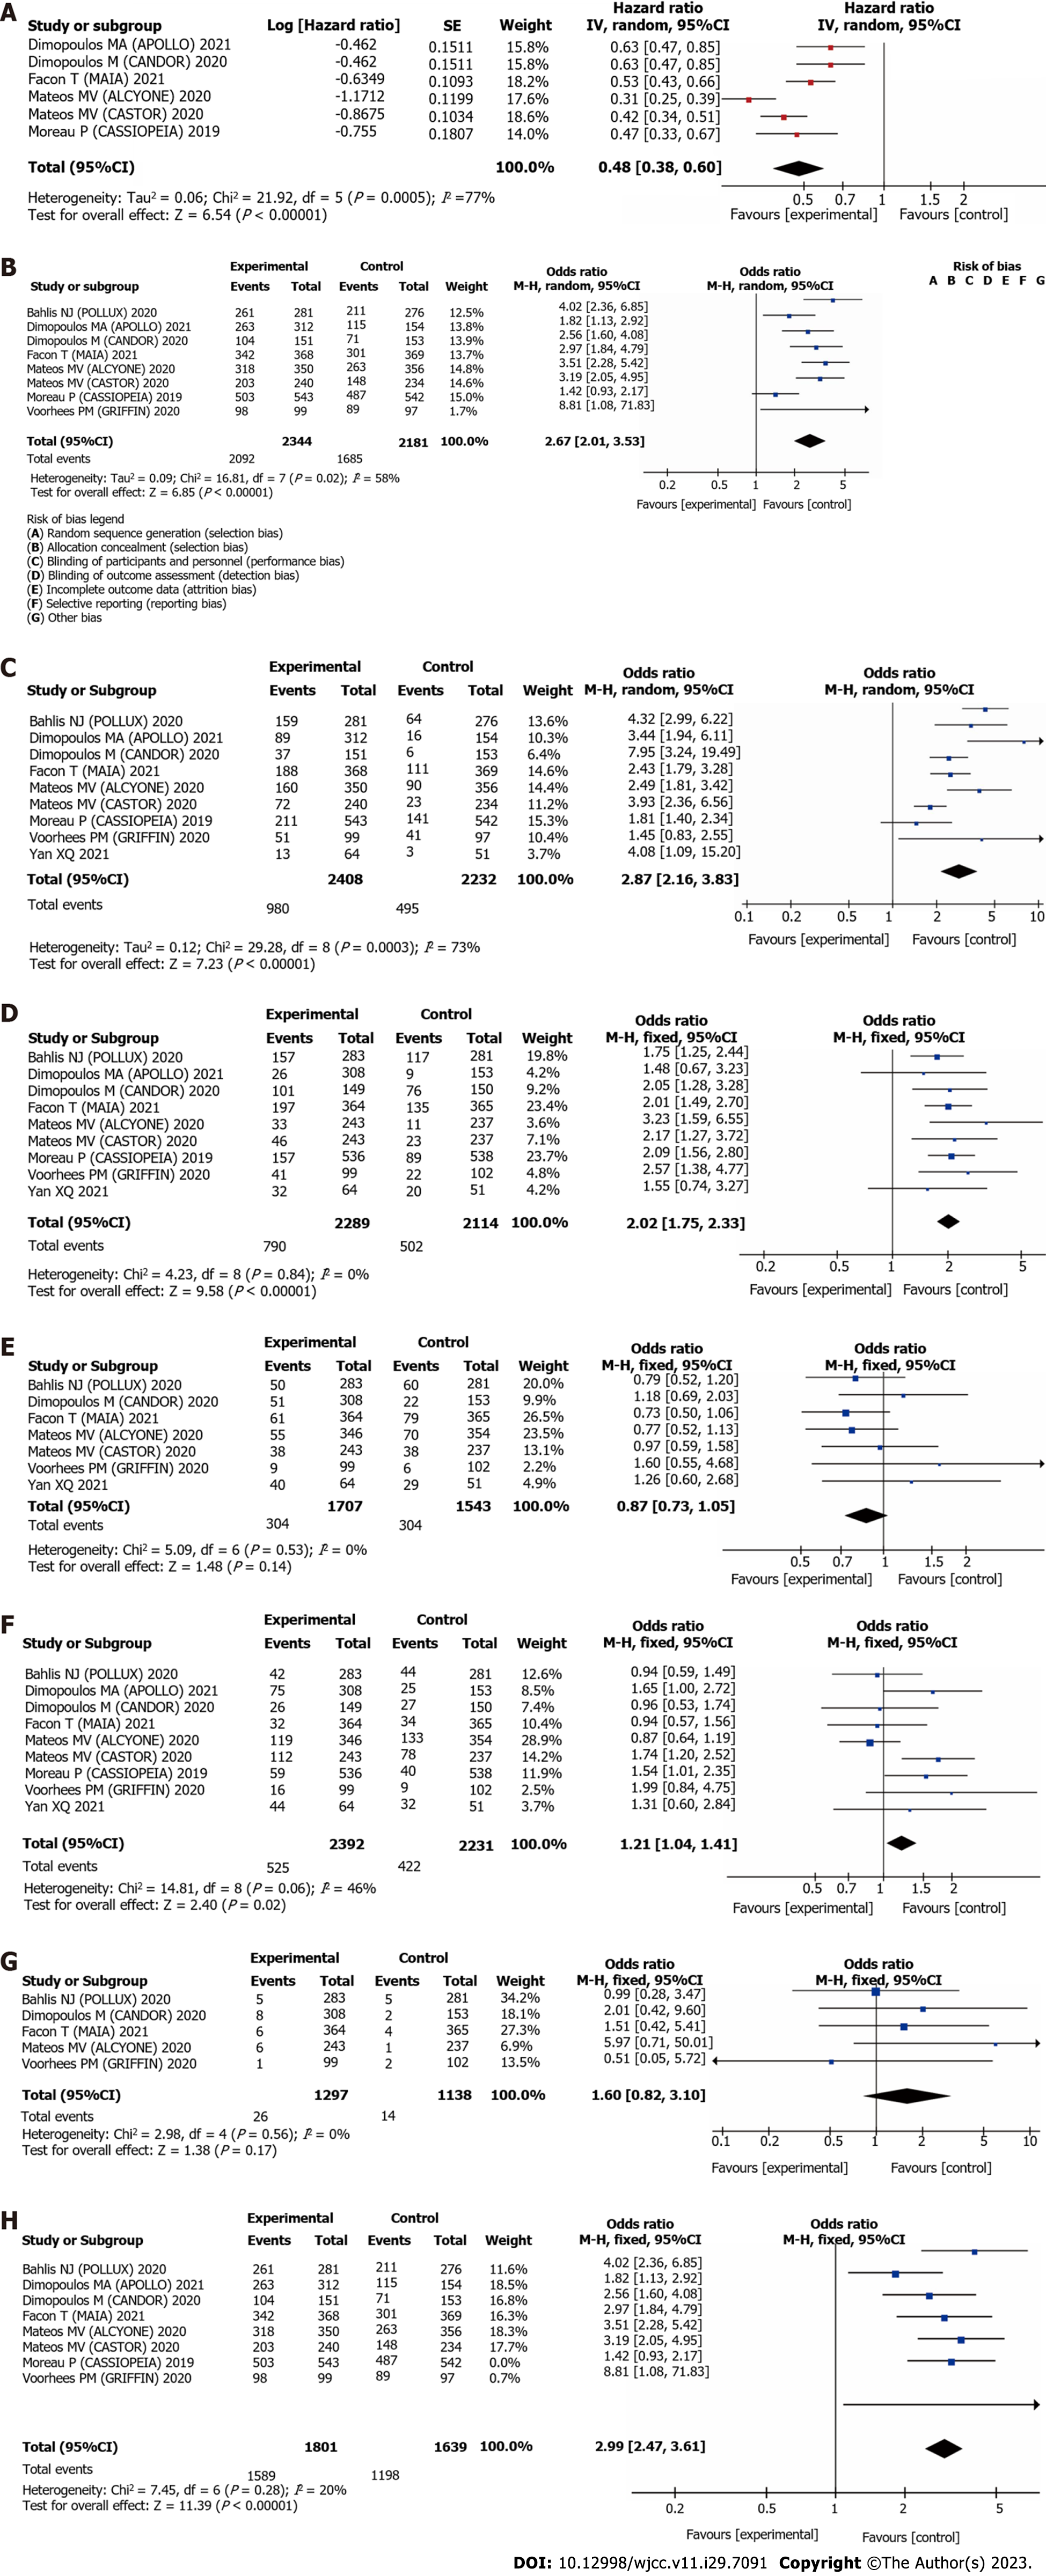
Figure 3 Forest plot of the combined results of daratumumab and other therapies in patients with multiple myeloma.
A: Progression-free survival time; B: Overall response rate; C: Complete remission; D: Incidence of neutropenia; E: Incidence of anemia; F: Incidence of thrombocytopenia; G: Upper respiratory tract infection; H: Sensitivity analysis. MM: Multiple myeloma; PFS: Progression-free survival time; ORR: Overall response rate; CR: Complete remission; CI: Confidence interval.
Figure 4 Funnel plot of the incidence of adverse event.
A: Thrombocytopenia; B: Neutropenia.
- Citation: Wang P, Jin SY. Meta-analysis of the efficacy and safety of daratumumab in the treatment of multiple myeloma. World J Clin Cases 2023; 11(29): 7091-7100
- URL: https://www.wjgnet.com/2307-8960/full/v11/i29/7091.htm
- DOI: https://dx.doi.org/10.12998/wjcc.v11.i29.7091


