Copyright
©The Author(s) 2023.
World J Clin Cases. Oct 6, 2023; 11(28): 6920-6930
Published online Oct 6, 2023. doi: 10.12998/wjcc.v11.i28.6920
Published online Oct 6, 2023. doi: 10.12998/wjcc.v11.i28.6920
Figure 1 Abdominal computed tomography and magnetic resonance imaging findings before transcatheter arterial embolization (case 1).
A and B: Abdominal computed tomography images demonstrating early arterial filling of the portal vein (A) and a 3.7 cm hypervascular lesion in the pancreas head (B); C: Additionally, magnetic resonance imaging image showing a similar lesion.
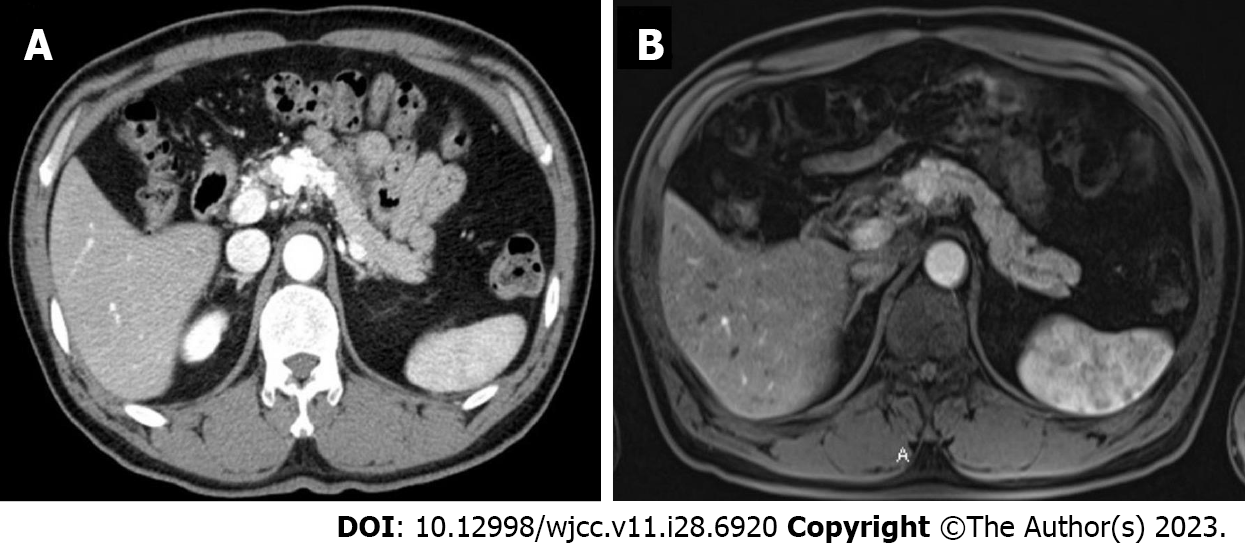
Figure 2 Abdominal computed tomography and magnetic resonance imaging before transcatheter arterial embolization (case 2).
A: Computed tomography image showing a 5.2 cm × 4.0 cm enhancing tortuous, tubular hypervascular lesion in the pancreas neck, and body; B: Magnetic resonance imaging image showing a 2 cm multilobulated and irregular hypervascular lesion in the pancreatic neck and body with peripancreatic infiltration.
Figure 3 Abdominal endoscopic ultrasonography (case 2).
Abdominal endoscopic ultrasonography showing the presence of an approximately 2.0 cm cystic lesion.
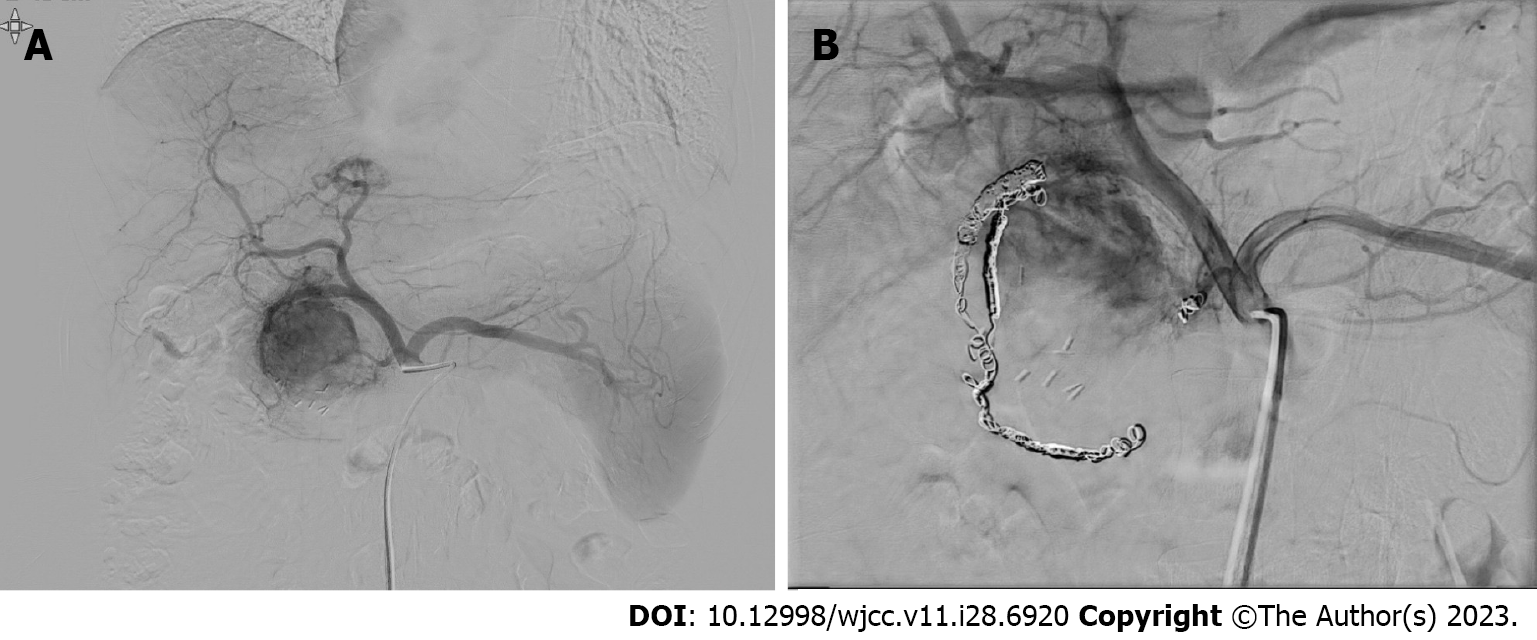
Figure 4 Angiography and transcatheter arterial embolization (case 1).
A: Angiographic images revealing multiple feeding branches supplying blood flow to the nidus; B: While the interventional image shows the use of interlock coils to occlude the pancreaticoduodenal arcade and dorsal pancreatic artery.
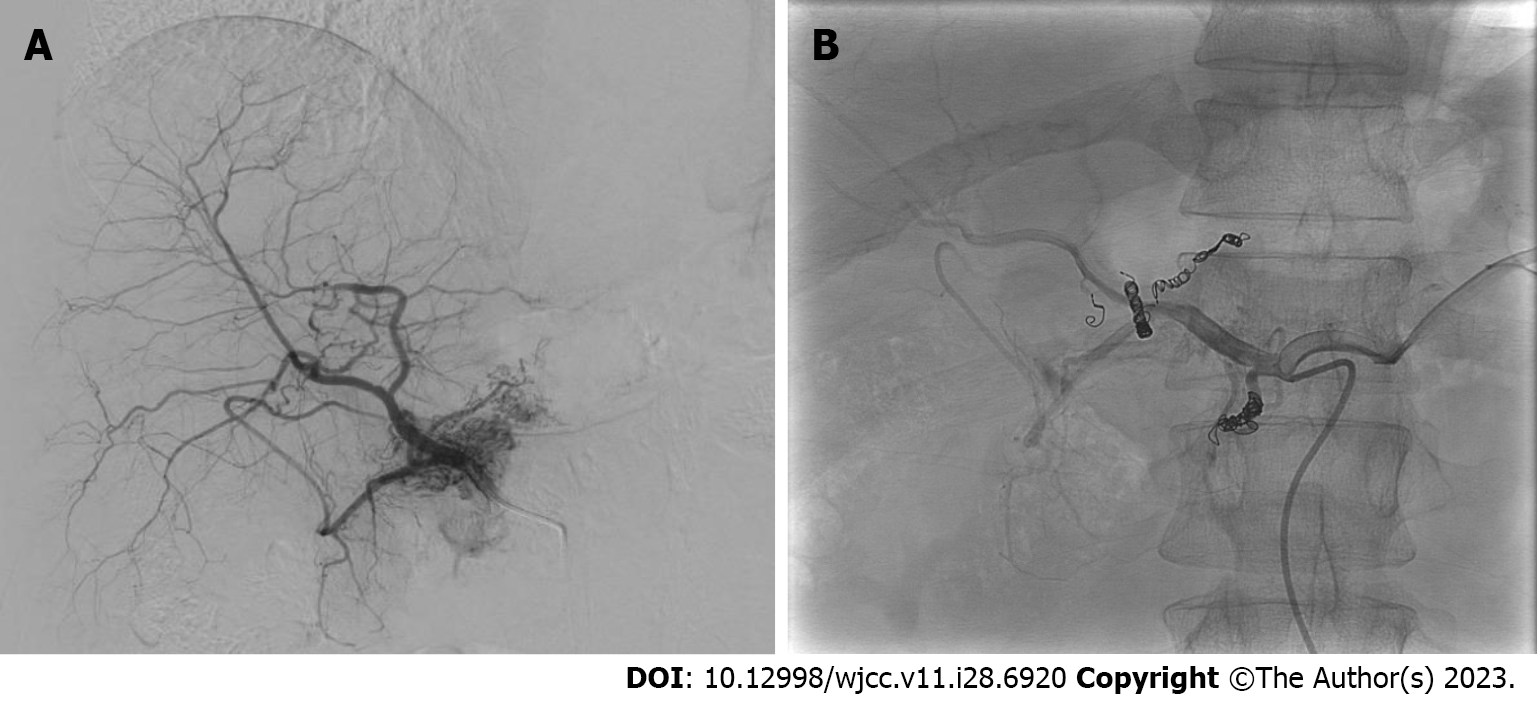
Figure 5 Arteriography and transcatheter arterial embolization (case 2).
A: Angiographic images of feeding branches from the proper hepatic artery and the dorsal pancreatic artery; B: The feeding branches are then treated with interlock coils to block the blood supply to the abnormal vessels in the pancreas.
Figure 6 Abdominal computed tomography performed on day 5 after transcatheter arterial embolization (case 1).
Post-transcatheter arterial embolization image showing improvement in arteriovenous malformation and a slight reduction in peripancreatic hypervascular lesions.
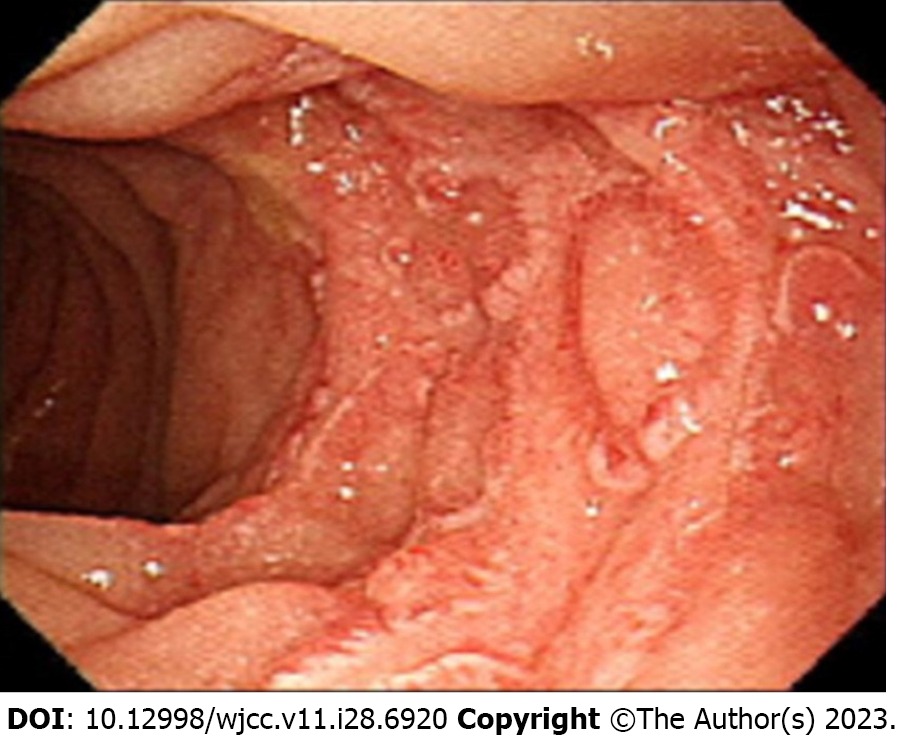
Figure 7 Esophagogastroduodenoscopy performed on day 10 after transcatheter arterial embolization (case 1).
The presence of ischemic duodenitis is evident, characterized by segmental circumferential erythematous uneven mucosal changes with nodularity.
Figure 8 Follow-up abdominal computed tomography scans three months and nine years after the procedure (case 1).
A: The computed tomography (CT) scan after three months revealed a 3.7 cm hypervascular lesion; B: While the CT scan after nine years showed a reduction in the size of the hypervascular lesions to 2.3 cm.
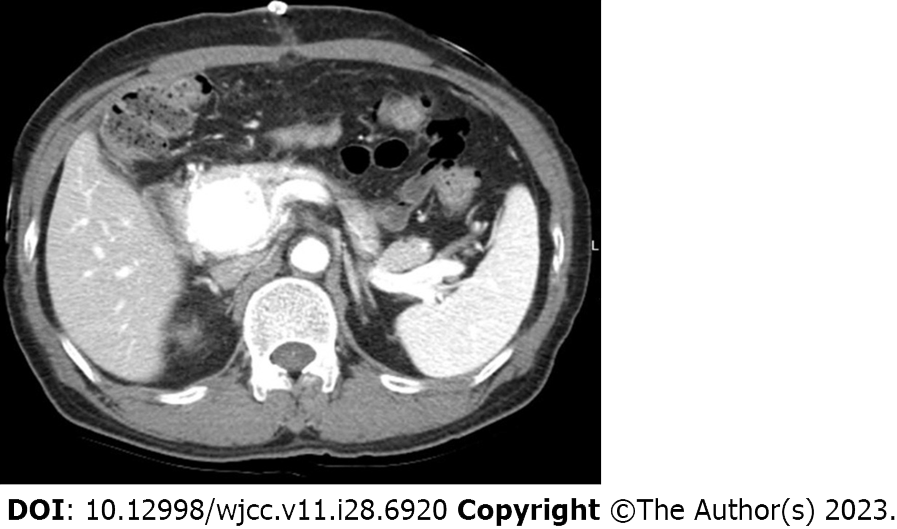
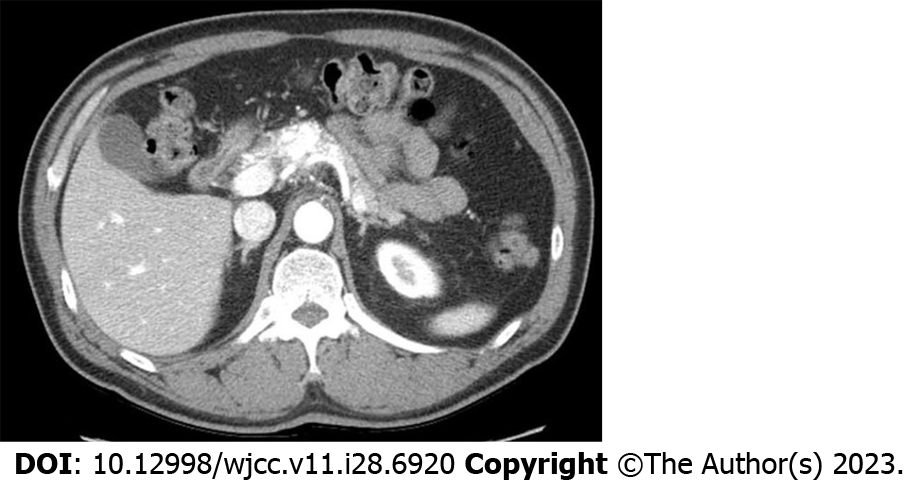
Figure 9 Abdominal computed tomography findings before transcatheter arterial embolization (case 2).
Post-transcatheter arterial embolization computed tomography scan performed on the 4th day revealed reduced contrast enhancement.
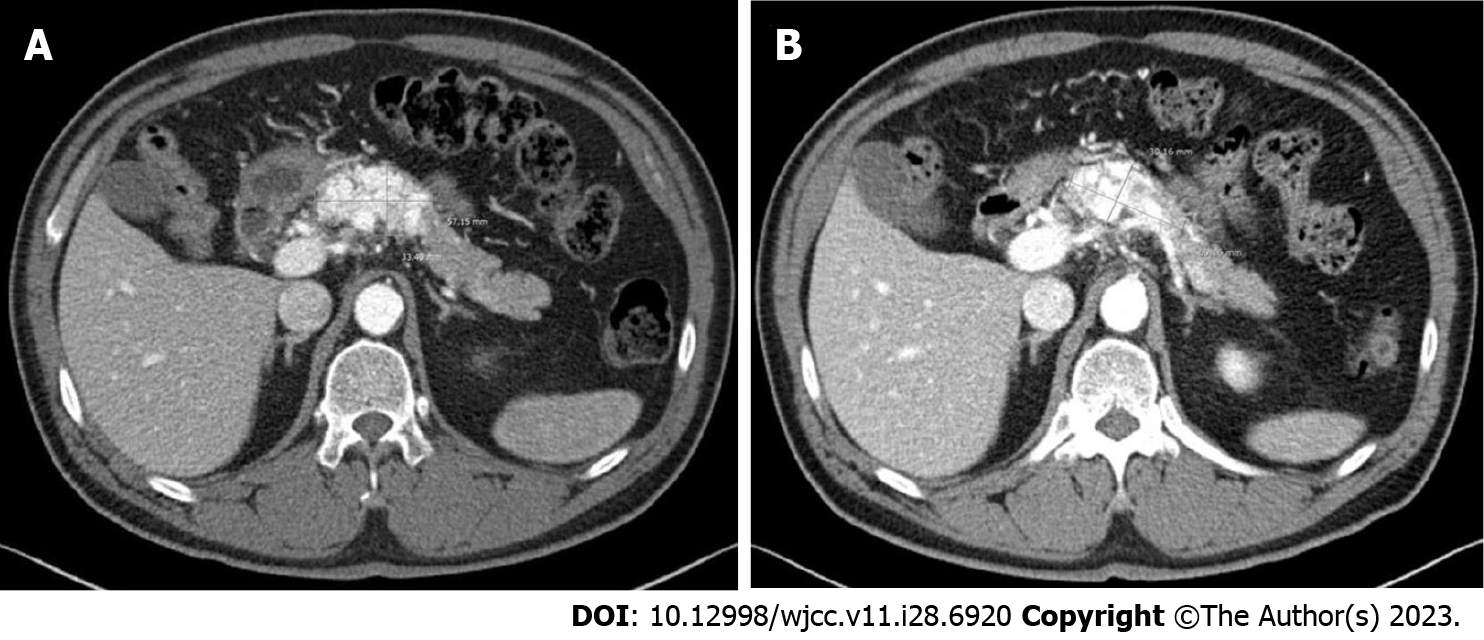
Figure 10 Follow-up abdominal computed tomography scan.
A: On the three-year follow-up computed tomography scan, there was no significant change in the lesion size, which measured 5.7 cm × 3.3 cm; B: On the nine-year follow-up scale, the lesion size remained at 6.0 cm × 3.0 cm.
- Citation: Shin SH, Cho CK, Yu SY. Pancreatic arteriovenous malformation treated with transcatheter arterial embolization: Two case reports and review of literature. World J Clin Cases 2023; 11(28): 6920-6930
- URL: https://www.wjgnet.com/2307-8960/full/v11/i28/6920.htm
- DOI: https://dx.doi.org/10.12998/wjcc.v11.i28.6920


