Copyright
©The Author(s) 2023.
World J Clin Cases. Sep 26, 2023; 11(27): 6631-6639
Published online Sep 26, 2023. doi: 10.12998/wjcc.v11.i27.6631
Published online Sep 26, 2023. doi: 10.12998/wjcc.v11.i27.6631
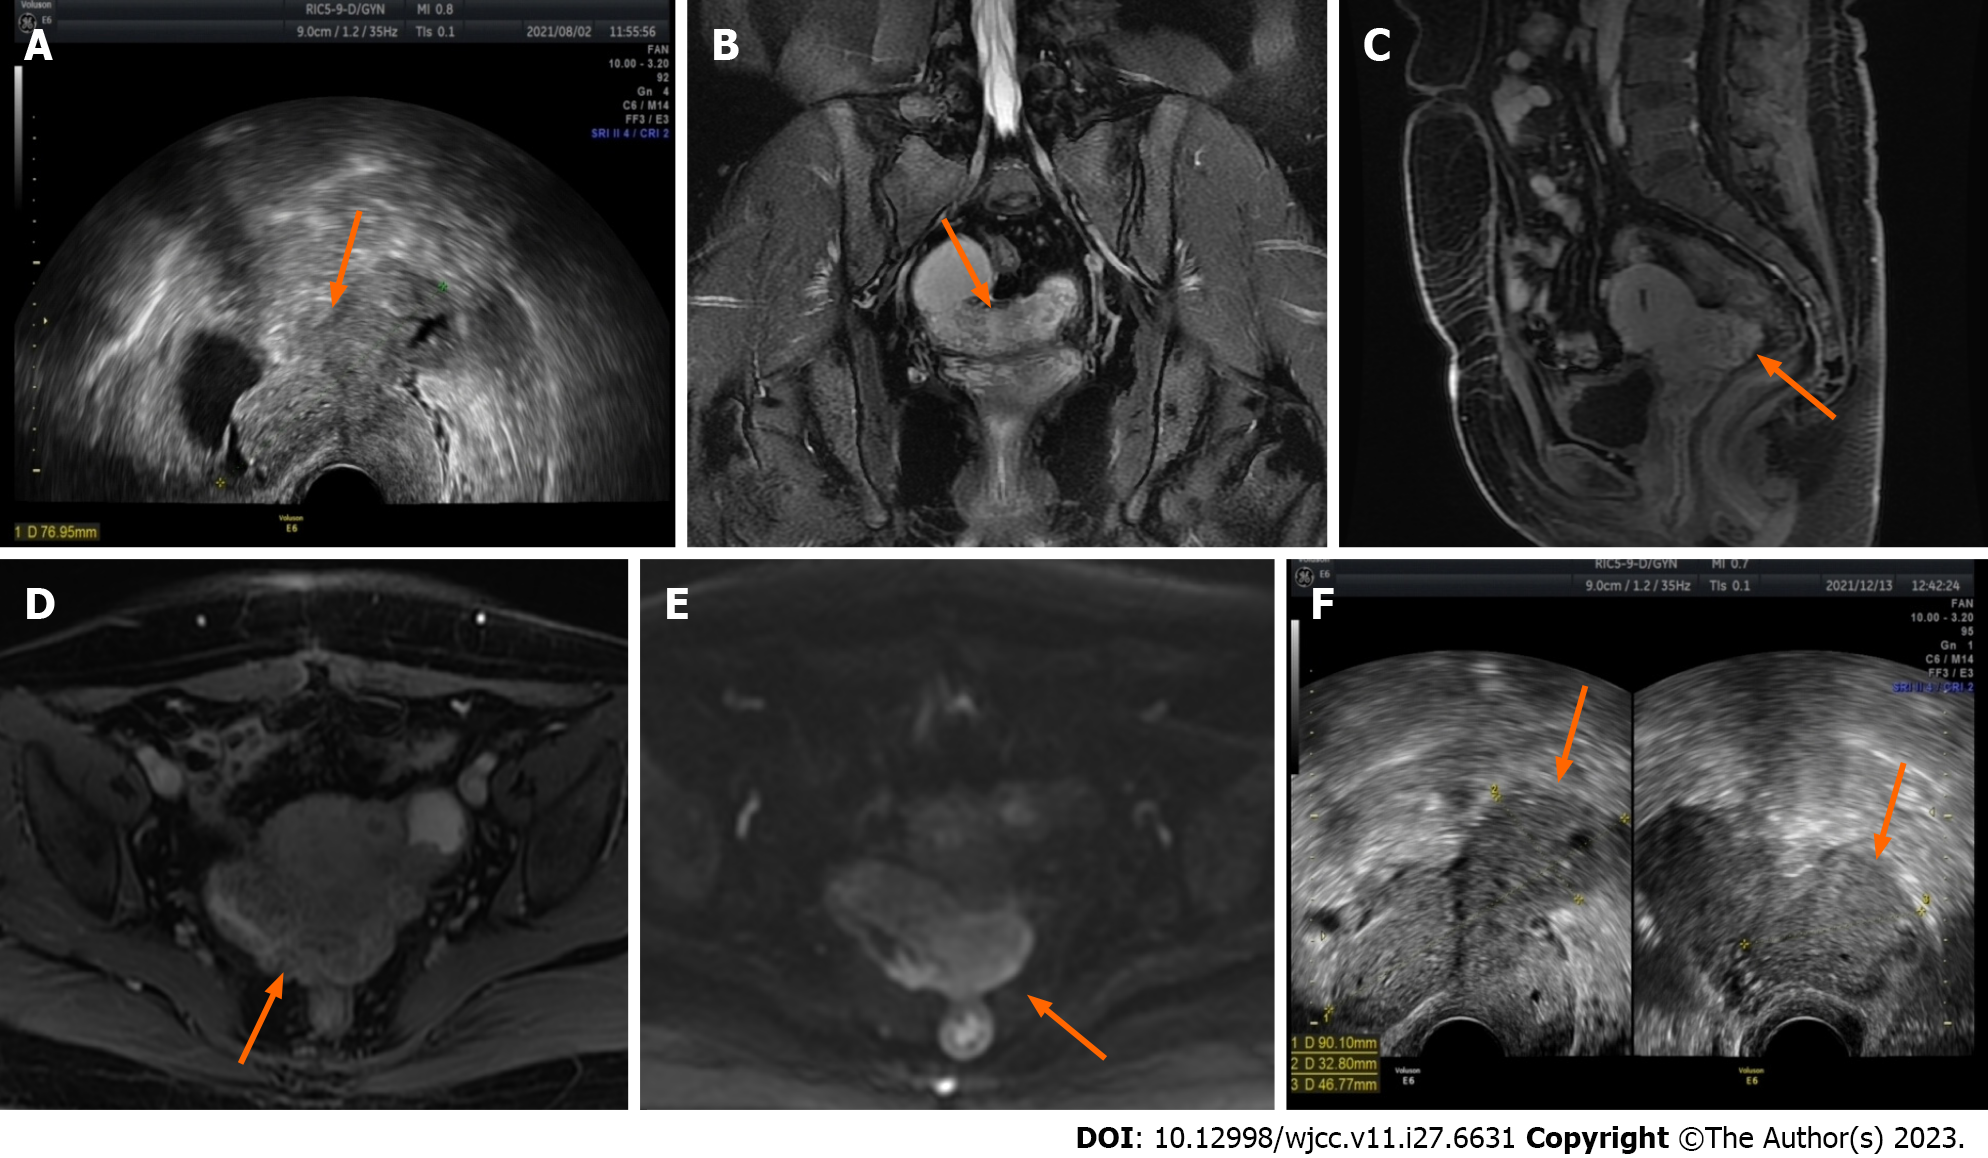
Figure 1 Ultrasound and magnetic resonance imaging images demonstrate changes in lesions before and after two cycles of gonadotropin-releasing hormone agonist treatment.
A: Before the start of treatment, the largest lesion measured 7.7 cm in diameter and displayed some hypoechoic regions within (ultrasound image) (orange arrow); B The lesion appears as slightly hyperintense on T2-weighted imaging in the coronal plane (magnetic resonance imaging) (orange arrow); C and D: In the sagittal and axial enhanced scans, uneven enhancement is observed (magnetic resonance imaging) (orange arrow); E: The lesion exhibits a slight increase in the diffusion-weighted imaging signal (magnetic resonance imaging) (orange arrow); F: After two courses of gonadotropin-releasing hormone agonist treatment, the maximum diameter of the lesion increased to 9 cm, with a few hypoechoic areas visible inside (ultrasound image) (orange arrow).
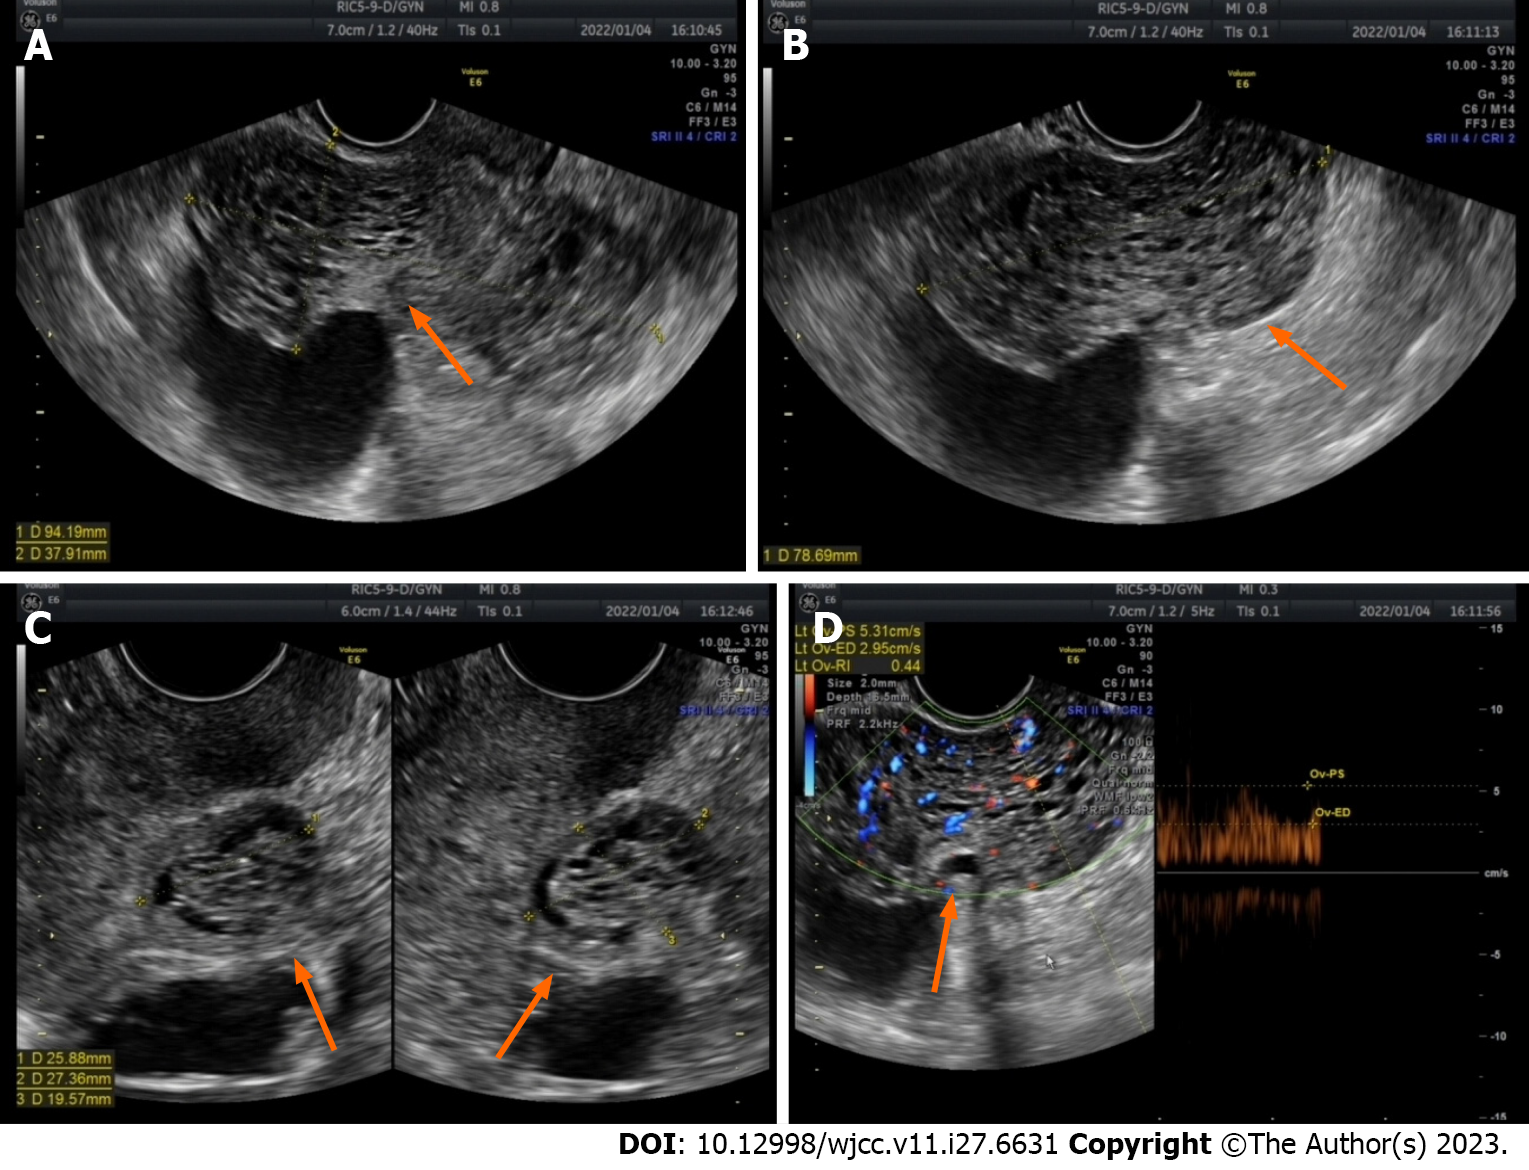
Figure 2 Ultrasound image of the lesion 1 mo after gonadotropin-releasing hormone agonist therapy was discontinued.
A-C: After discontinuation of gonadotropin-releasing hormone agonist for one month, the maximum diameter of the lesion increased to 9.4 cm, with numerous anechoic areas visible inside, exhibiting a honeycomb-like pattern of change (orange arrow); D: Abundant blood flow signals are observed within the lesion, with a blood flow resistance of 0.44 (orange arrow).
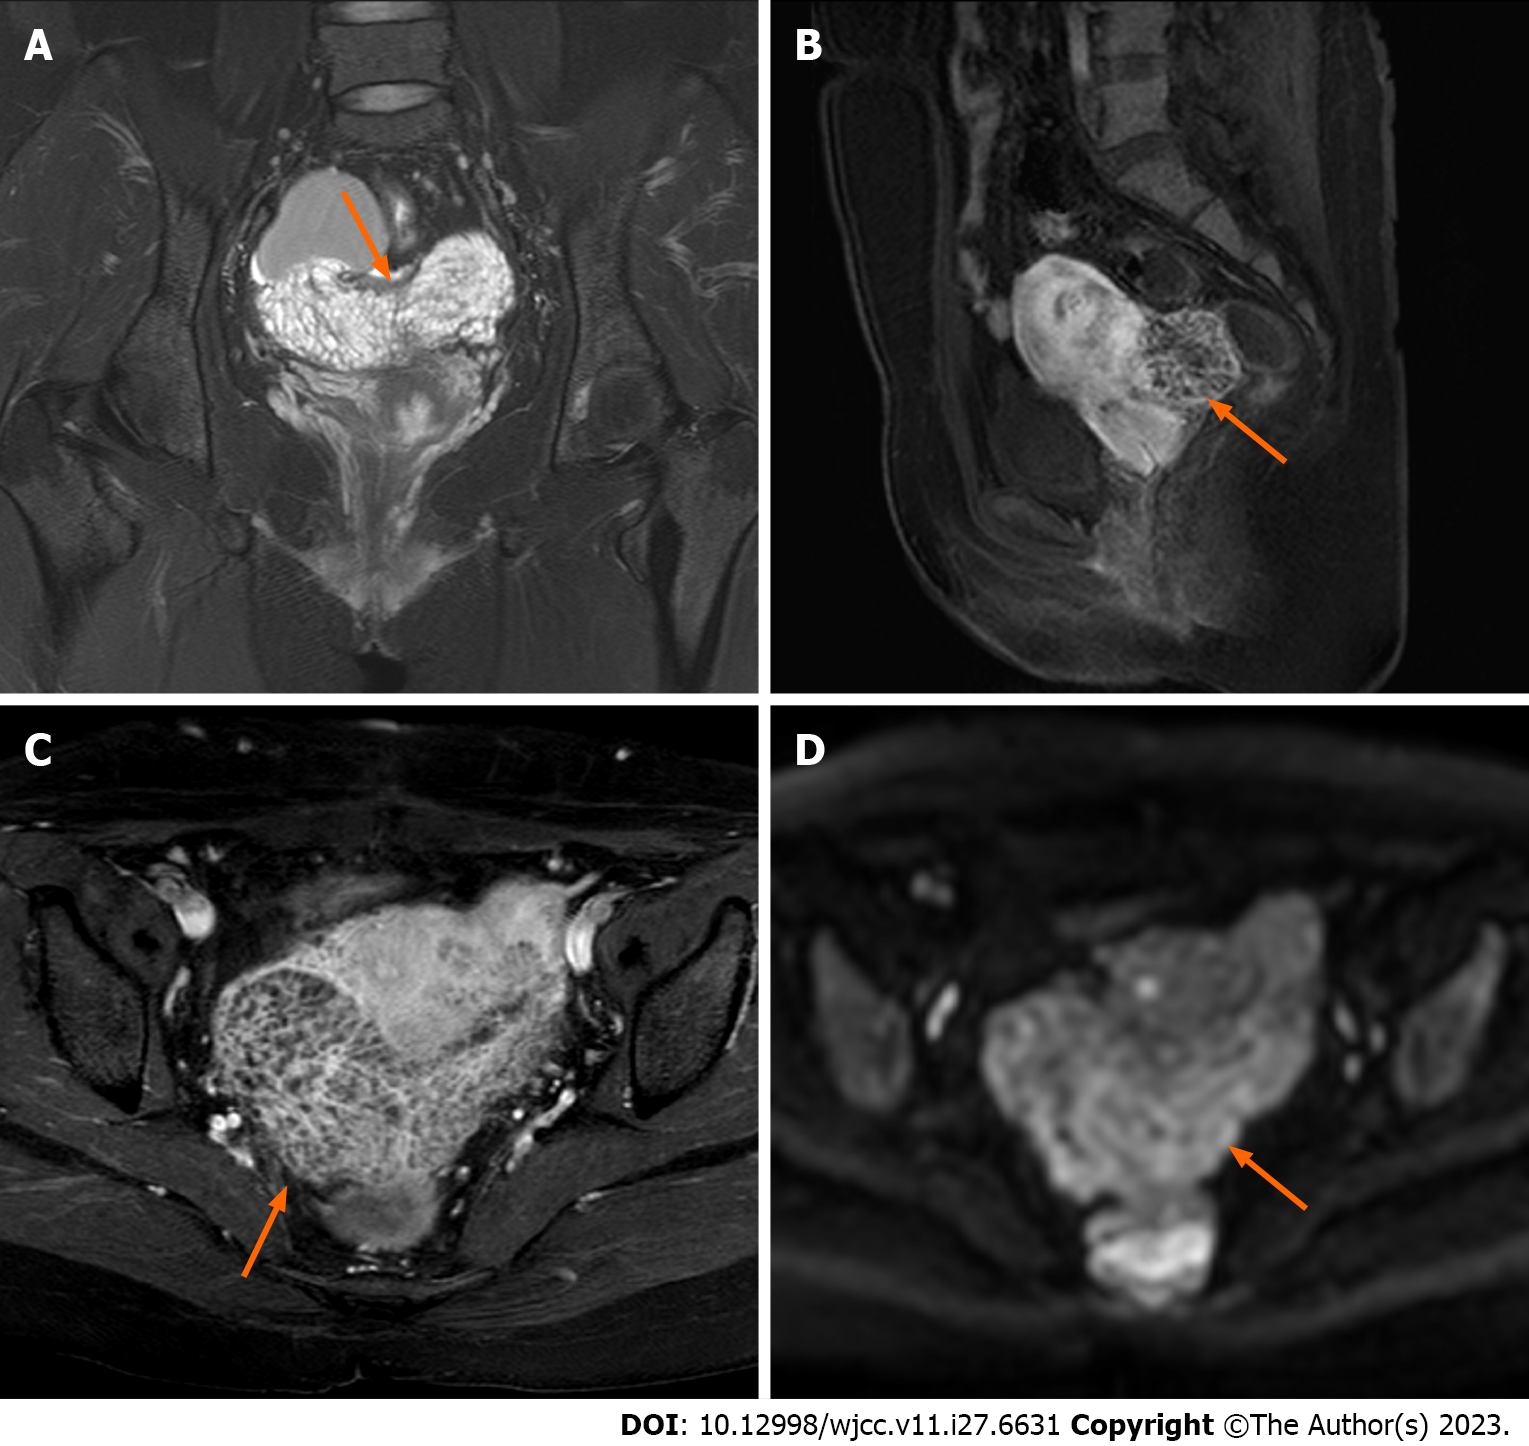
Figure 3 Magnetic resonance imaging scans acquired after one month of cessation of gonadotropin-releasing hormone agonist therapy.
A: In the coronal plane, the lesion displays a subtle elevation in signal intensity on T2-weighted imaging, characterized by diffuse and homogenous fine septal modifications internally (orange arrow); B and C: In the sagittal and axial enhanced scans, the lesion demonstrates a slightly higher enhancement in both the margins and internal septations (orange arrow); D The lesion exhibits a slight increase in the diffusion-weighted imaging signal (orange arrow).
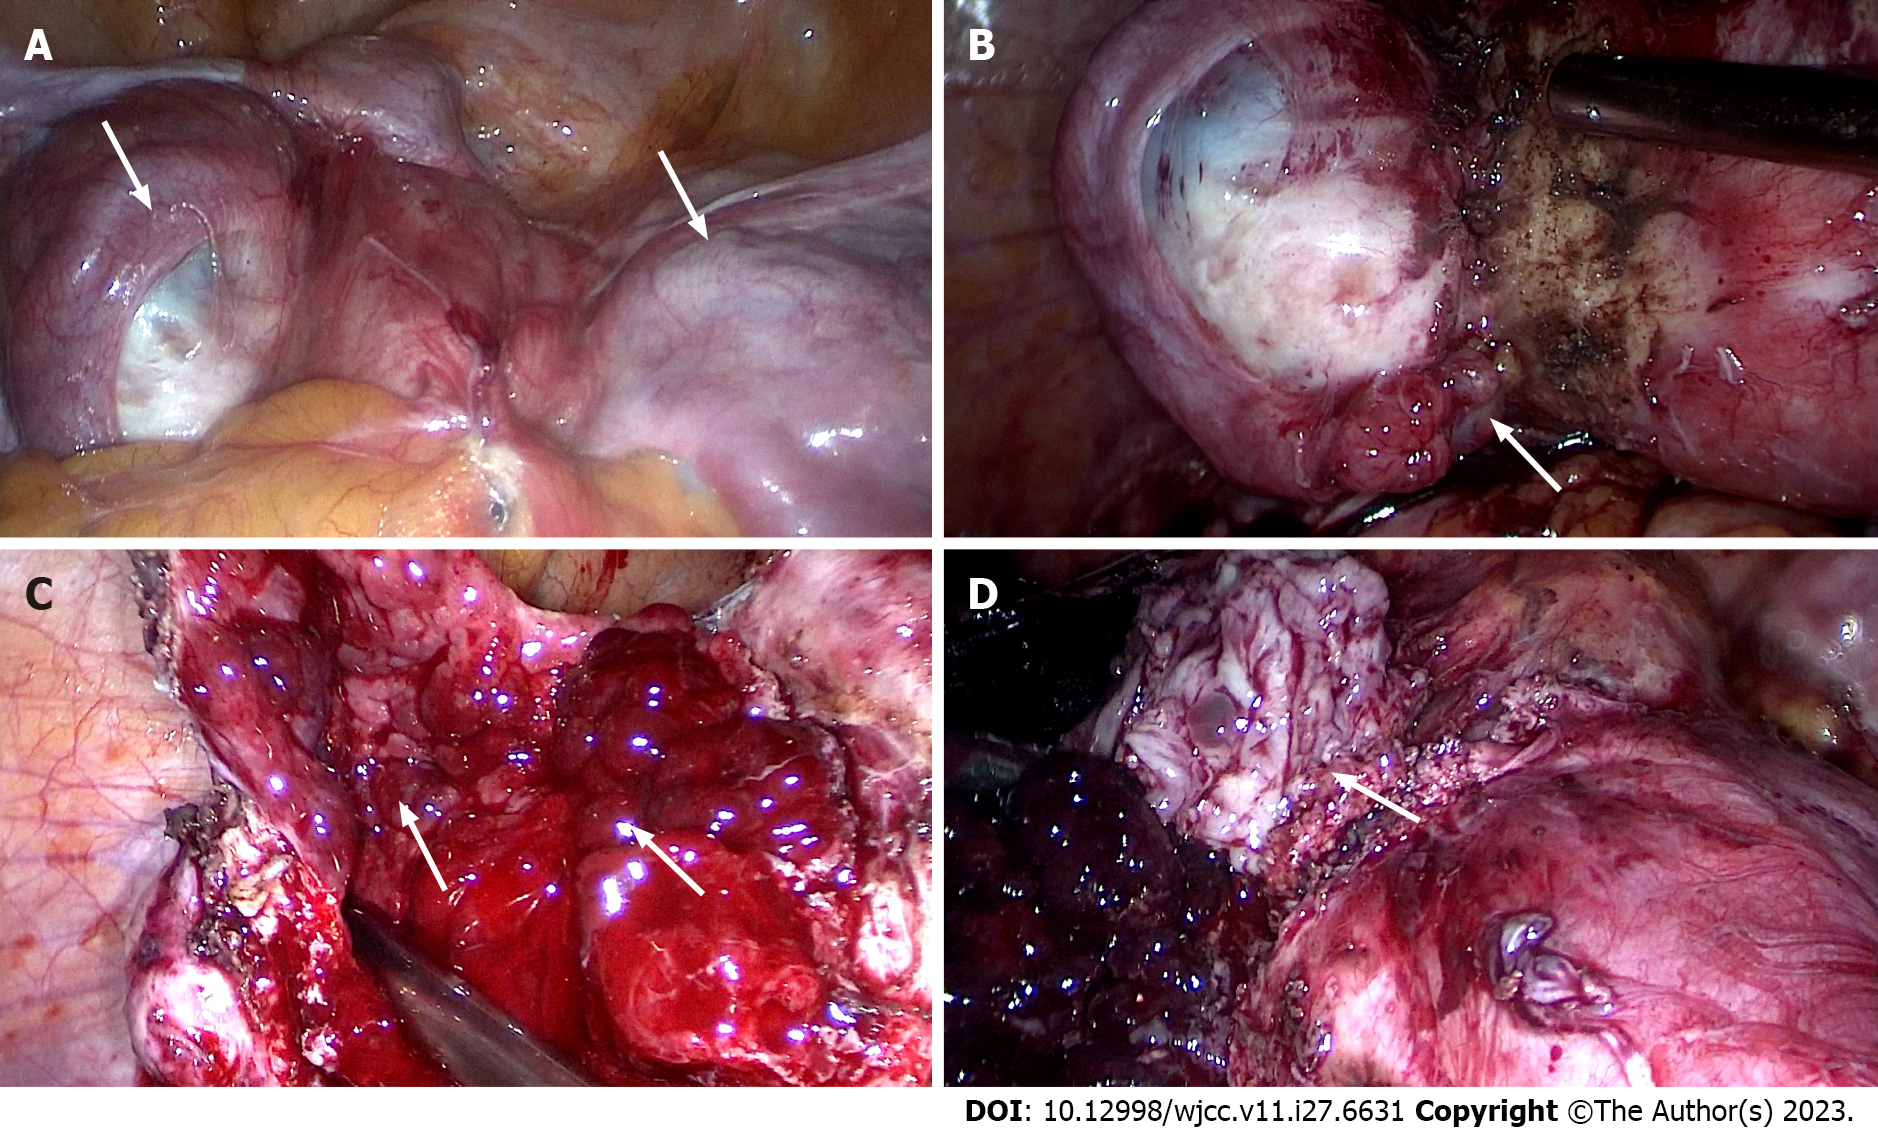
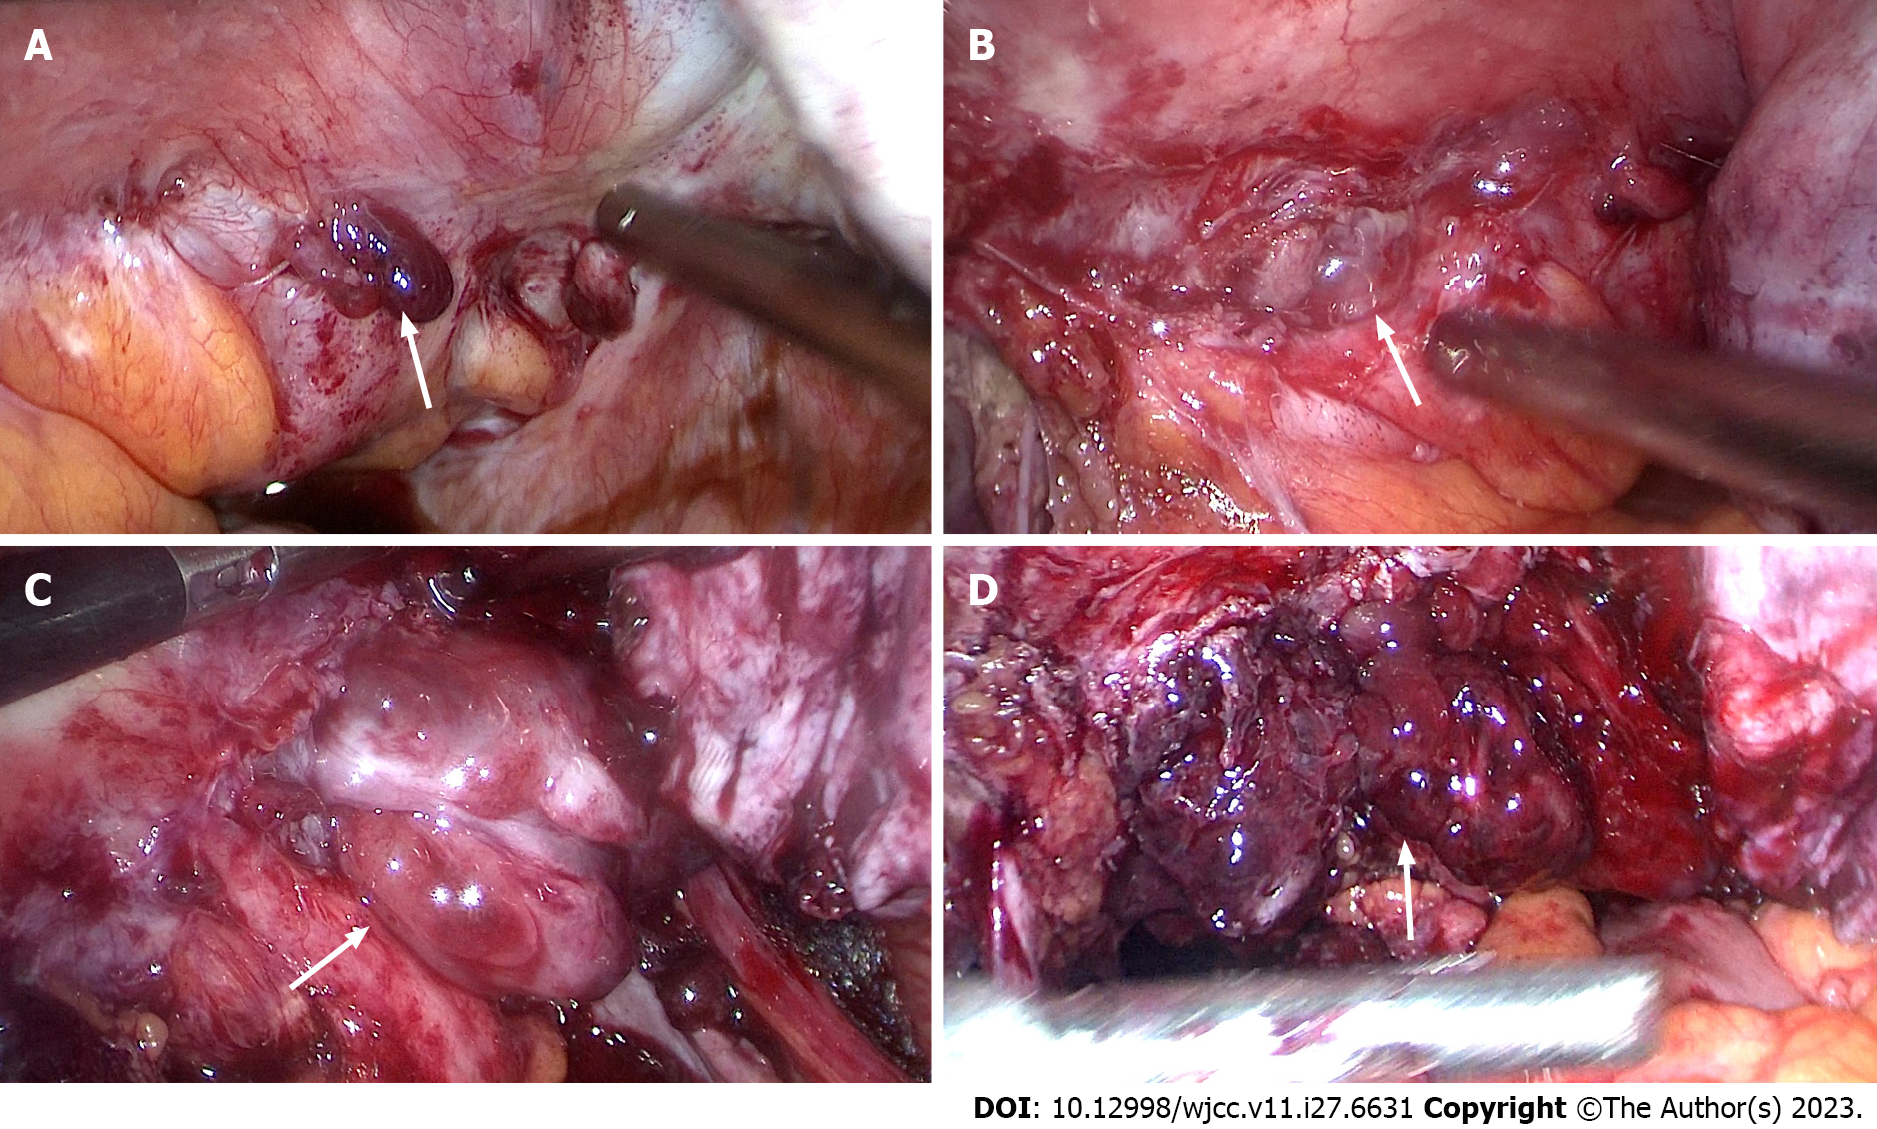
Figure 4 Images captured during laparoscopic surgery.
A: The anterior wall of the uterus before surgery, and cysts were seen on both sides of the uterus and the inferior anterior walll (white arrow); B: Polypoid nodules emerge during the separation of the left wall cyst adhesionl (white arrow); C: Cysts filled with polypoid nodules are observed after complete incision of the left wall cystl (white arrow); D: After incision of the cyst in the lower segment of the anterior wall of the uterus, it was covered with polypoid nodulesl (white arrow).
Figure 5 Images captured during laparoscopic surgery.
A: The posterior wall of the uterus before surgery, and the cyst tightly adheres to the colorectum of the posterior wall of the uterusl (white arrow); B and C: Many polyp nodules are shown during the adhesion process of the separation of the posterior walll (white arrow); D: After the submural cyst was incised, it was covered with polypoid nodulesl (white arrow).
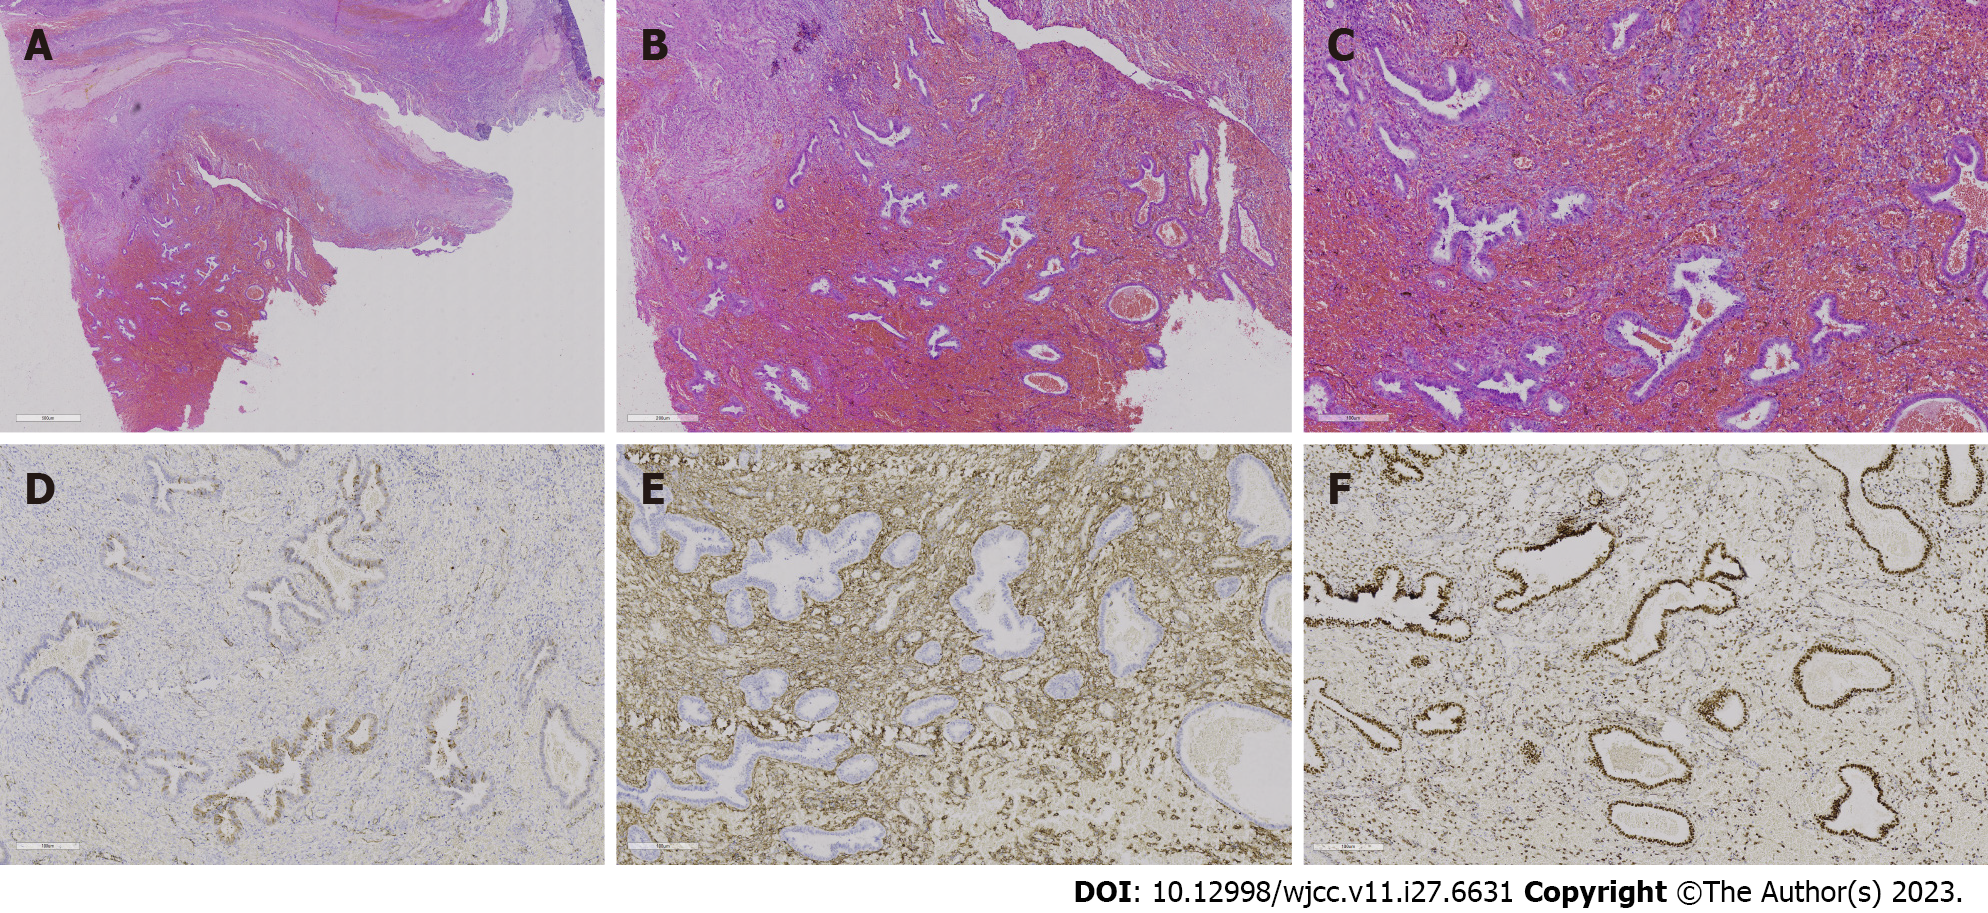
Figure 6 Histopathological analysis and immunohistochemical examination of the resected specimen.
A-C: Hepatic encephalopathy 10 ×, 20 ×, and 40 ×, respectively. Endometrial stroma and glands are observed in the cyst, and extensive haemorrhagic foci are shown without typical thick-walled blood vessels; D: Represents P16, and the visible part of the endometrial glands is positive [immunohistochemistry (IHC) 20 ×]; E: CD10 and endometrial stromal expression is strongly positive, but the glands are negative (IHC 20 ×); F: Represents the oestrogen receptor, with the endometrial glands strongly positive and the stroma partially positive (IHC 20 ×).
- Citation: Zhang DY, Peng C, Huang Y, Cao JC, Zhou YF. Rapidly growing extensive polypoid endometriosis after gonadotropin-releasing hormone agonist discontinuation: A case report. World J Clin Cases 2023; 11(27): 6631-6639
- URL: https://www.wjgnet.com/2307-8960/full/v11/i27/6631.htm
- DOI: https://dx.doi.org/10.12998/wjcc.v11.i27.6631


