Copyright
©The Author(s) 2023.
World J Clin Cases. Sep 26, 2023; 11(27): 6523-6530
Published online Sep 26, 2023. doi: 10.12998/wjcc.v11.i27.6523
Published online Sep 26, 2023. doi: 10.12998/wjcc.v11.i27.6523
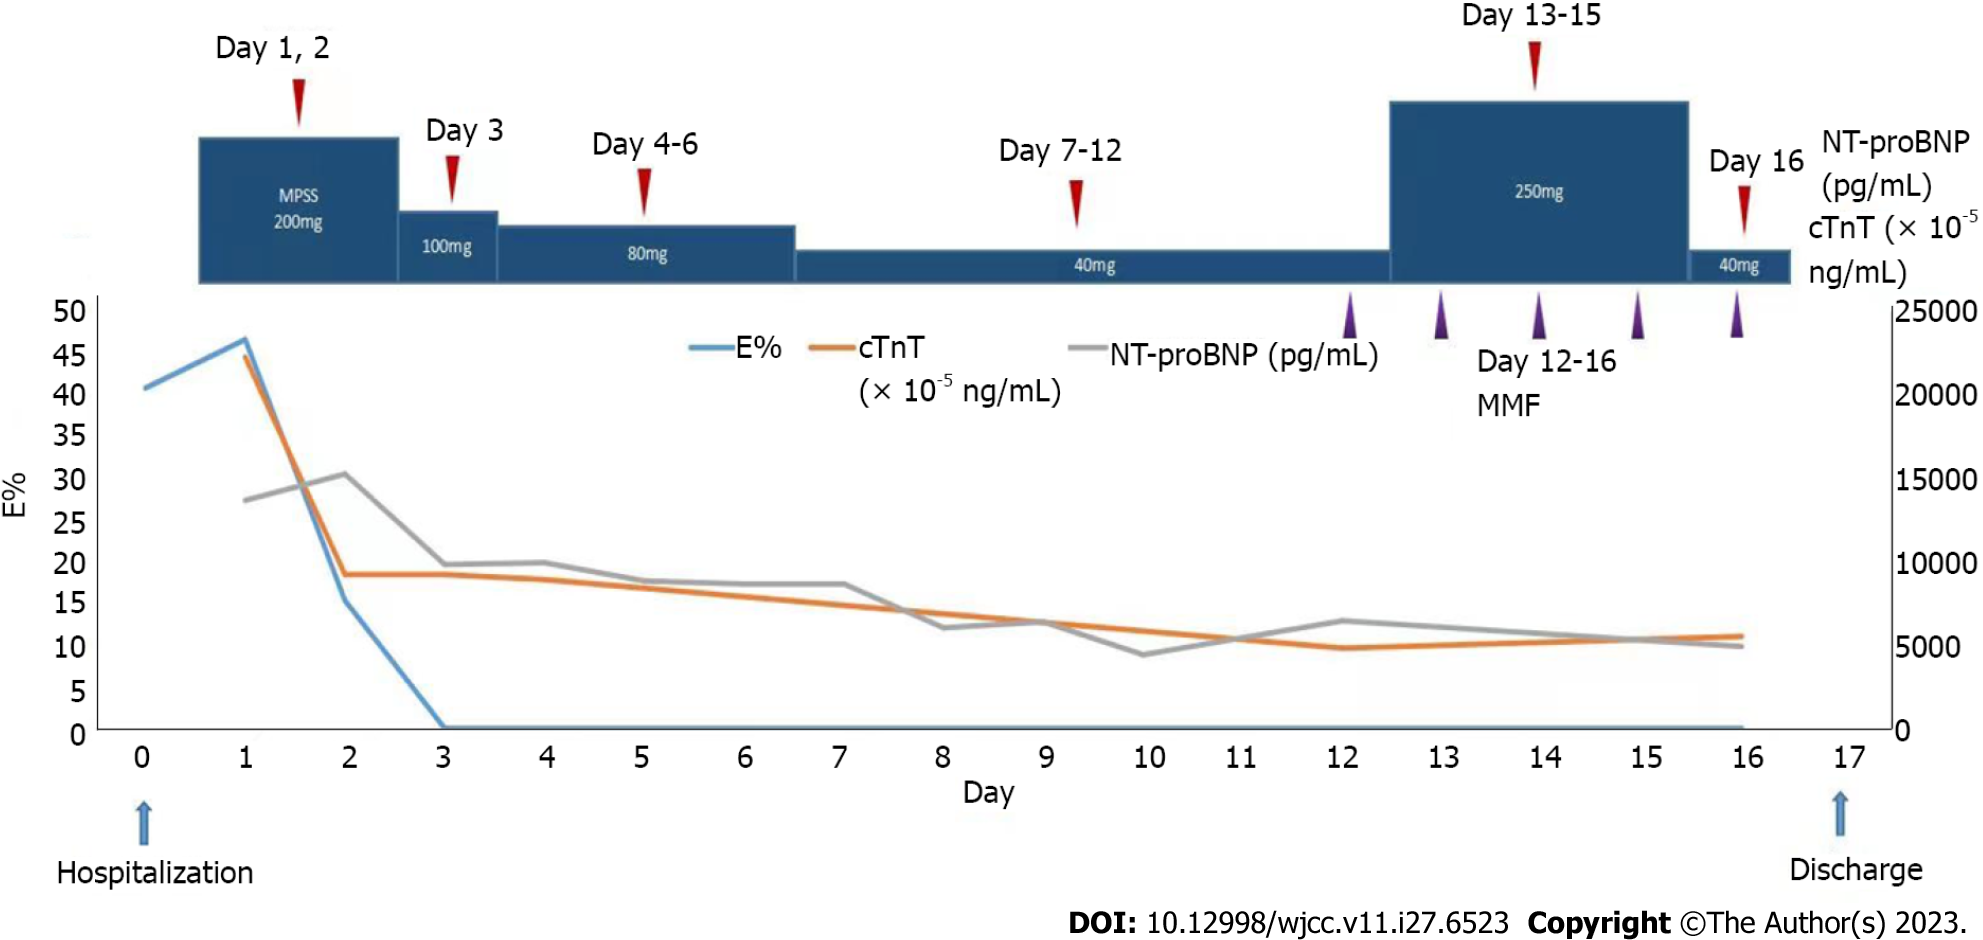
Figure 1 Treatment Response Indicators Post-Therapy with Methylprednisolone Sodium Succinate and Mycophenolate Mofetil.
Rapid reductions in Eosinophil (E%), cardiac troponin T, and N-terminal pro-B-type natriuretic peptide following treatment are presented. cTnT: Cardiac troponin T; NT-proBNP: N-terminal pro-B-type natriuretic peptide.
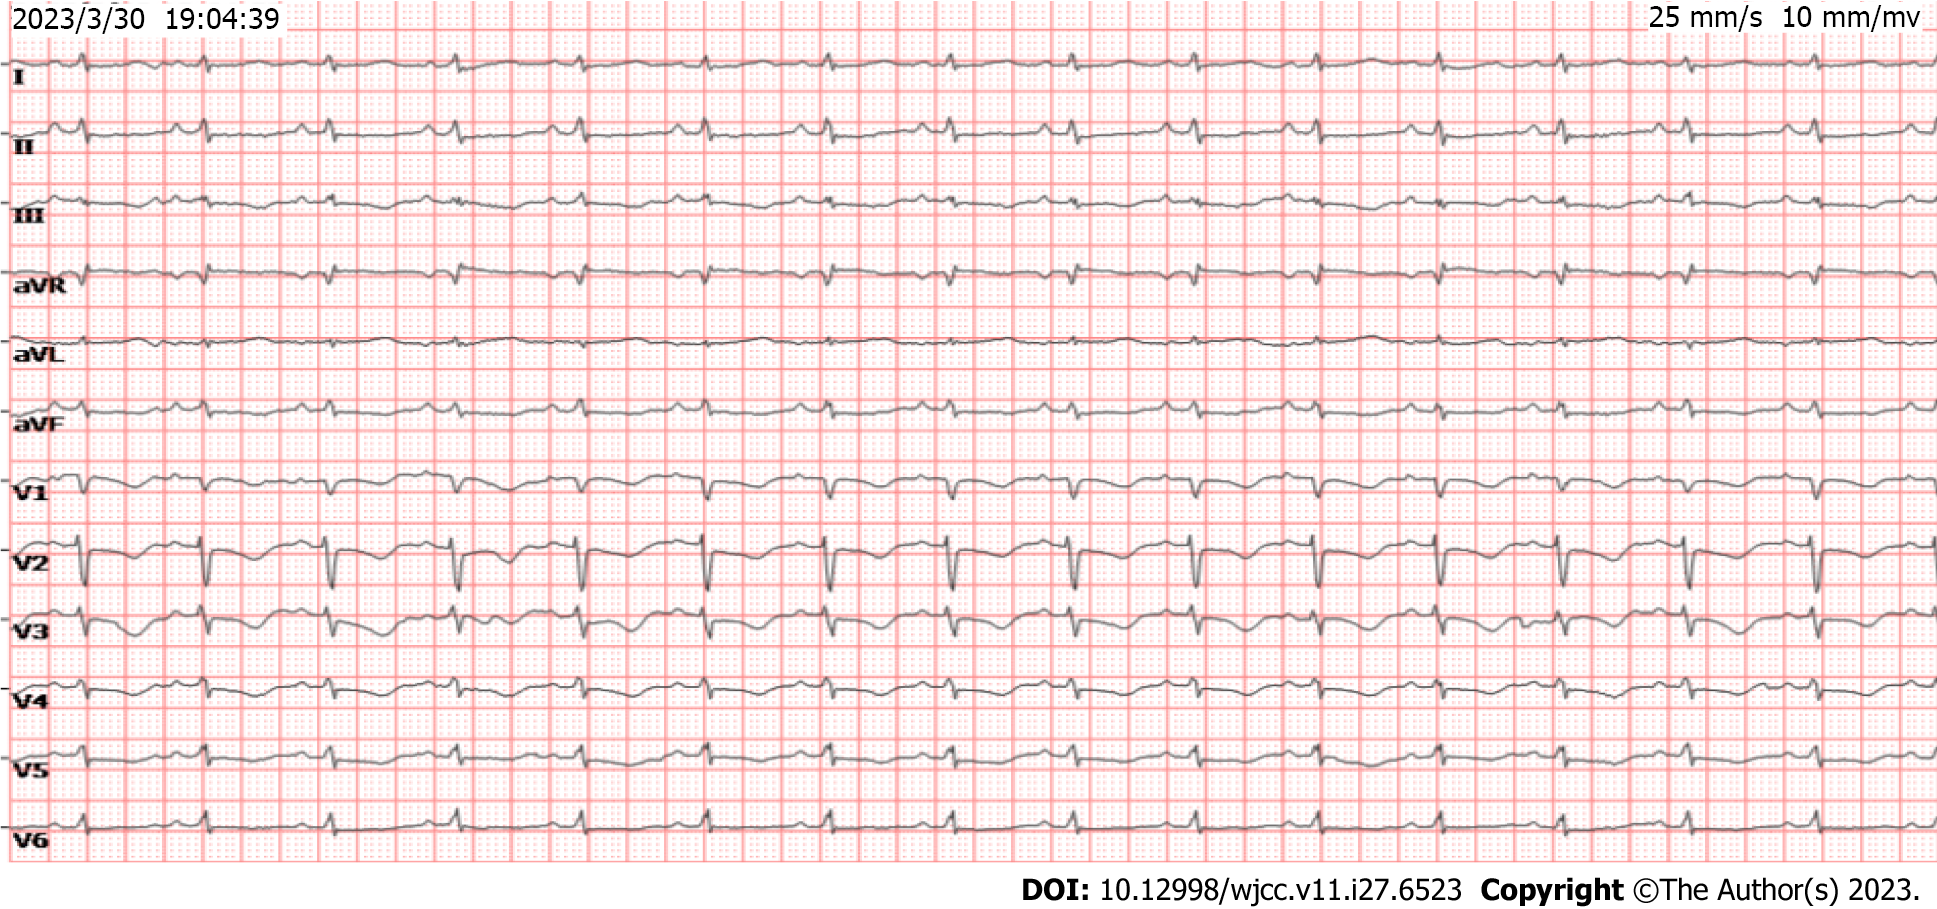
Figure 2 Electrocardiogram upon patient admission.
Displayed findings include a sinus rhythm at 93 bpm, ST-segment depression, T-wave inversion in leads II, III, aVF, and V1-V3, and the presence of an SITIII manifestation.
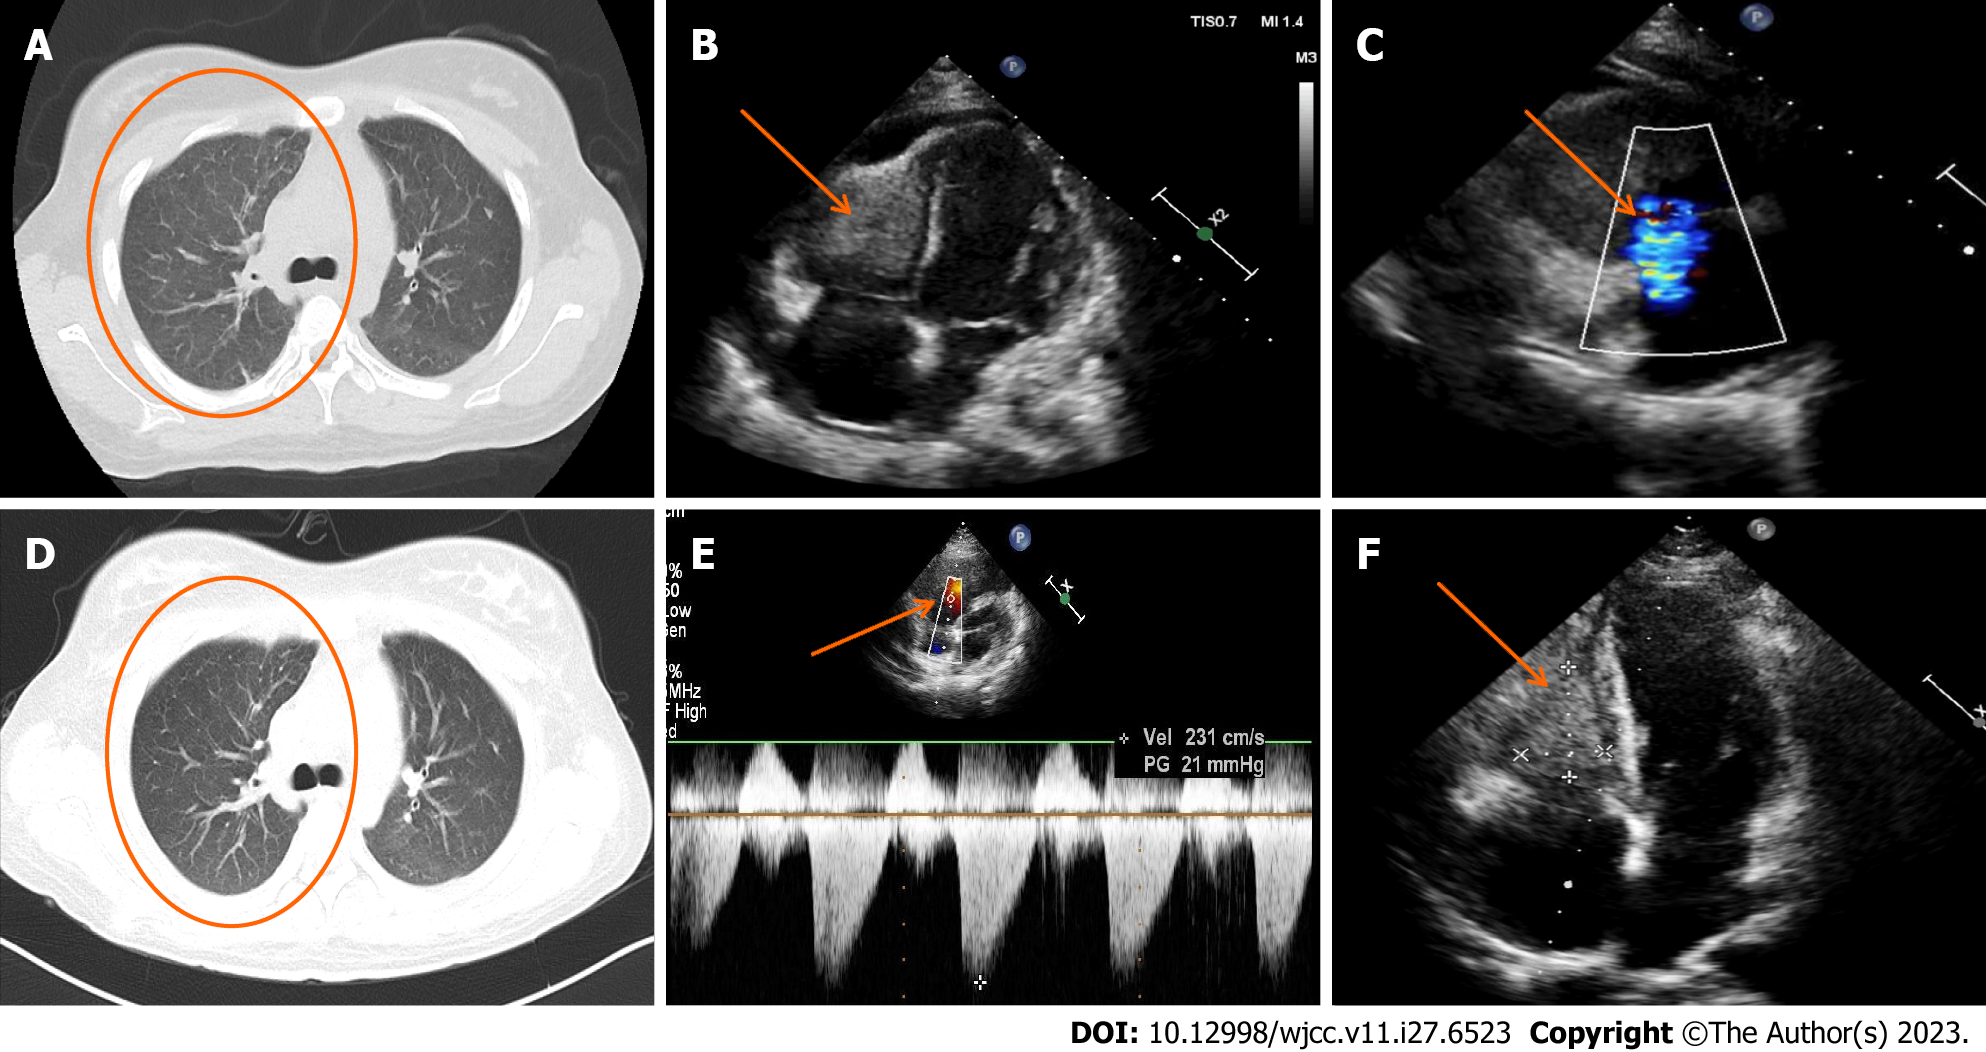
Figure 3 Comparative echocardiogram and chest computed tomography imaging pre- and post-treatment.
A: Chest computed tomography (CT; lung window image) from March 30, 2023; B and C: Pre-treatment echocardiogram illustrating right ventricular enlargement and a hypoechoic mass (dimensions: 25 mm × 24 mm × 38 mm) in the right ventricular wall; C: Significant regurgitation observed at the tricuspid valve; D: Comparative chest CT from April 7, 2023, post one week of glucocorticoid treatment, displaying diminished exudative foci in both lungs; E: Post-treatment echocardiogram indicating a tricuspid regurgitation peak flow rate of 231 cm/s, and a differential pressure of 21 mmHg, suggestive of regular systolic right ventricular pressure; F: Reduced echo size of right ventricular thrombus post-treatment.
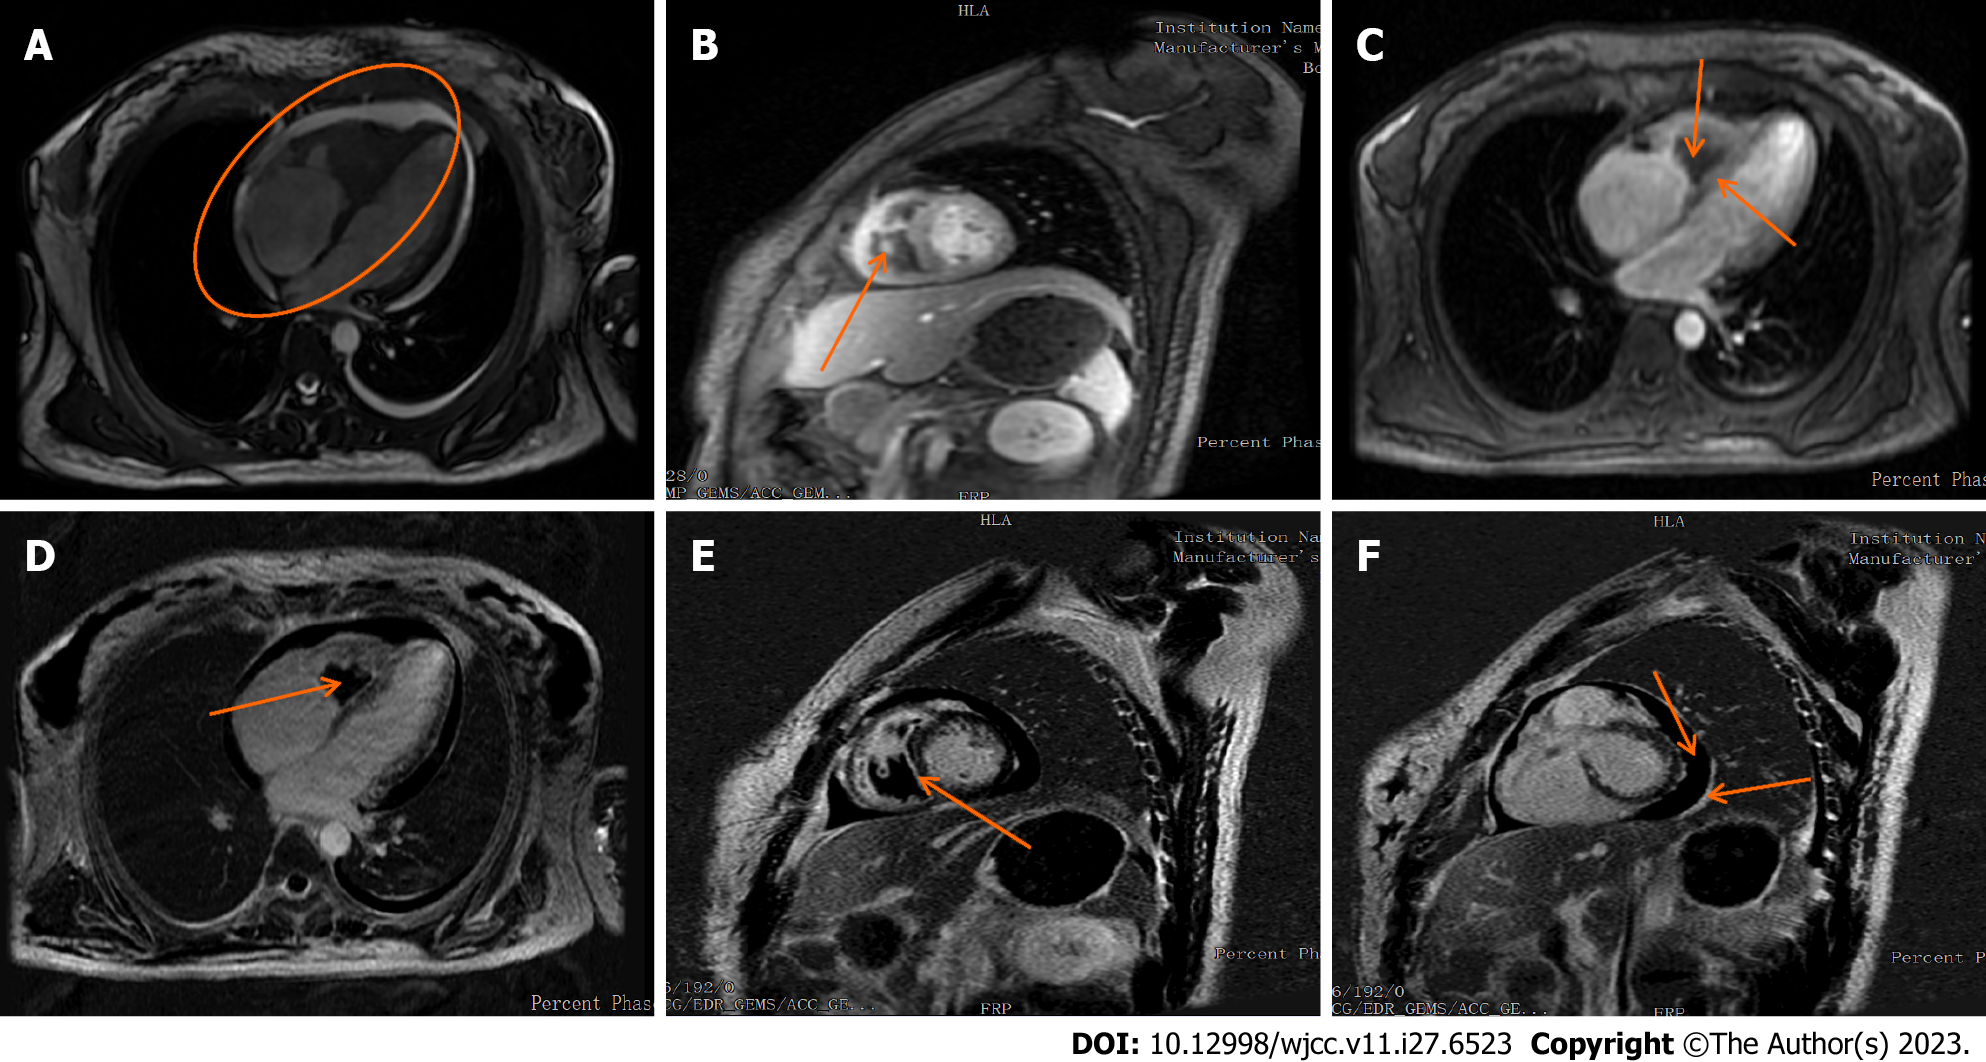
Figure 4 Cardiovascular magnetic resonance imaging illustrating cardiac changes.
A: Enlarged right atrial volume and thickened right ventricular endocardium; B: Central right ventricle displaying a low-signal filling defect; C: Myocardial first-perfusion highlighting a perfusion defect in the right ventricle with arcuate hypoperfusion areas located in the septum and right ventricular subendocardium; D: Delayed enhancement image illustrating no right ventricular enhancement; E: Delayed enhancement depicting high signal shadows present in the ventricular septum and on both ventricular walls; F: Delayed enhancement image showing minimal pericardial effusion and thickened pericardium.
- Citation: He JL, Liu XY, Zhang Y, Niu L, Li XL, Xie XY, Kang YT, Yang LQ, Cai ZY, Long H, Ye GF, Zou JX. Eosinophilic granulomatosis with polyangiitis, asthma as the first symptom, and subsequent Loeffler endocarditis: A case report. World J Clin Cases 2023; 11(27): 6523-6530
- URL: https://www.wjgnet.com/2307-8960/full/v11/i27/6523.htm
- DOI: https://dx.doi.org/10.12998/wjcc.v11.i27.6523


