Copyright
©The Author(s) 2023.
World J Clin Cases. Sep 26, 2023; 11(27): 6383-6397
Published online Sep 26, 2023. doi: 10.12998/wjcc.v11.i27.6383
Published online Sep 26, 2023. doi: 10.12998/wjcc.v11.i27.6383
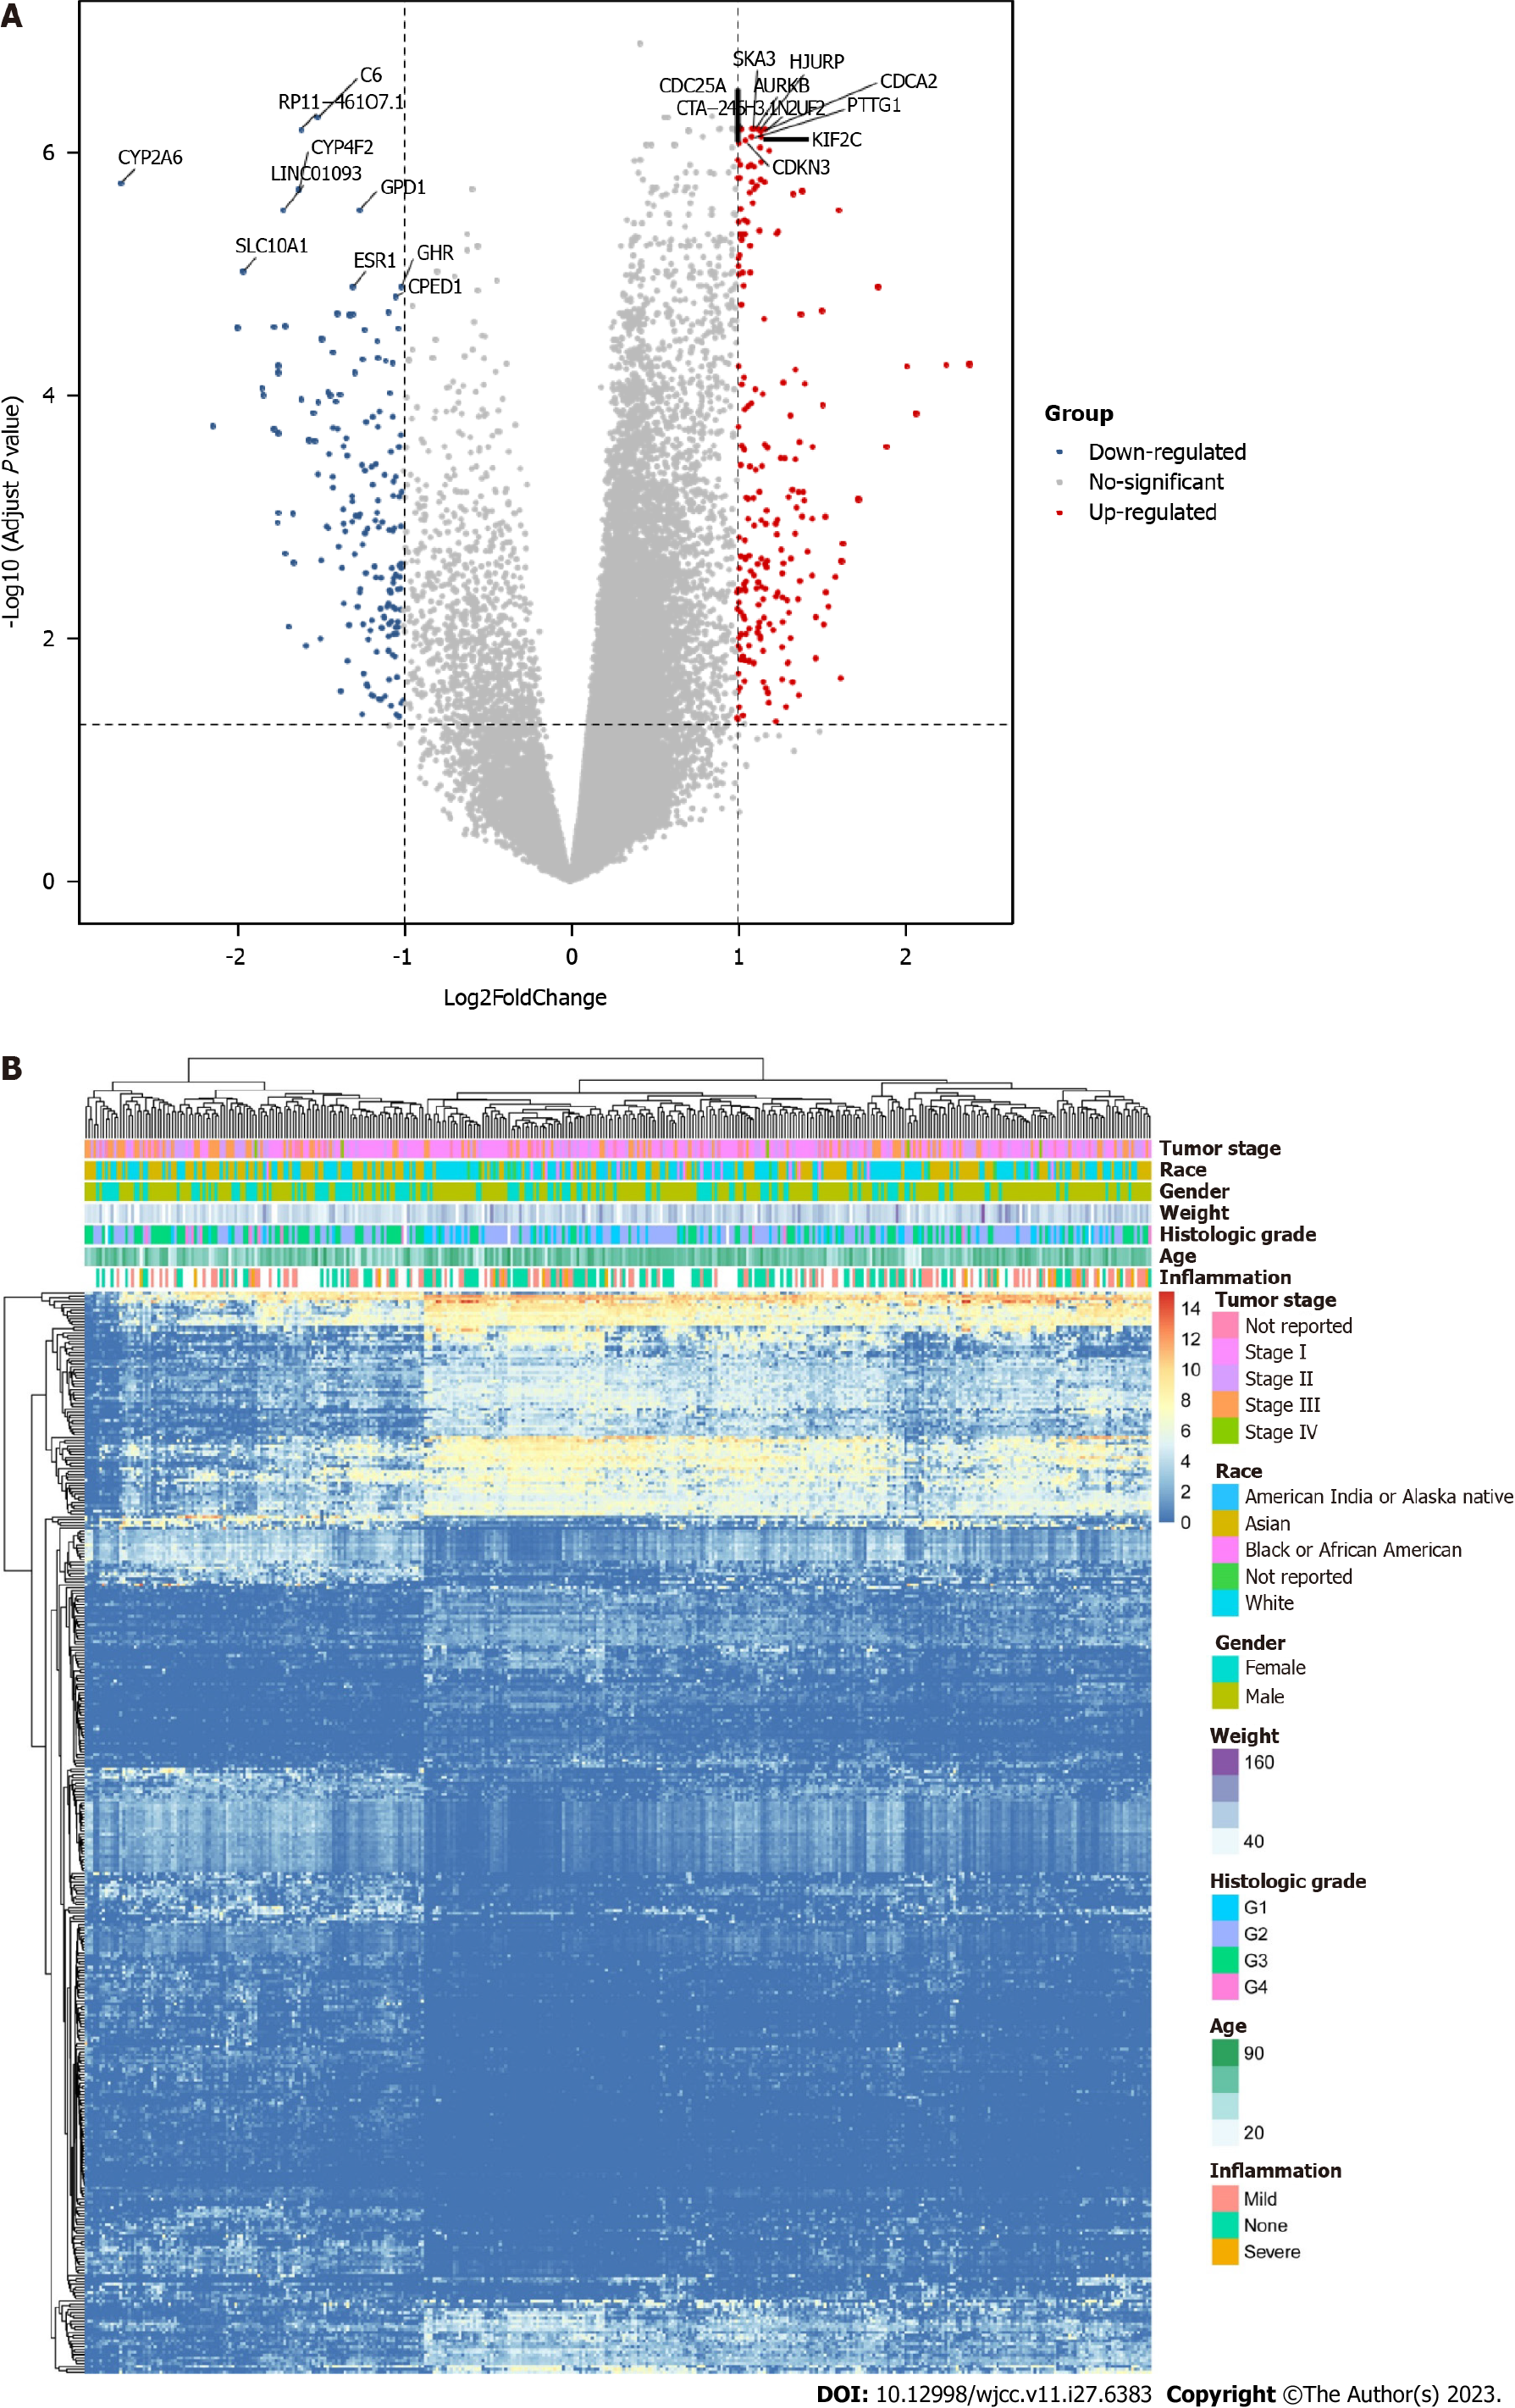
Figure 1 Differential expression analysis.
A: Differential analysis between low-grade and high-grade hepatocellular carcinoma (HCC); B: Heatmap of differentially expressed genes in HCC.
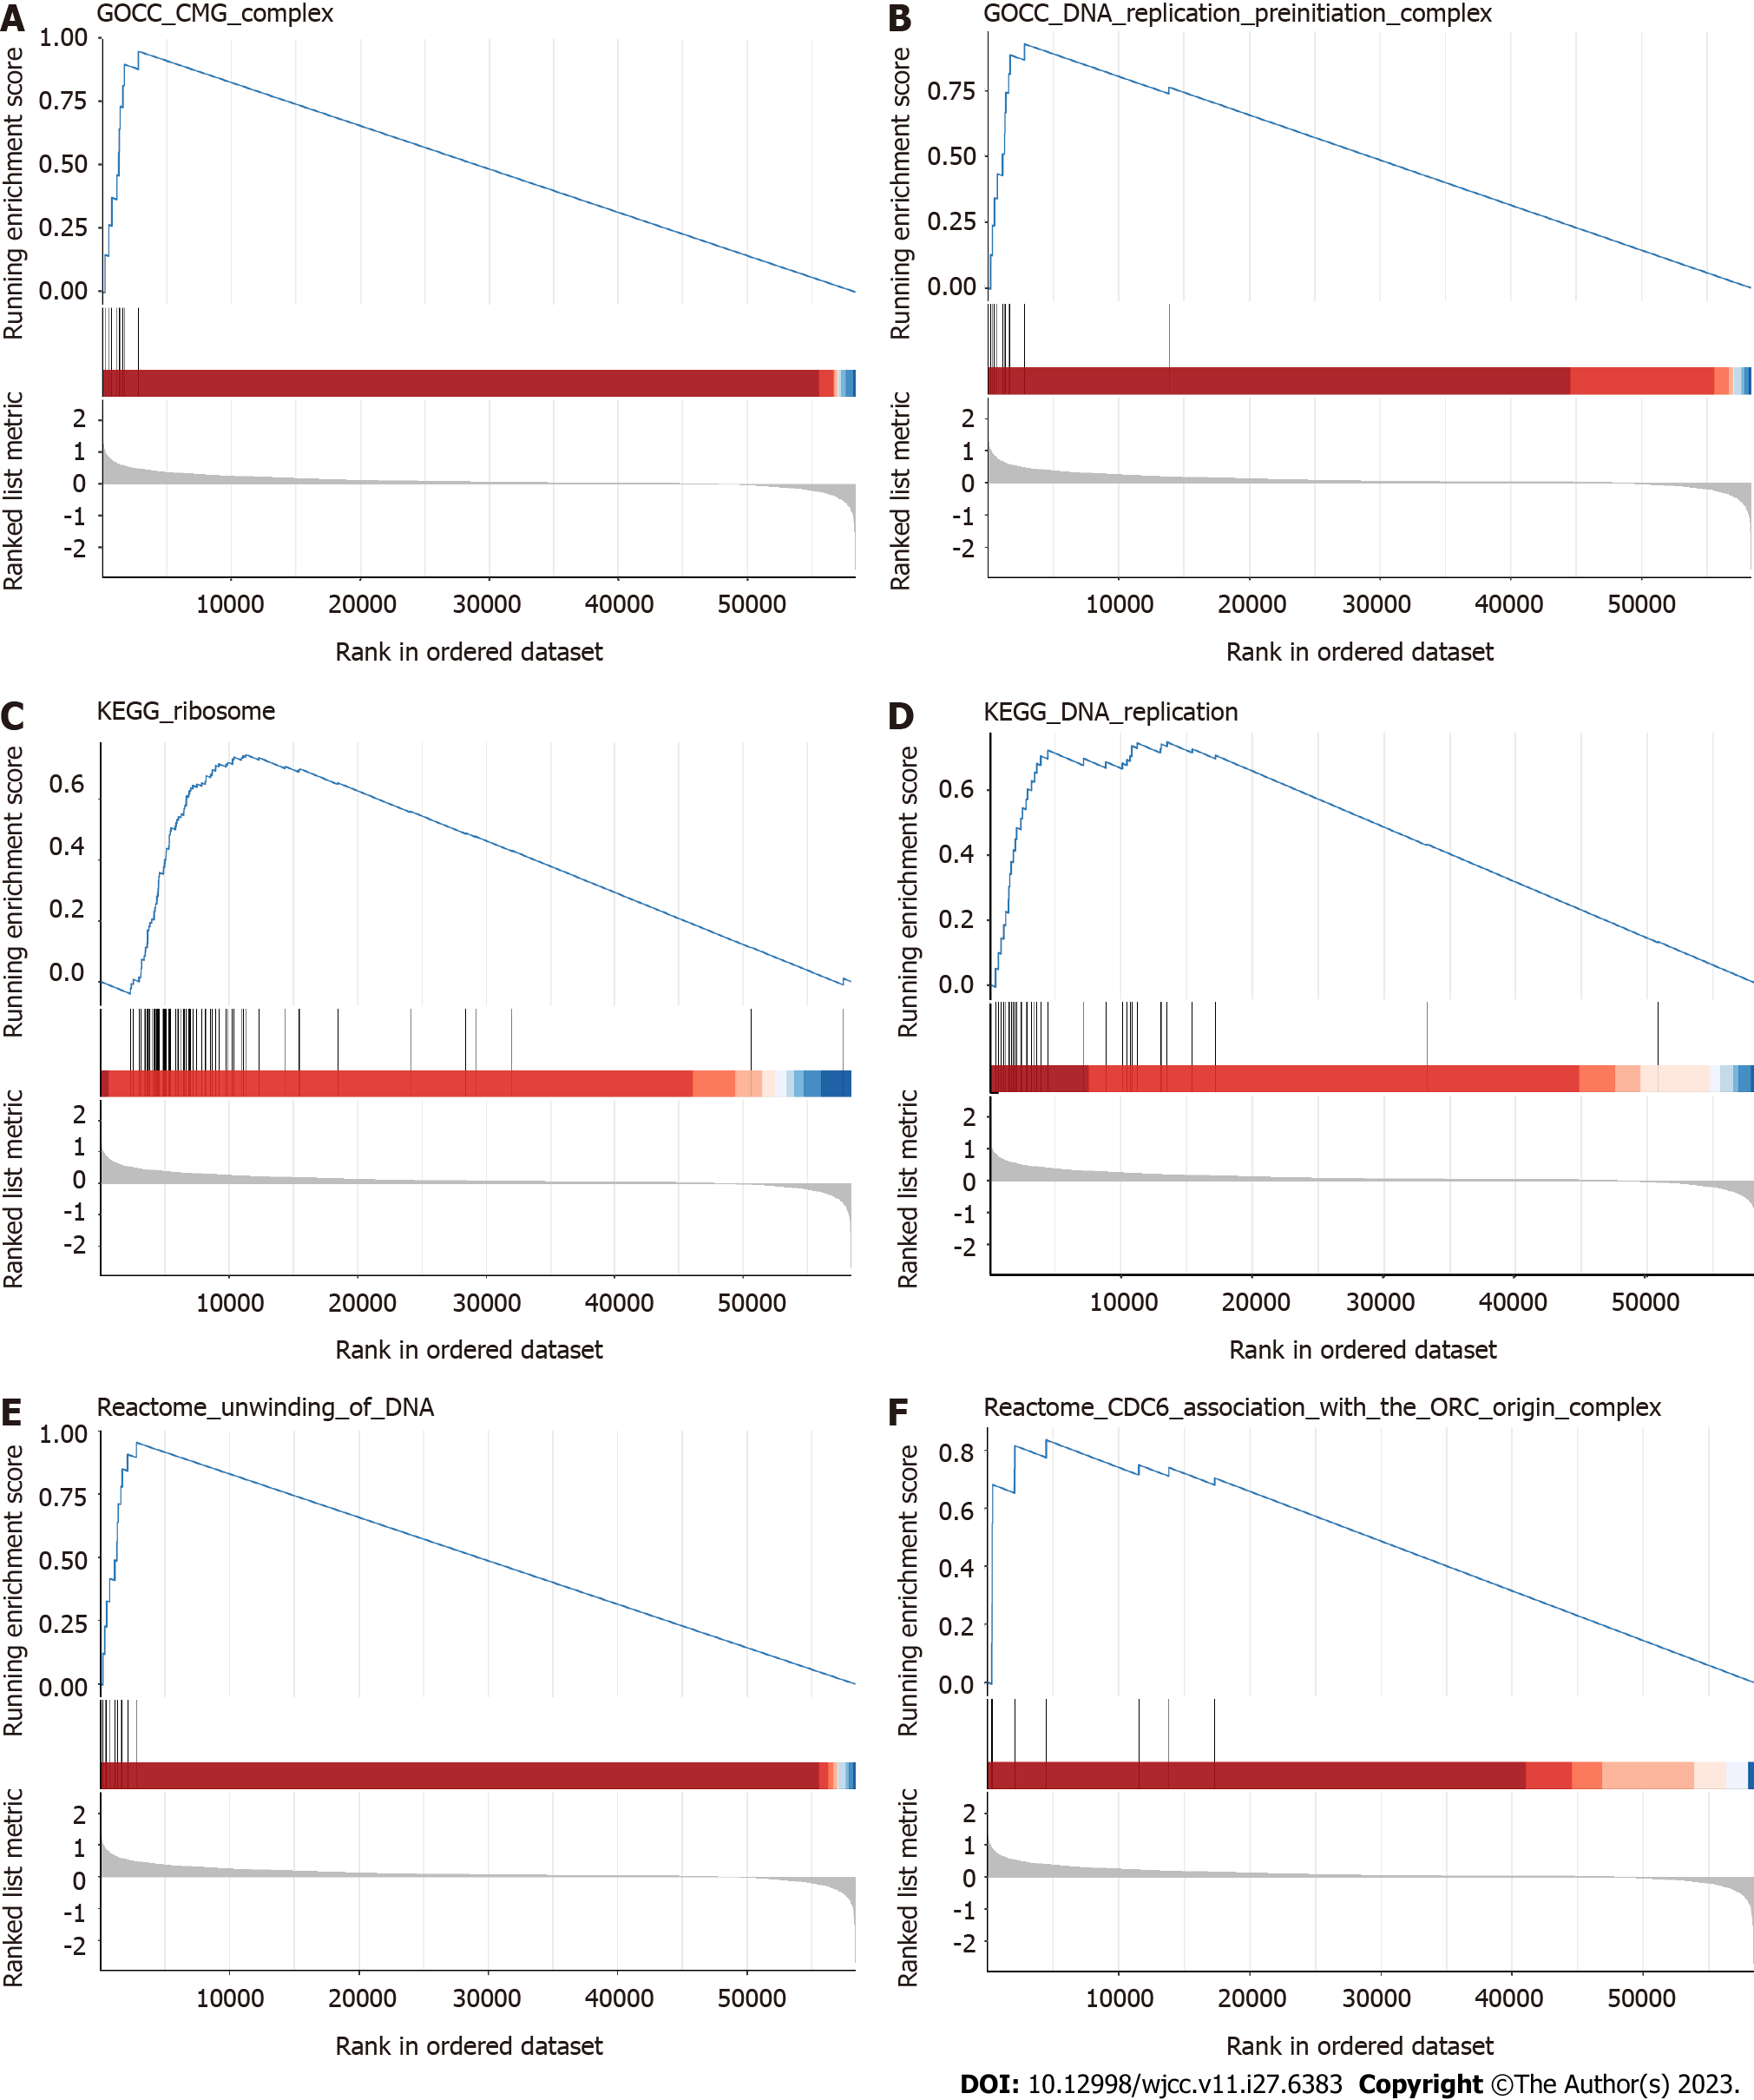
Figure 2 Functional analysis.
A-F: Gene set enrichment analysis in the CMG complex, DNA replication preinitiation complex, ribosome, DNA replication, unwinding of DNA, and CDC6 association with the ORC origin complex pathways.
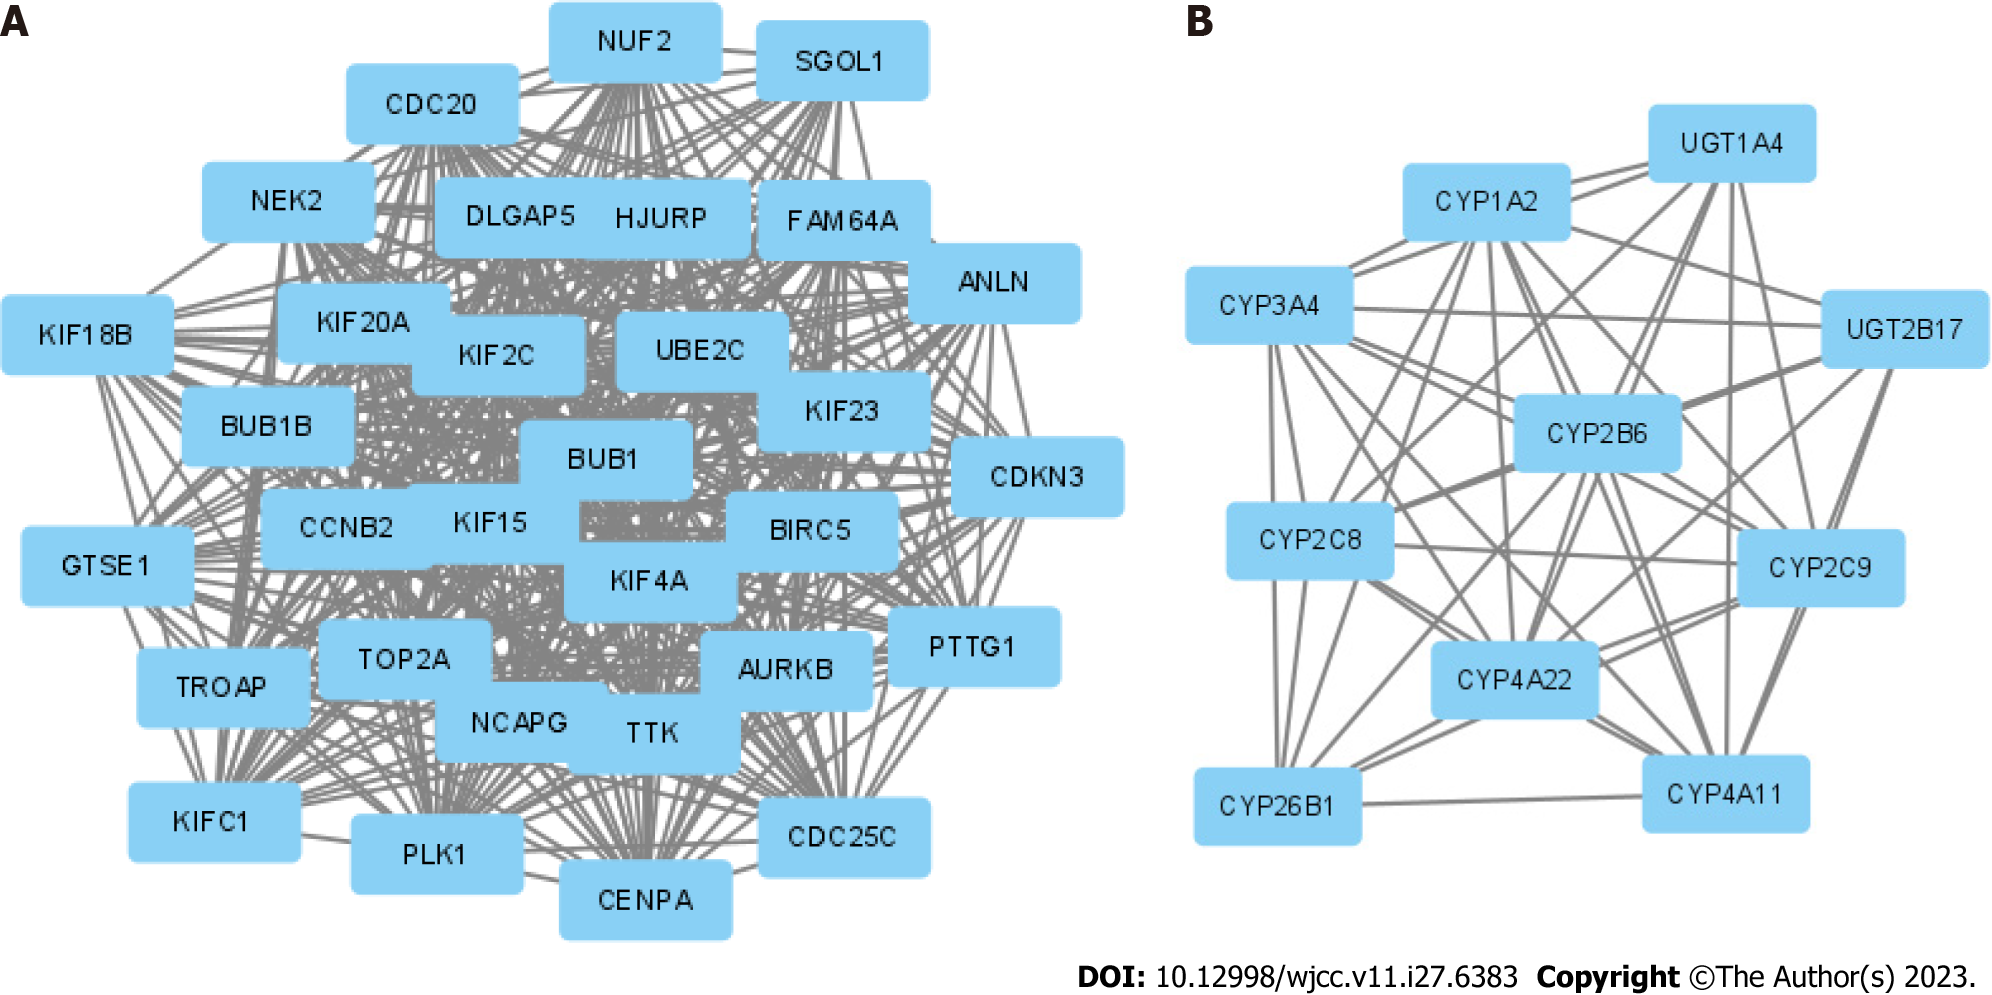
Figure 3 Protein-protein interaction network complex and modular analysis of differentially expressed genes.
A and B: Top 2 protein-protein interaction networks in molecular complex detection analysis.
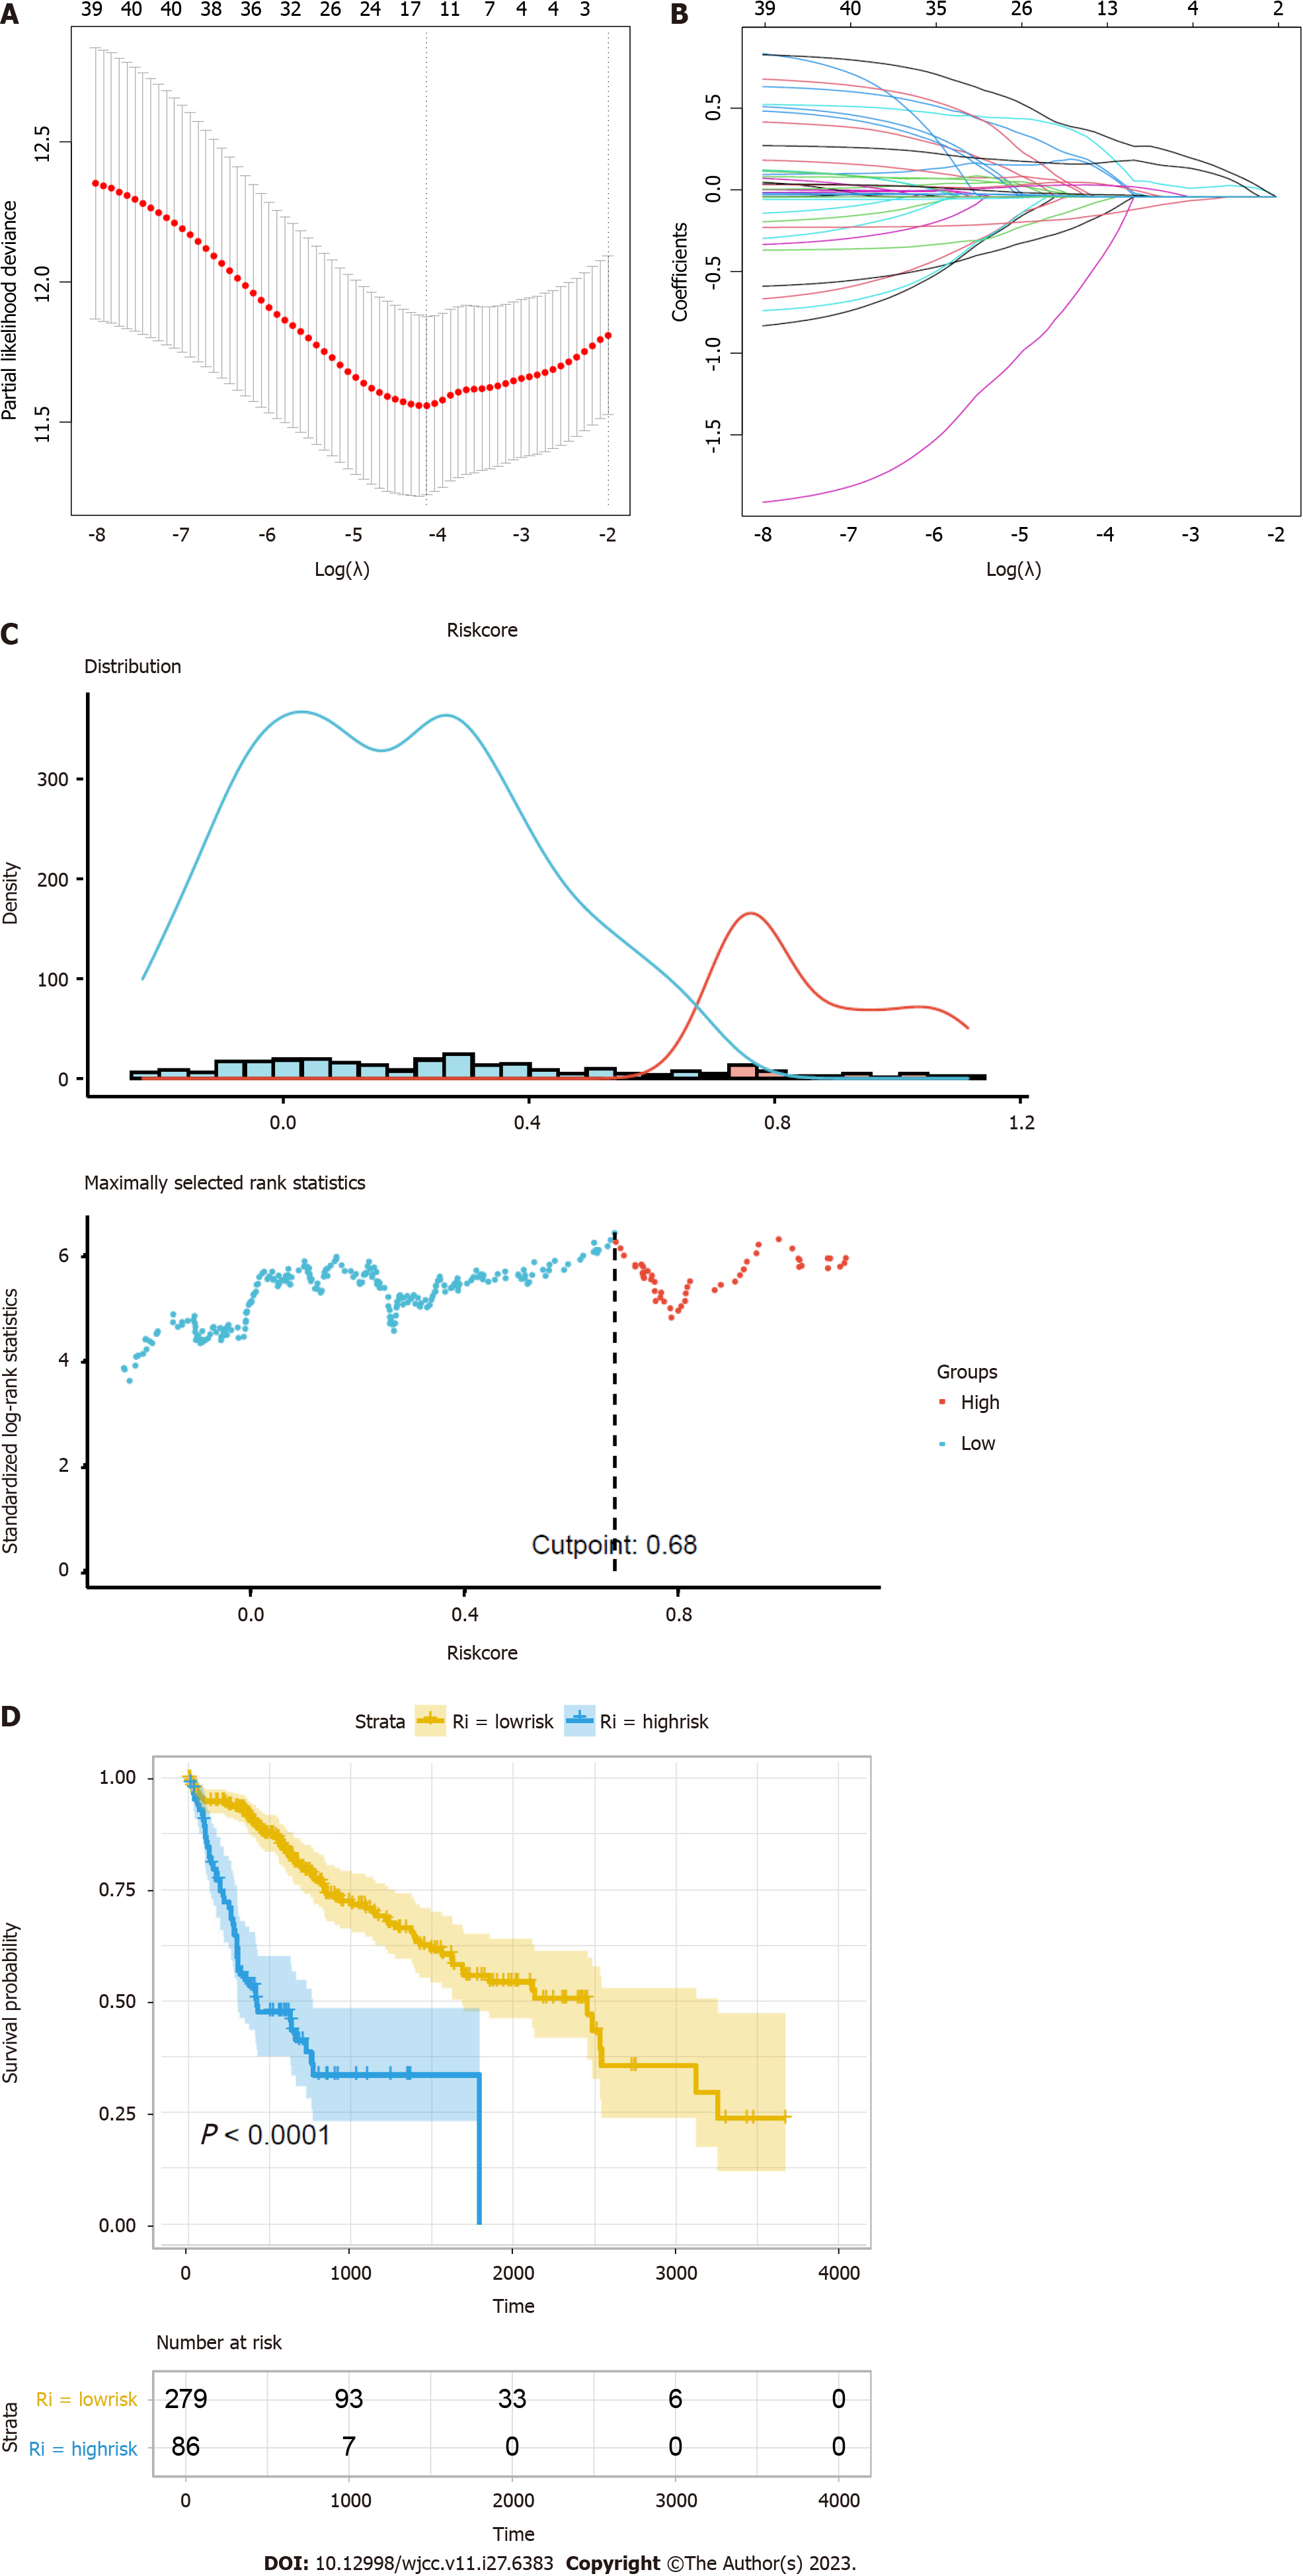
Figure 4 Construction of a prognostic model.
A: Ten-time cross-validation for tuning parameter selection in the least absolute shrinkage and selection operator (LASSO) model; B: LASSO coefficient profiles of the 41 hub genes; C: Distribution plots of the risk score; D: Kaplan-Meier curves between the high- and low-risk groups.
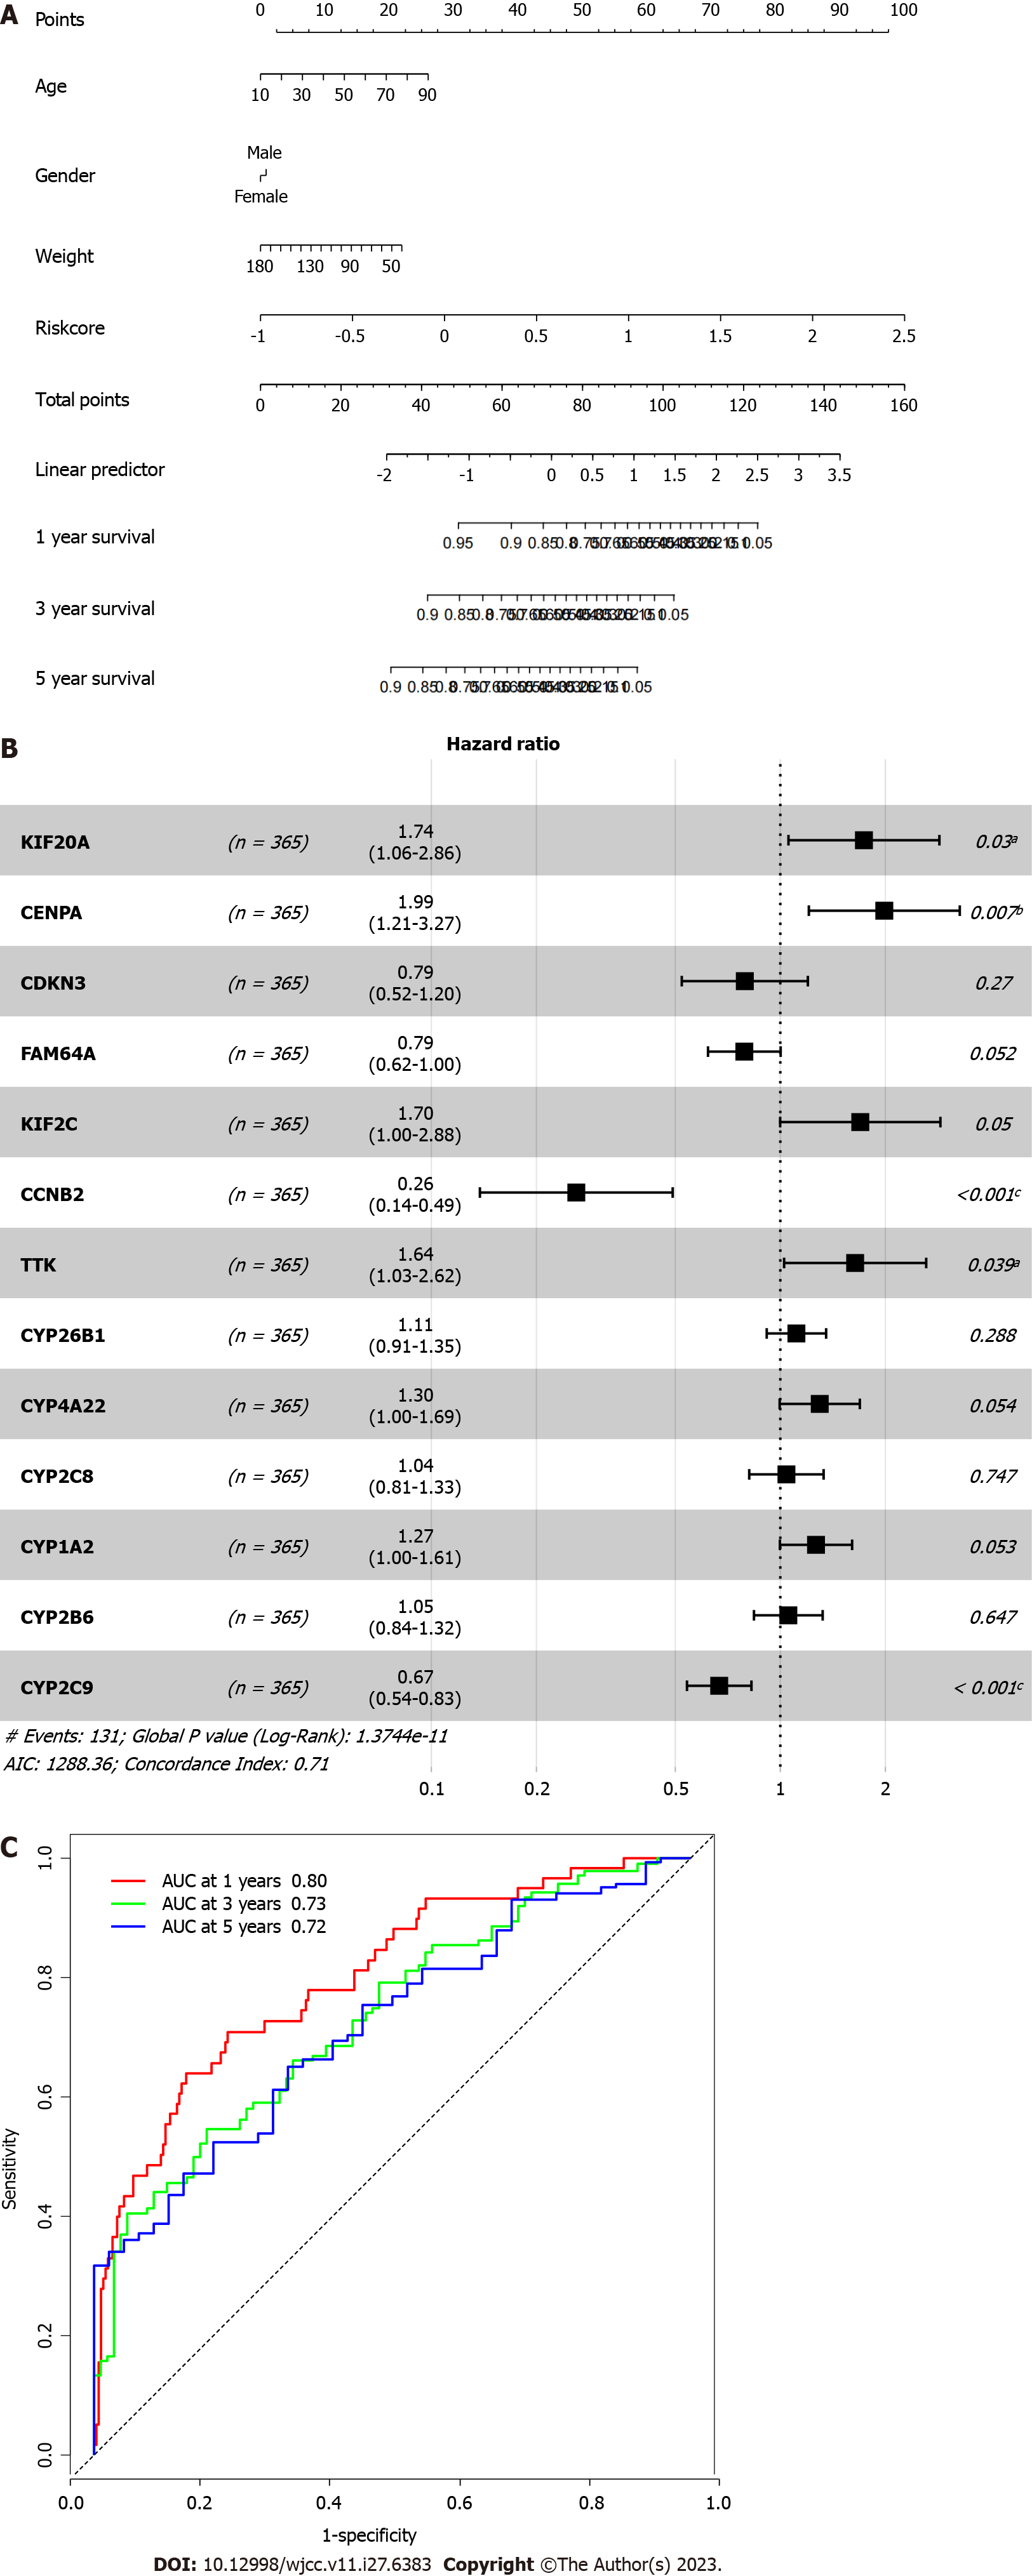
Figure 5 Prognostic value of the risk model.
A: Nomogram for predicting 1-year, 3-year, and 5-yaer overall survival of hepatocellular carcinoma patients; B: Cox regression of the prognostic genes; C: Receiver operating characteristic curve of the risk factor. aP < 0.05; bP < 0.01; cP < 0.001.
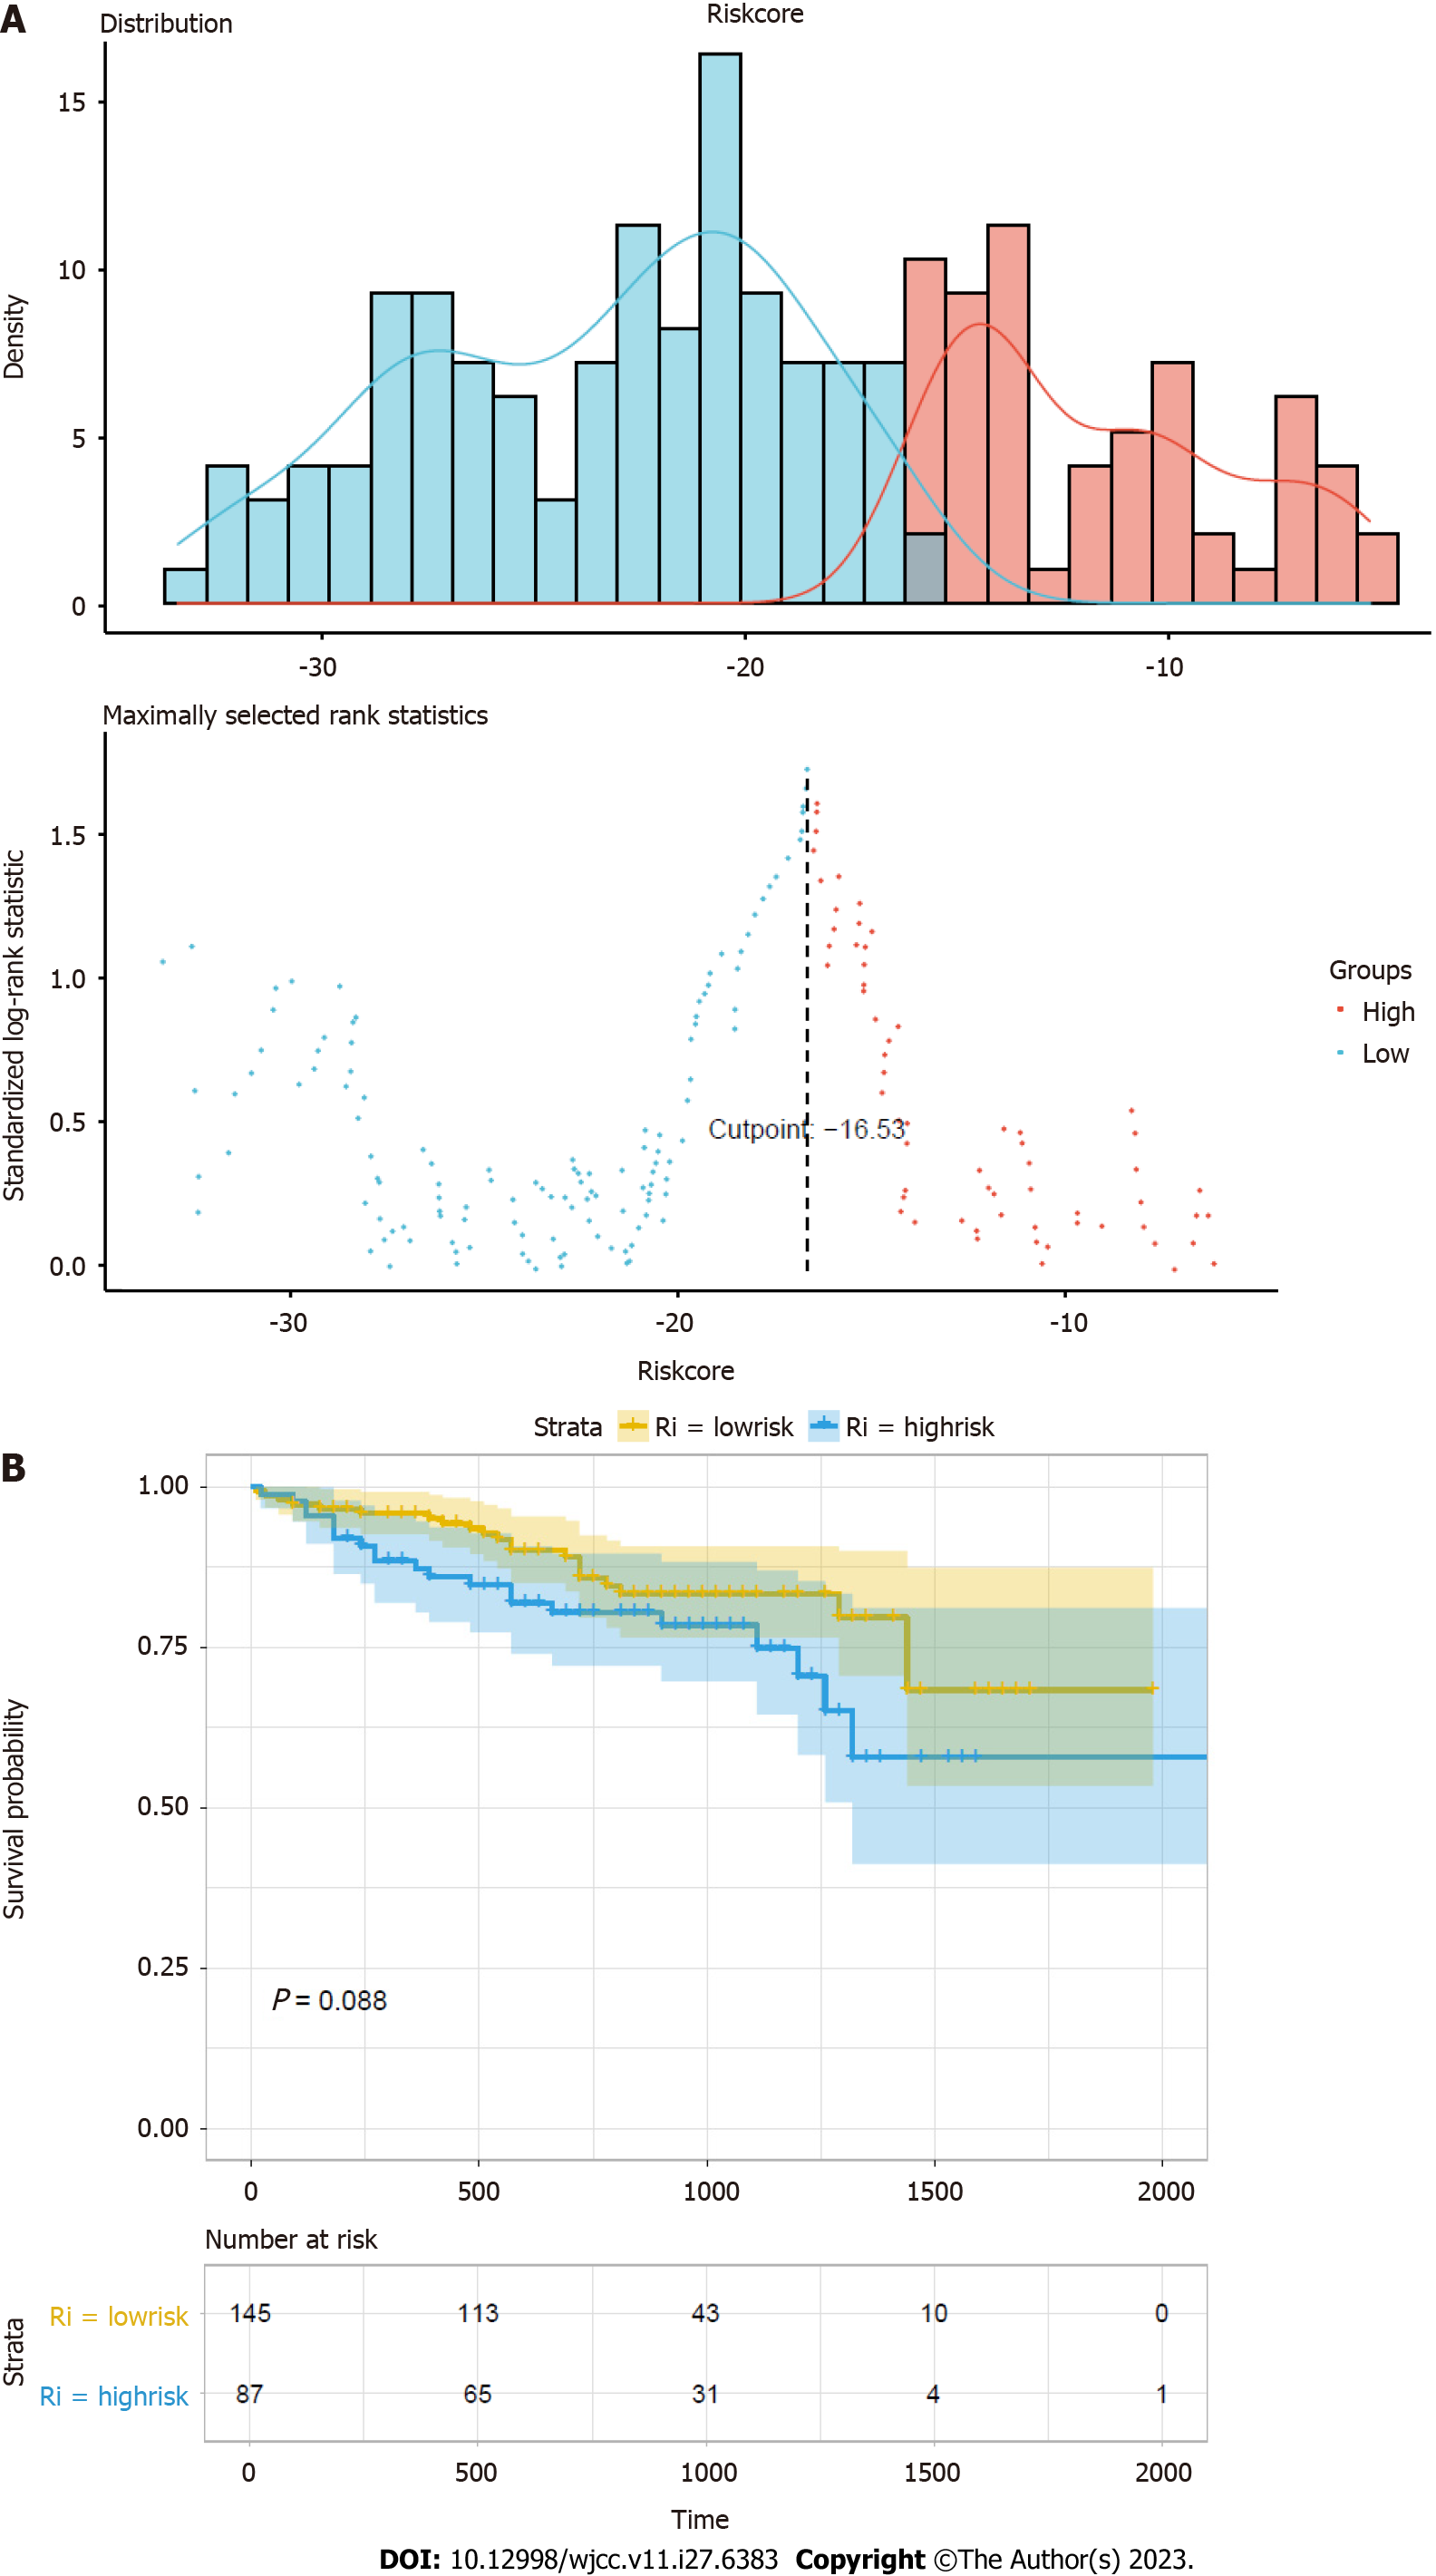
Figure 6 Validation of the prognostic model.
A: Distribution of risk score in validation set; B: Survival curves of high-risk group and low-risk group.
- Citation: Zhang GX, Ding XS, Wang YL. Prognostic model of hepatocellular carcinoma based on cancer grade. World J Clin Cases 2023; 11(27): 6383-6397
- URL: https://www.wjgnet.com/2307-8960/full/v11/i27/6383.htm
- DOI: https://dx.doi.org/10.12998/wjcc.v11.i27.6383


