Copyright
©The Author(s) 2023.
World J Clin Cases. Sep 16, 2023; 11(26): 6231-6239
Published online Sep 16, 2023. doi: 10.12998/wjcc.v11.i26.6231
Published online Sep 16, 2023. doi: 10.12998/wjcc.v11.i26.6231
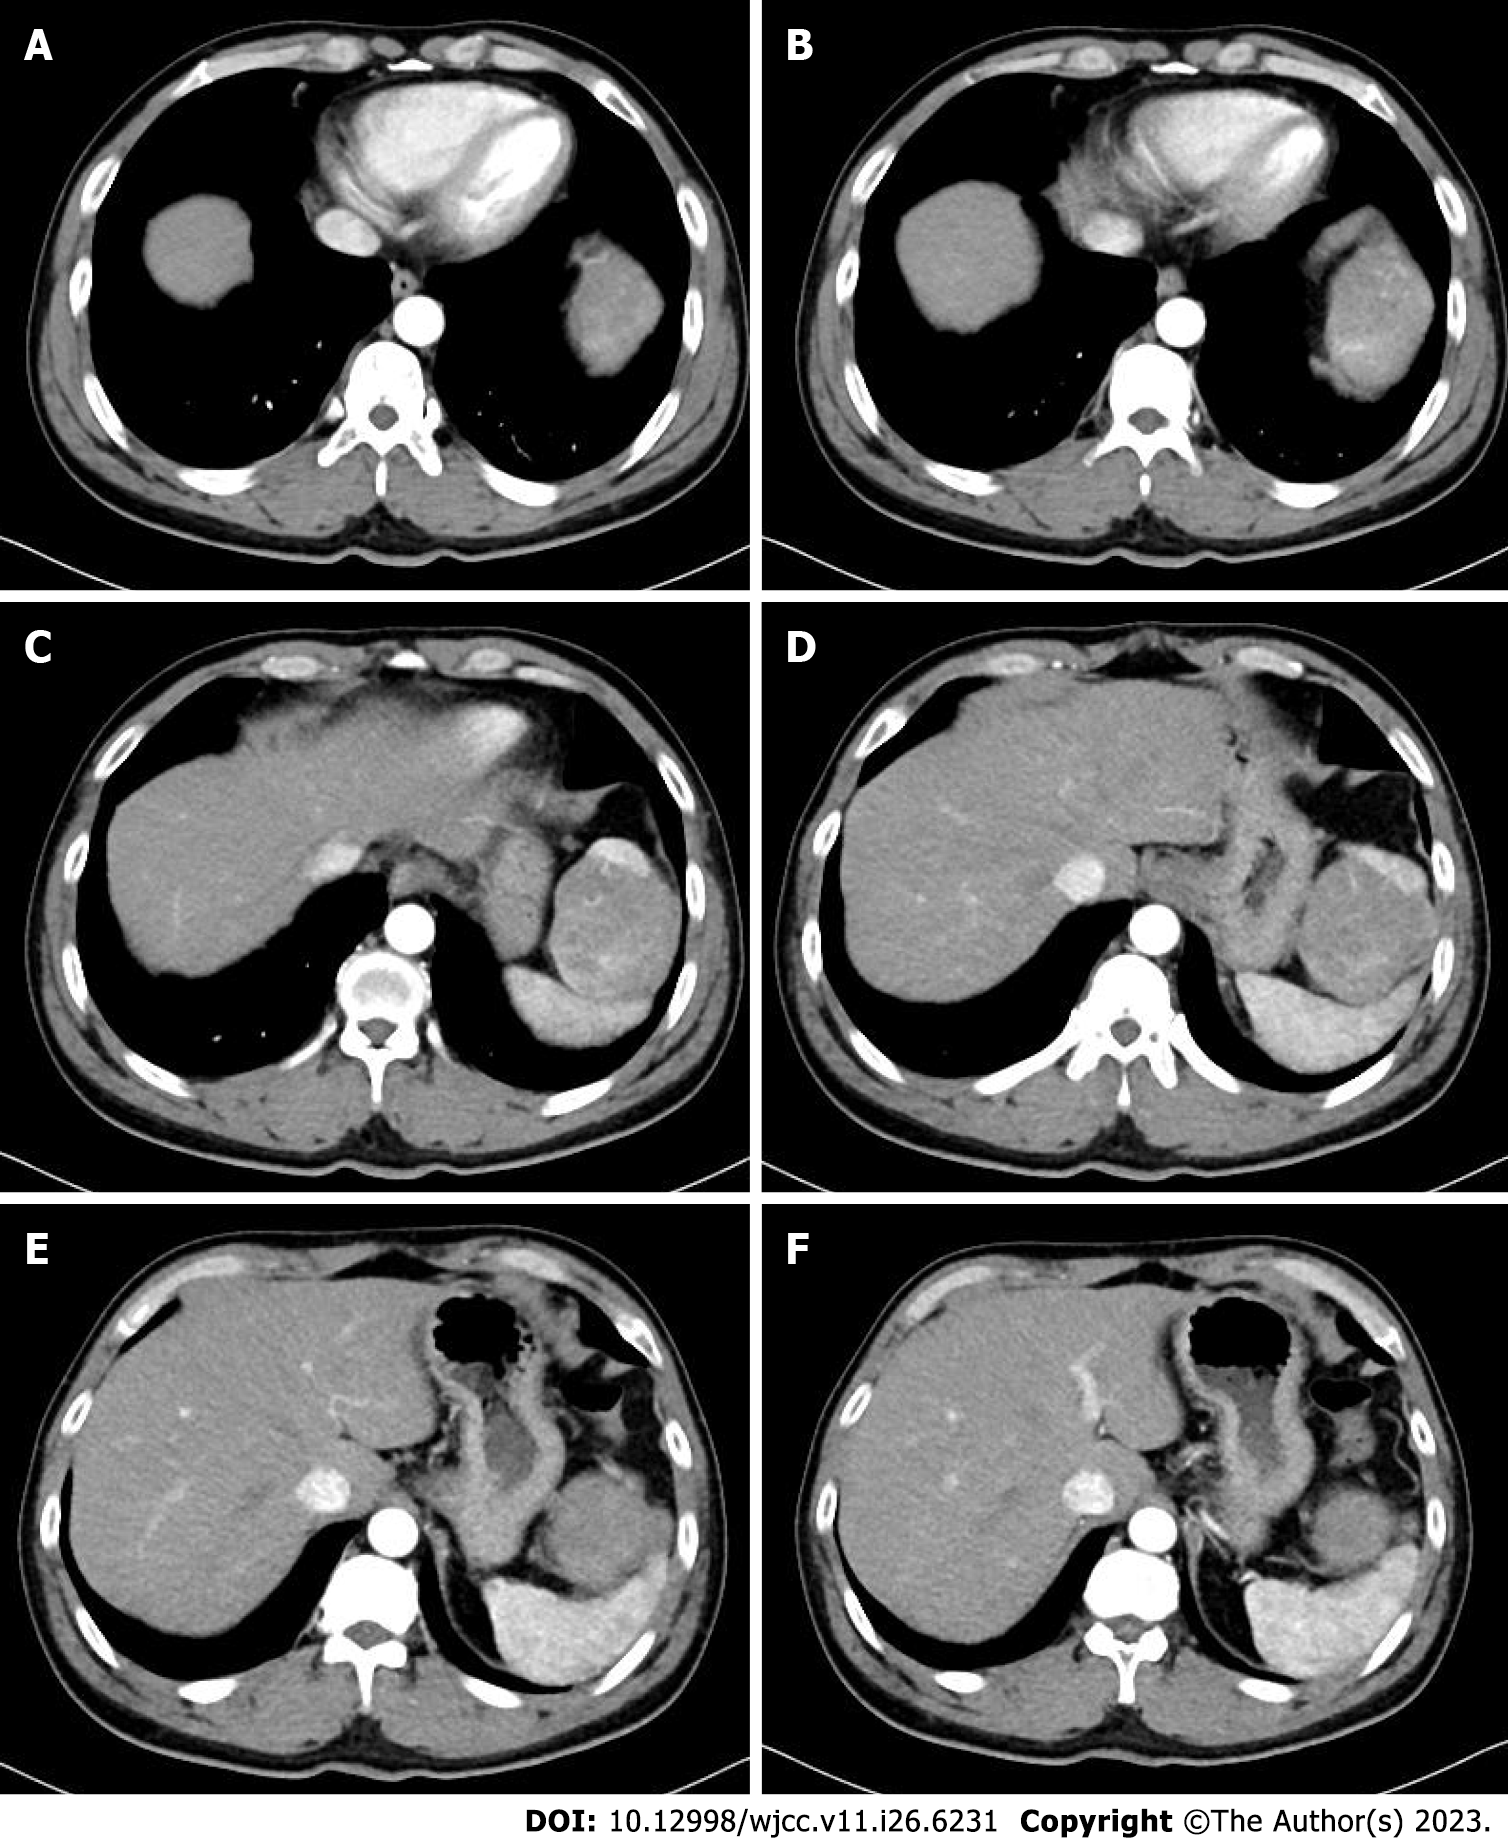
Figure 1 Abdominal enhanced computed tomography showing a tumor with heterogeneous enhancement.
A: Diaphragmatic parietal level; B: Bottom heart level; C: Upper pole level of spleen; D: Esophageal hiatus level; E: Spleen hilar level; F: Lower pole level of tumor (Arterial phase).
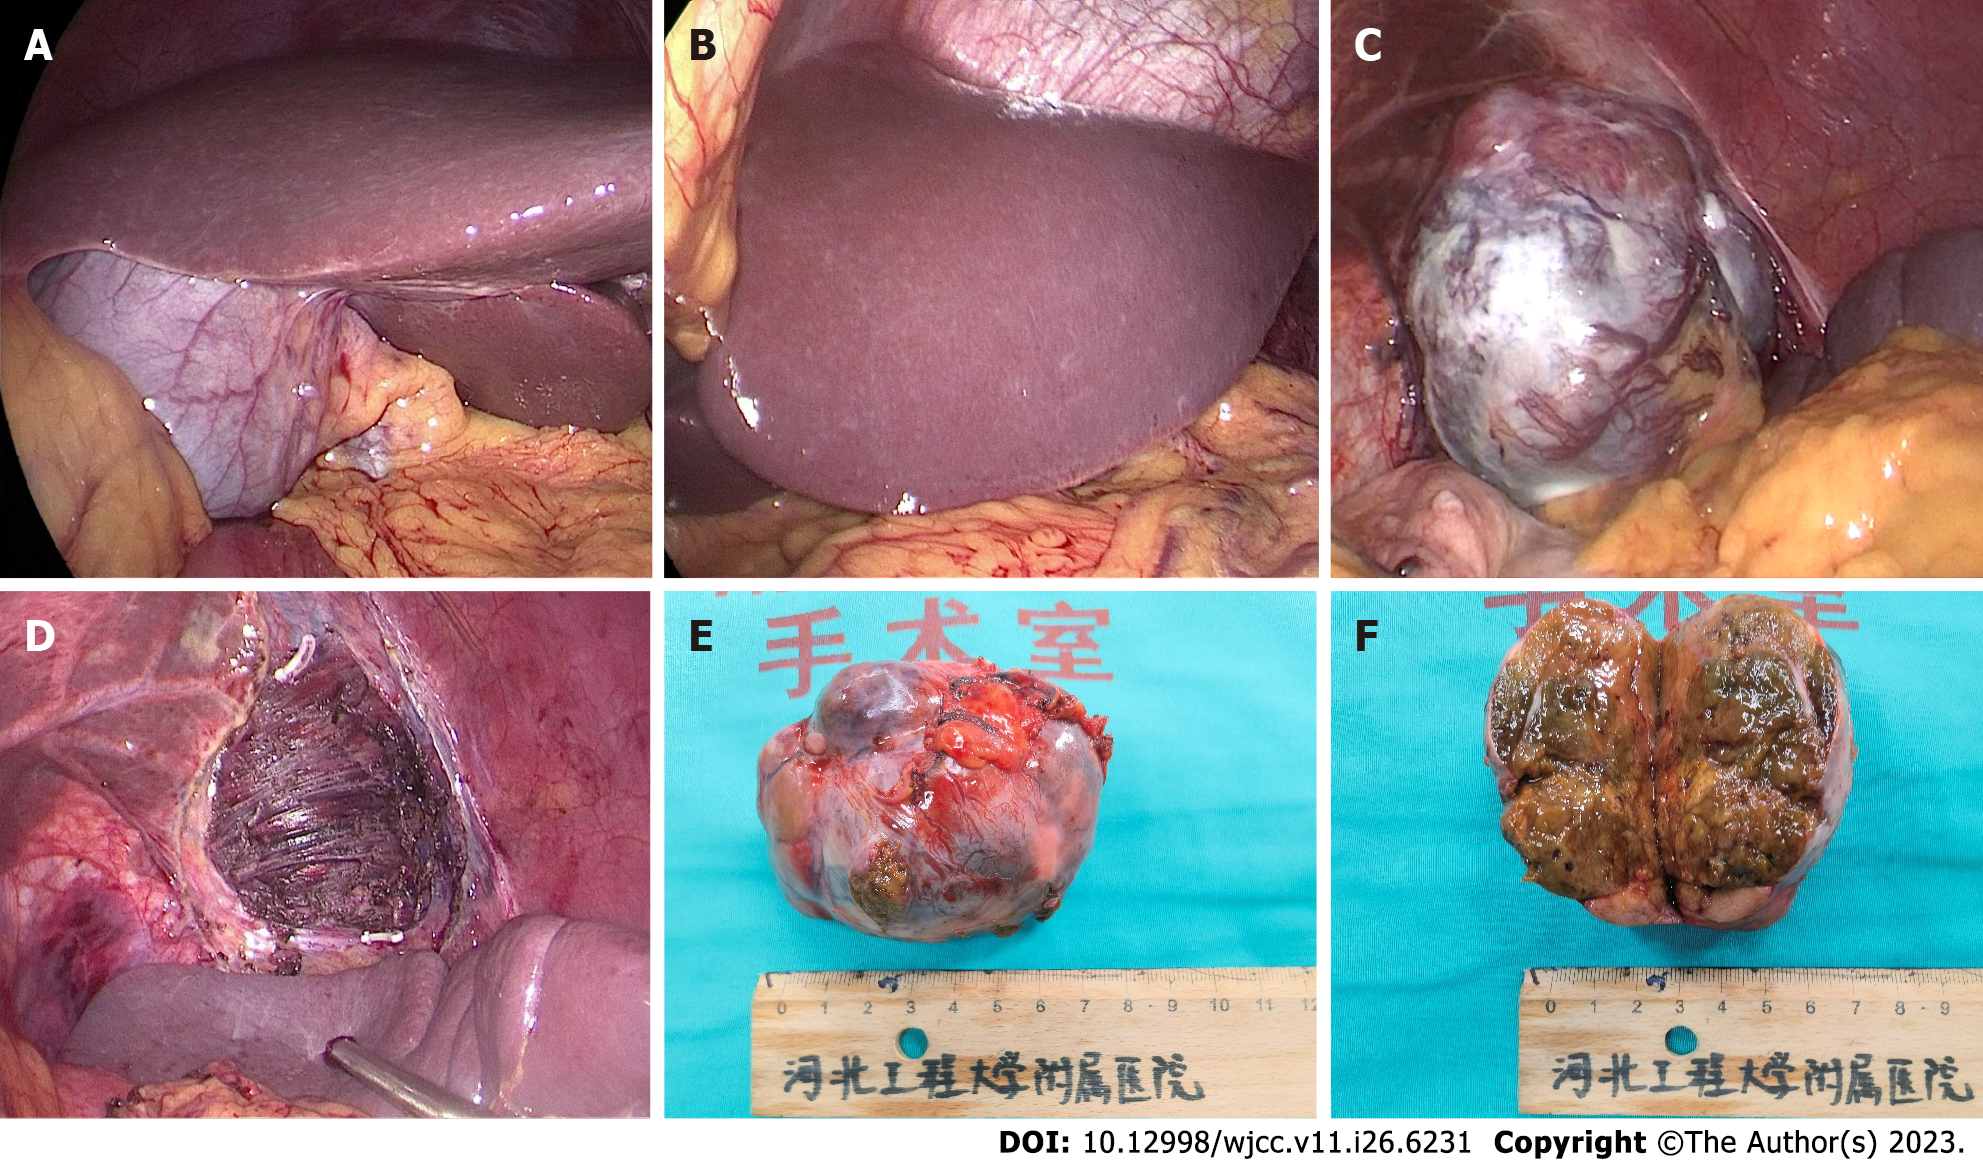
Figure 2 Operative findings and gross view of the surgical specimen.
A: The right liver lobe; B: The left liver lobe; C: The tumor with capsule formation and diaphragm invasion; D: Diaphragmatic wound after tumor resection; E: Macroscopic images of the tumor; F: Cross-sectional images of the tumor.
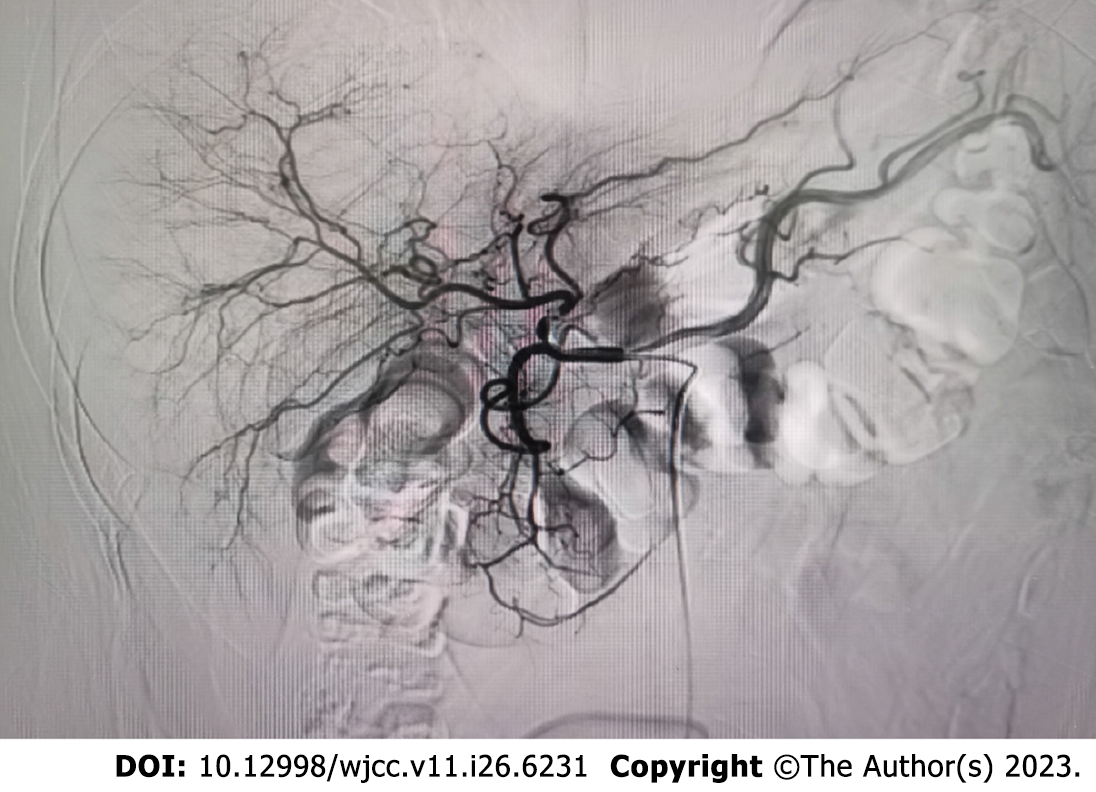
Figure 3
Hepatic arteriography showing no microscopic tumors in the liver.
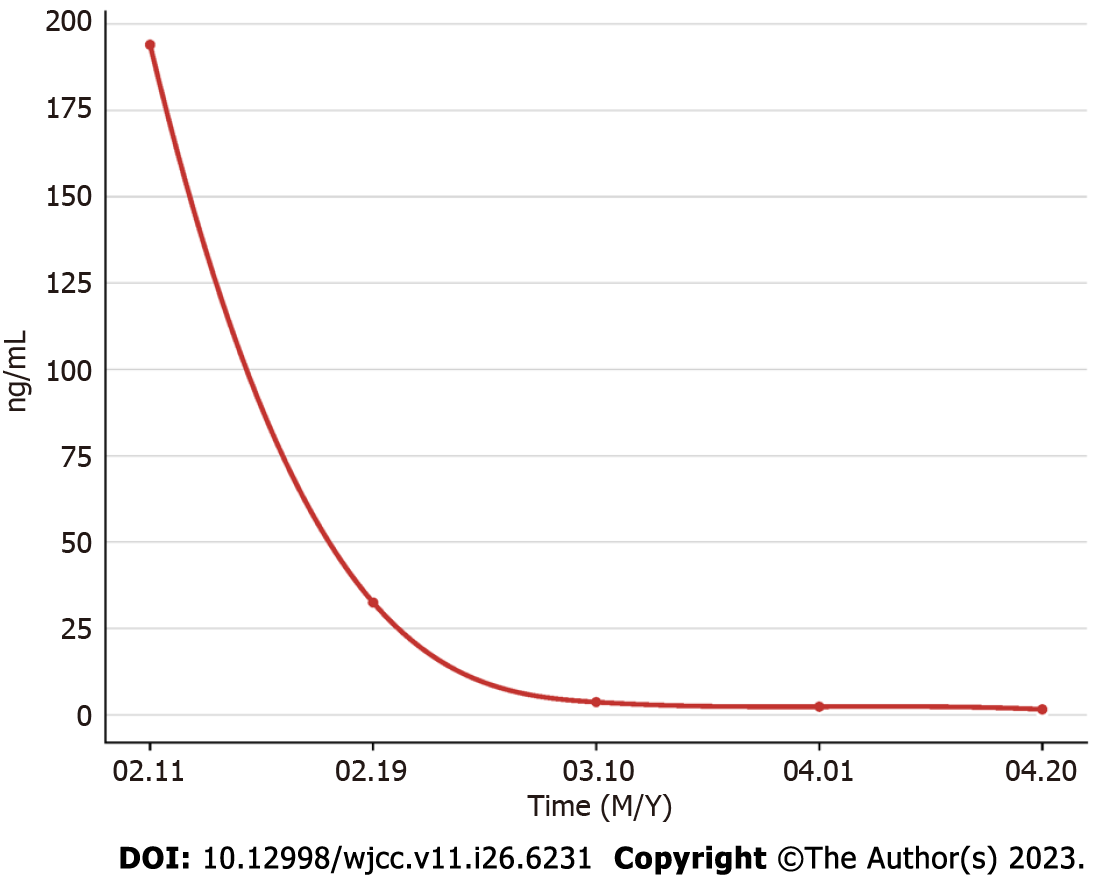
Figure 4
The patient’s α-fetoprotein levels over time.
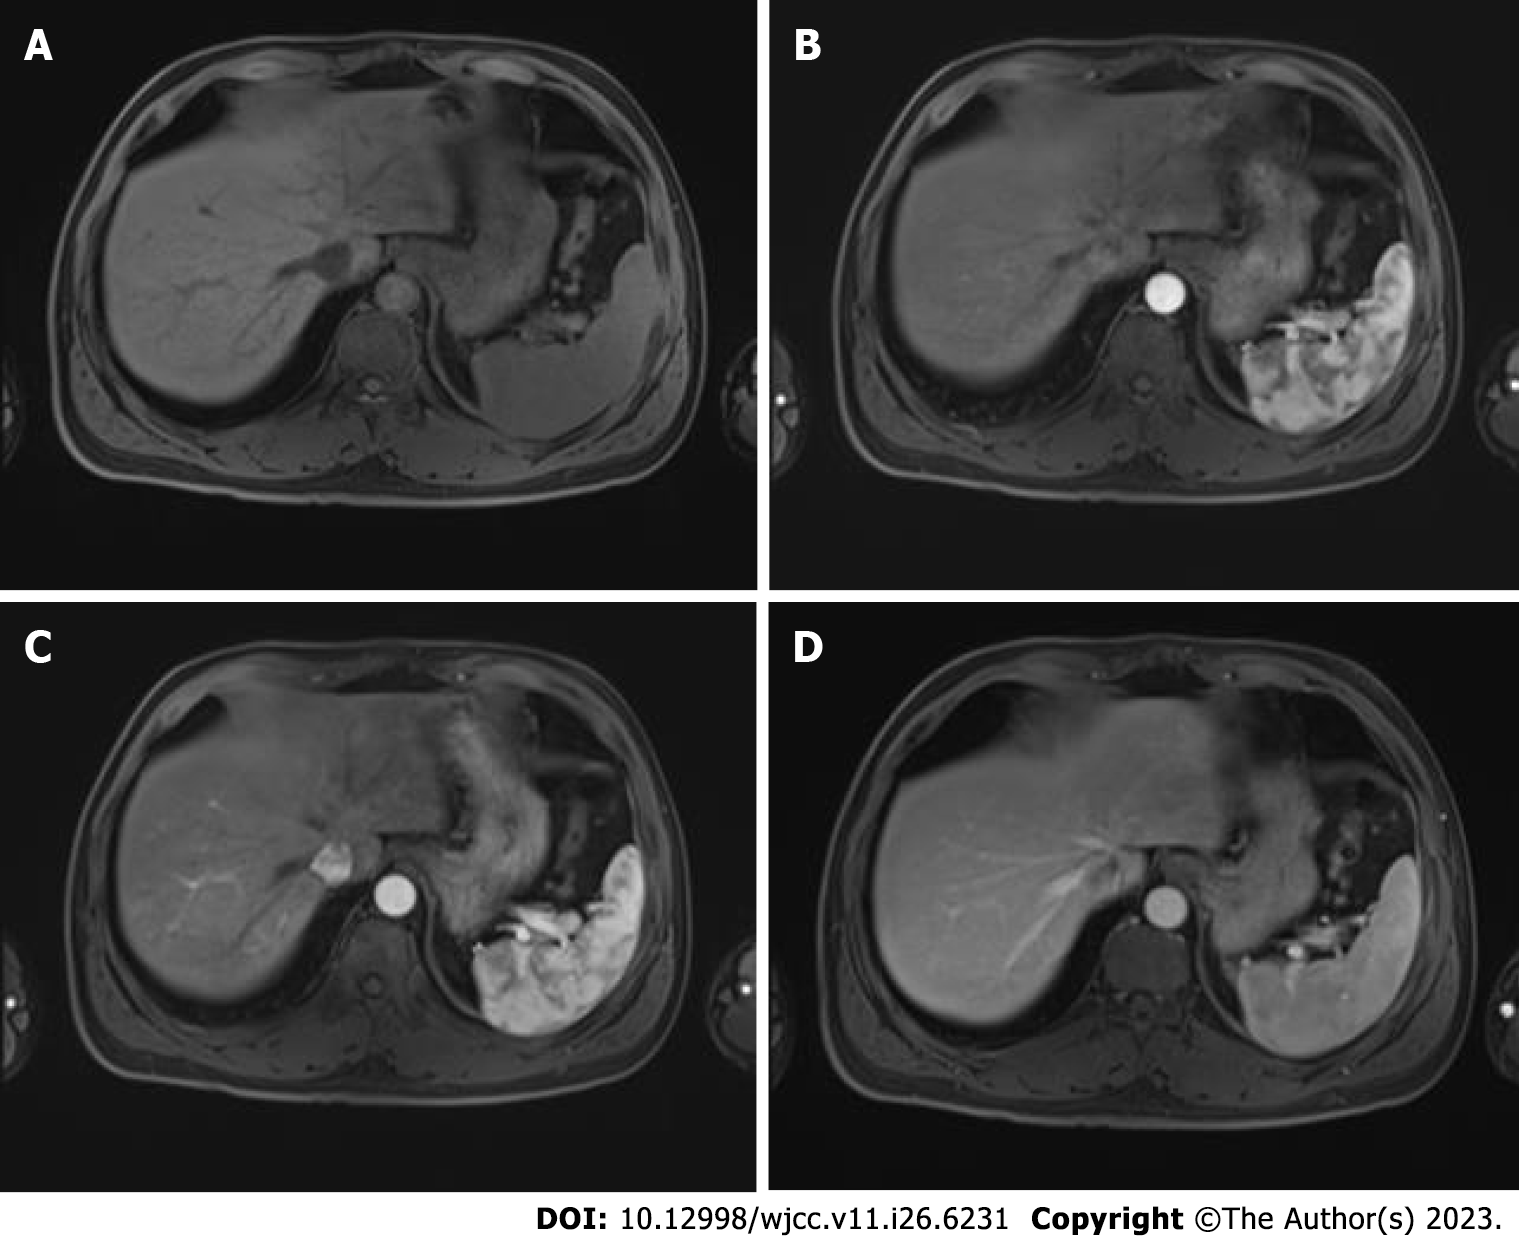
Figure 5 Postoperative enhanced magnetic resonance imaging of the upper abdomen.
A: Plain phase; B: Arterial phase; C: Portal phase; D: Extended phase.
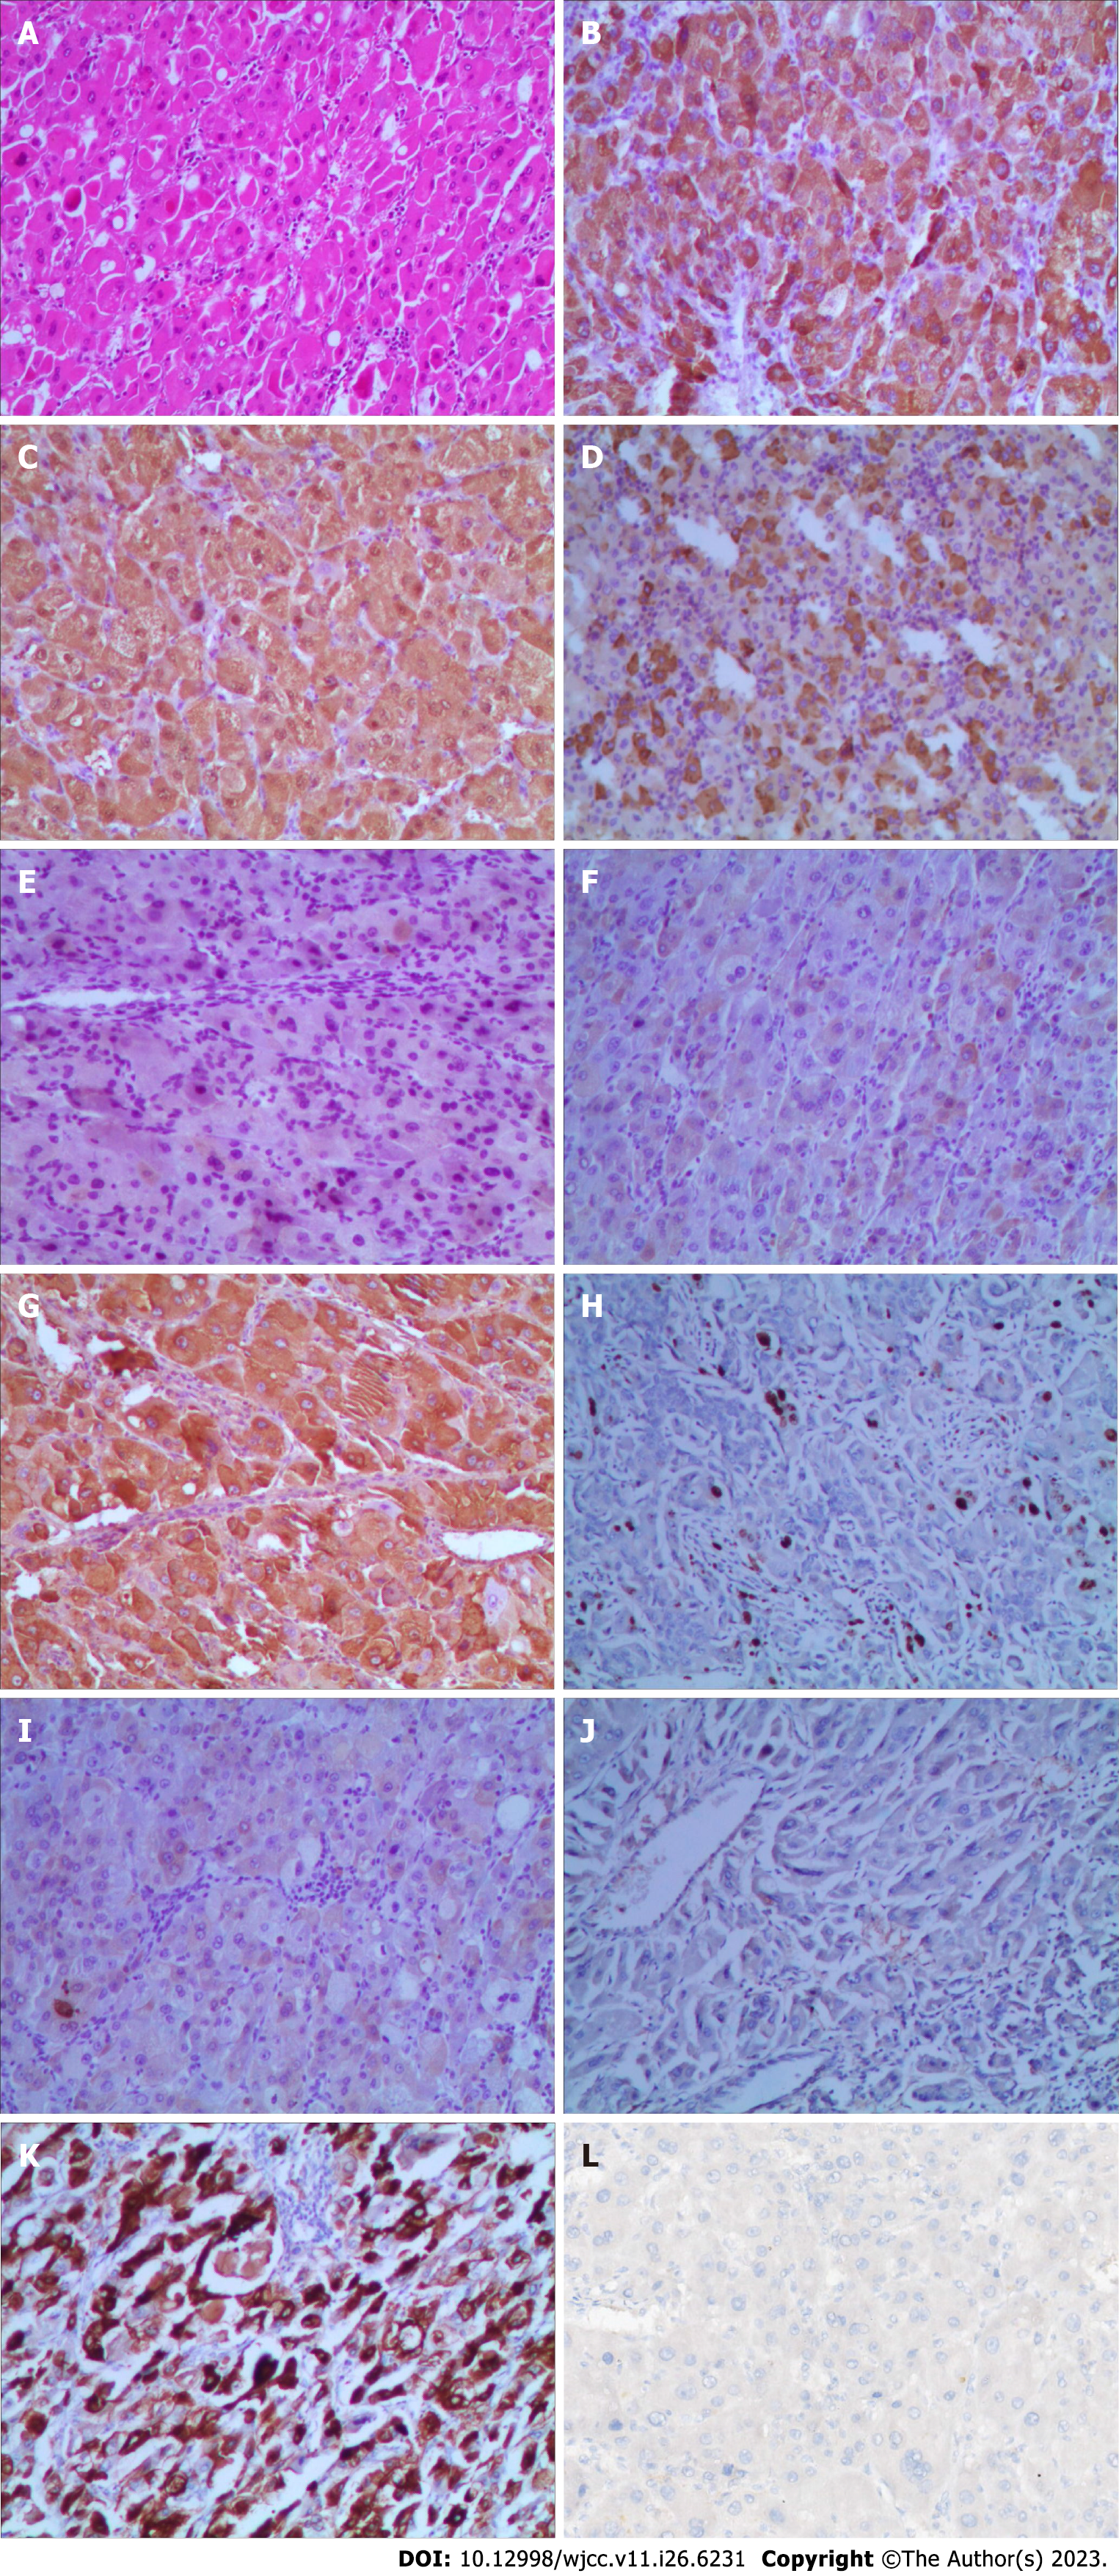
Figure 6 Microscopic findings of the tumor.
A: Hematoxylin and eosin (HE)-stained slide (HE, × 40); B: Hepatocyte antigen (+); C: Arginase-1 (+); D: α-fetoprotein (+); E: Inhibin-α (-); F: Cytokeratin (CK) (-); G: Glypican-3 (+); H: Ki-67 (hot regions: 5%) (+); I: CK19 (-); J: CK8/18 (-); K: Hepatocyte paraffin-1 (+); L: Programmed death-ligand 1 (-).
- Citation: Liu HB, Zhao LH, Zhang YJ, Li ZF, Li L, Huang QP. Left epigastric isolated tumor fed by the inferior phrenic artery diagnosed as ectopic hepatocellular carcinoma: A case report. World J Clin Cases 2023; 11(26): 6231-6239
- URL: https://www.wjgnet.com/2307-8960/full/v11/i26/6231.htm
- DOI: https://dx.doi.org/10.12998/wjcc.v11.i26.6231


