Copyright
©The Author(s) 2023.
World J Clin Cases. Sep 16, 2023; 11(26): 6165-6169
Published online Sep 16, 2023. doi: 10.12998/wjcc.v11.i26.6165
Published online Sep 16, 2023. doi: 10.12998/wjcc.v11.i26.6165
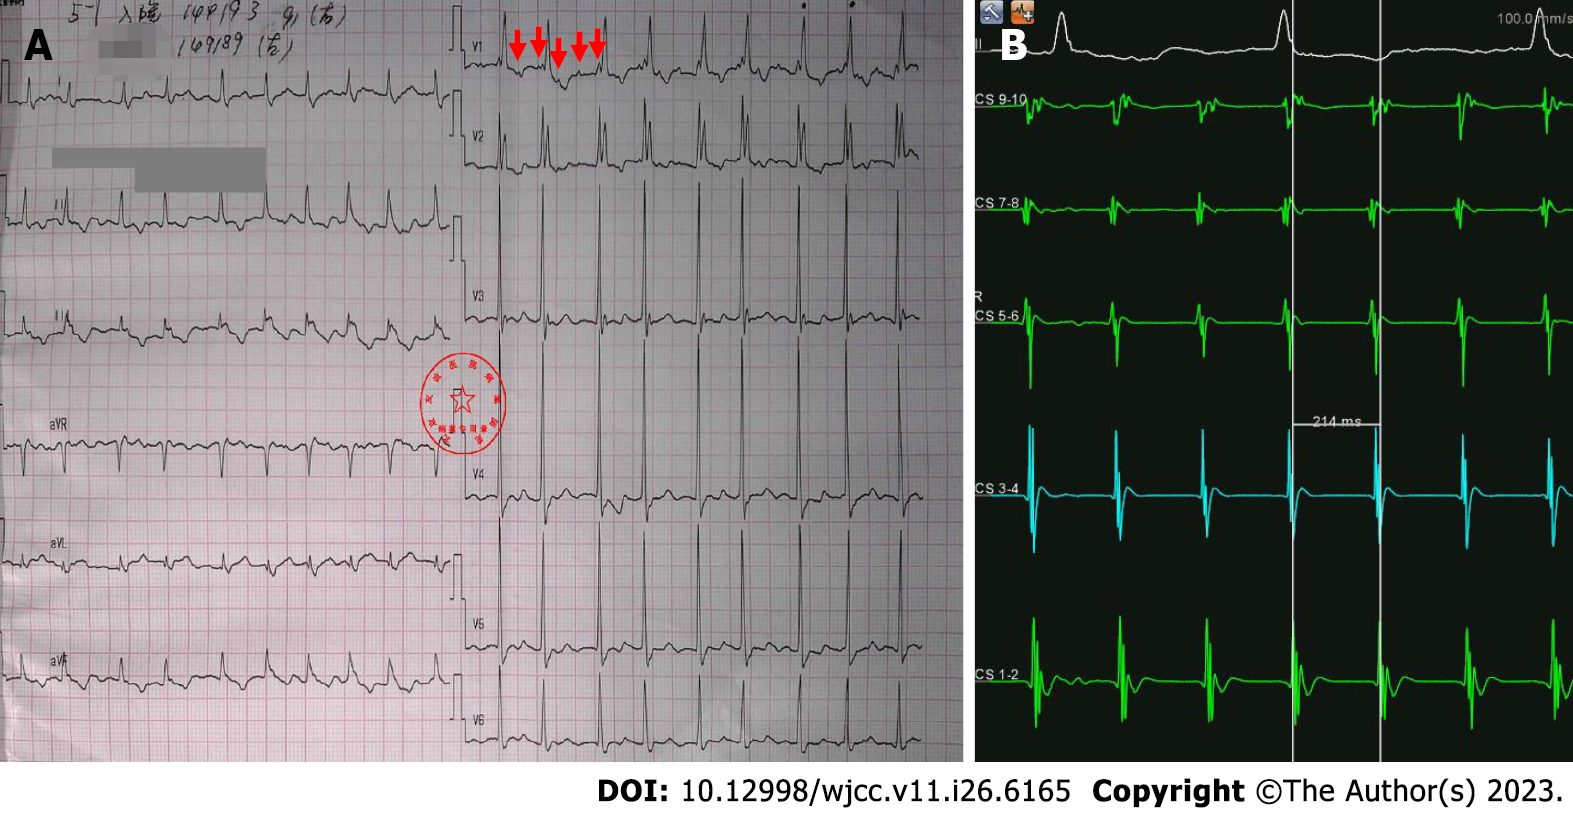
Figure 1 Twelve lead electrocardiogram and intracardiac electrocardiogram of tachycardia.
A: Twelve lead electrocardiogram, red arrows indicate “P waves”; B: Intracardiac electrocardiogram.
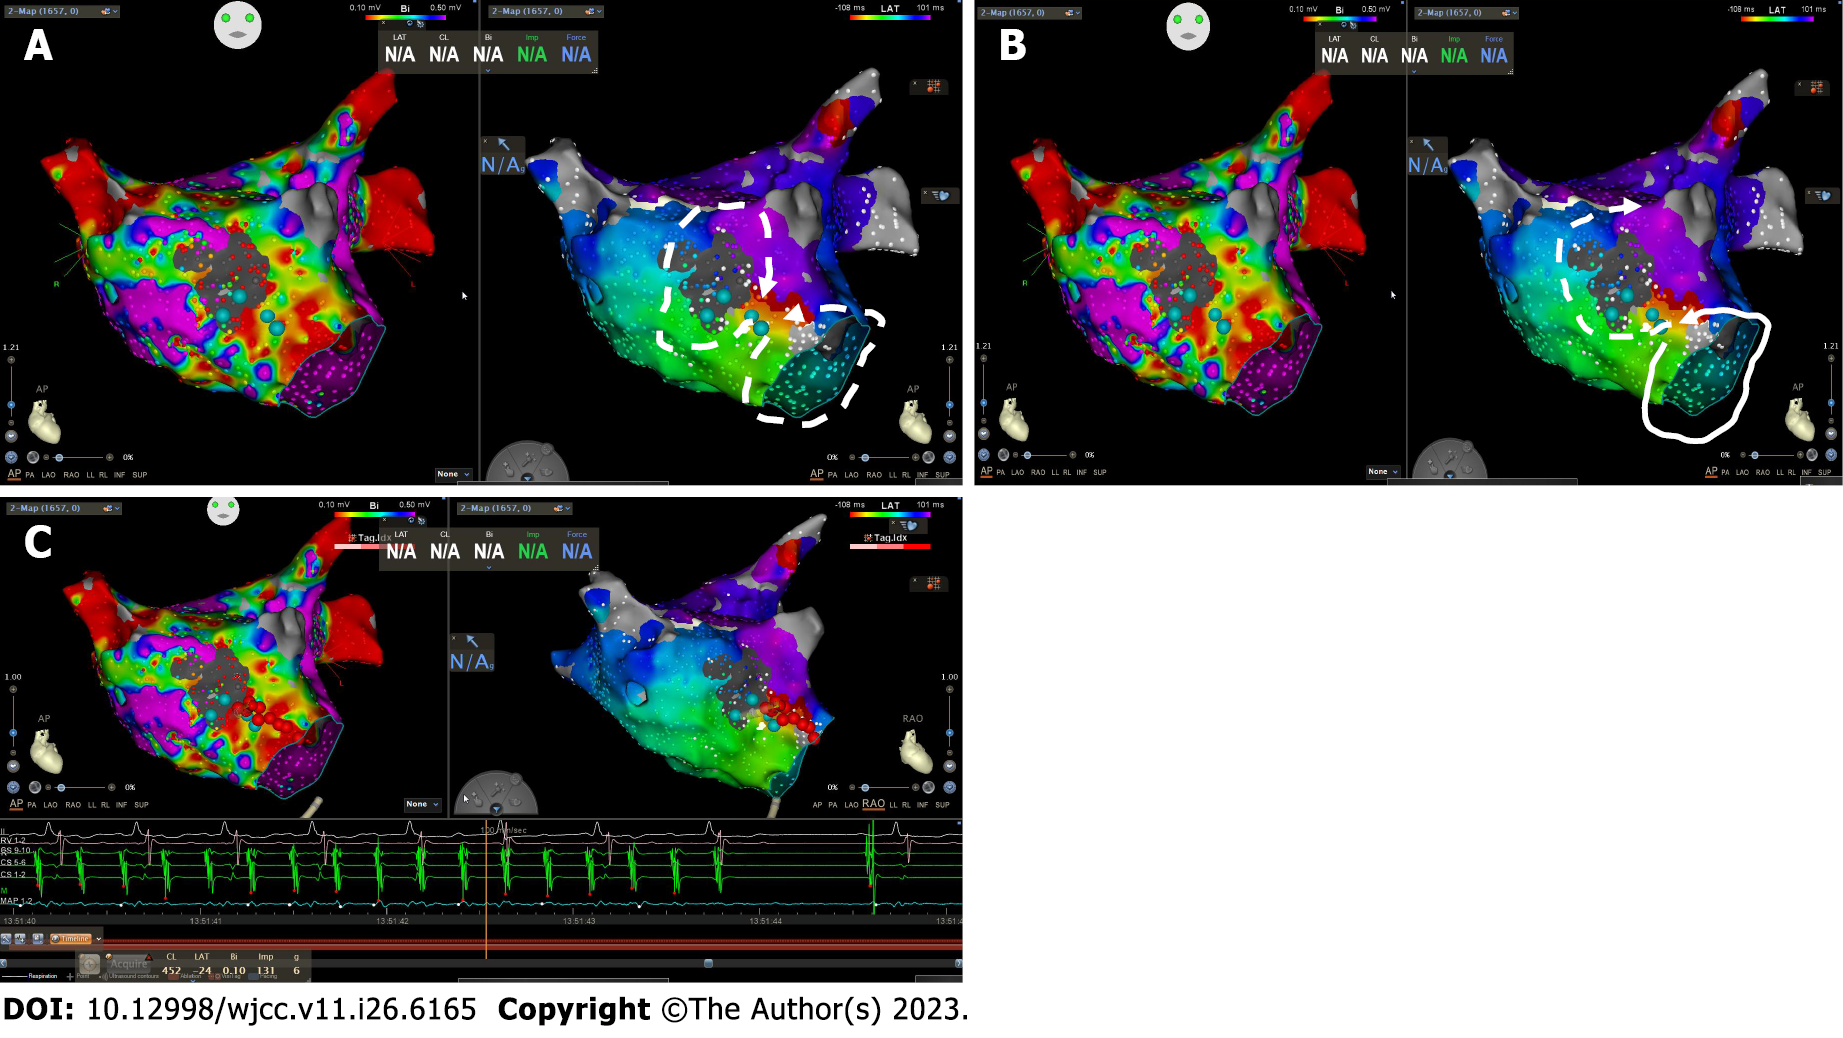
Figure 2 High-density mapping result.
A: The left panel showed voltage mapping result. The voltage scale was from 0.1 mV to 0.5 mV. Red means voltage lower than 0.1 mV; violet means voltage higher than 0.5 mV. Grey zone represents no potential area. The right panel showed activation mapping result. From red to violet represent activation sequence. Solid arrow indicates the dominant loop, and dotted arrow indicates passive loop; B: The atrial flutter terminated while ablation. The ablation line was between anterior central scar and mitral annulus; C: The atrial flutter terminated while ablation was performed.
- Citation: Yu SD, Chu YP. Identification of the dominant loop of a dual-loop macro-reentry left atrial flutter without prior intervention using high-density mapping technology: A case report. World J Clin Cases 2023; 11(26): 6165-6169
- URL: https://www.wjgnet.com/2307-8960/full/v11/i26/6165.htm
- DOI: https://dx.doi.org/10.12998/wjcc.v11.i26.6165


