Copyright
©The Author(s) 2023.
World J Clin Cases. Sep 6, 2023; 11(25): 5887-5896
Published online Sep 6, 2023. doi: 10.12998/wjcc.v11.i25.5887
Published online Sep 6, 2023. doi: 10.12998/wjcc.v11.i25.5887
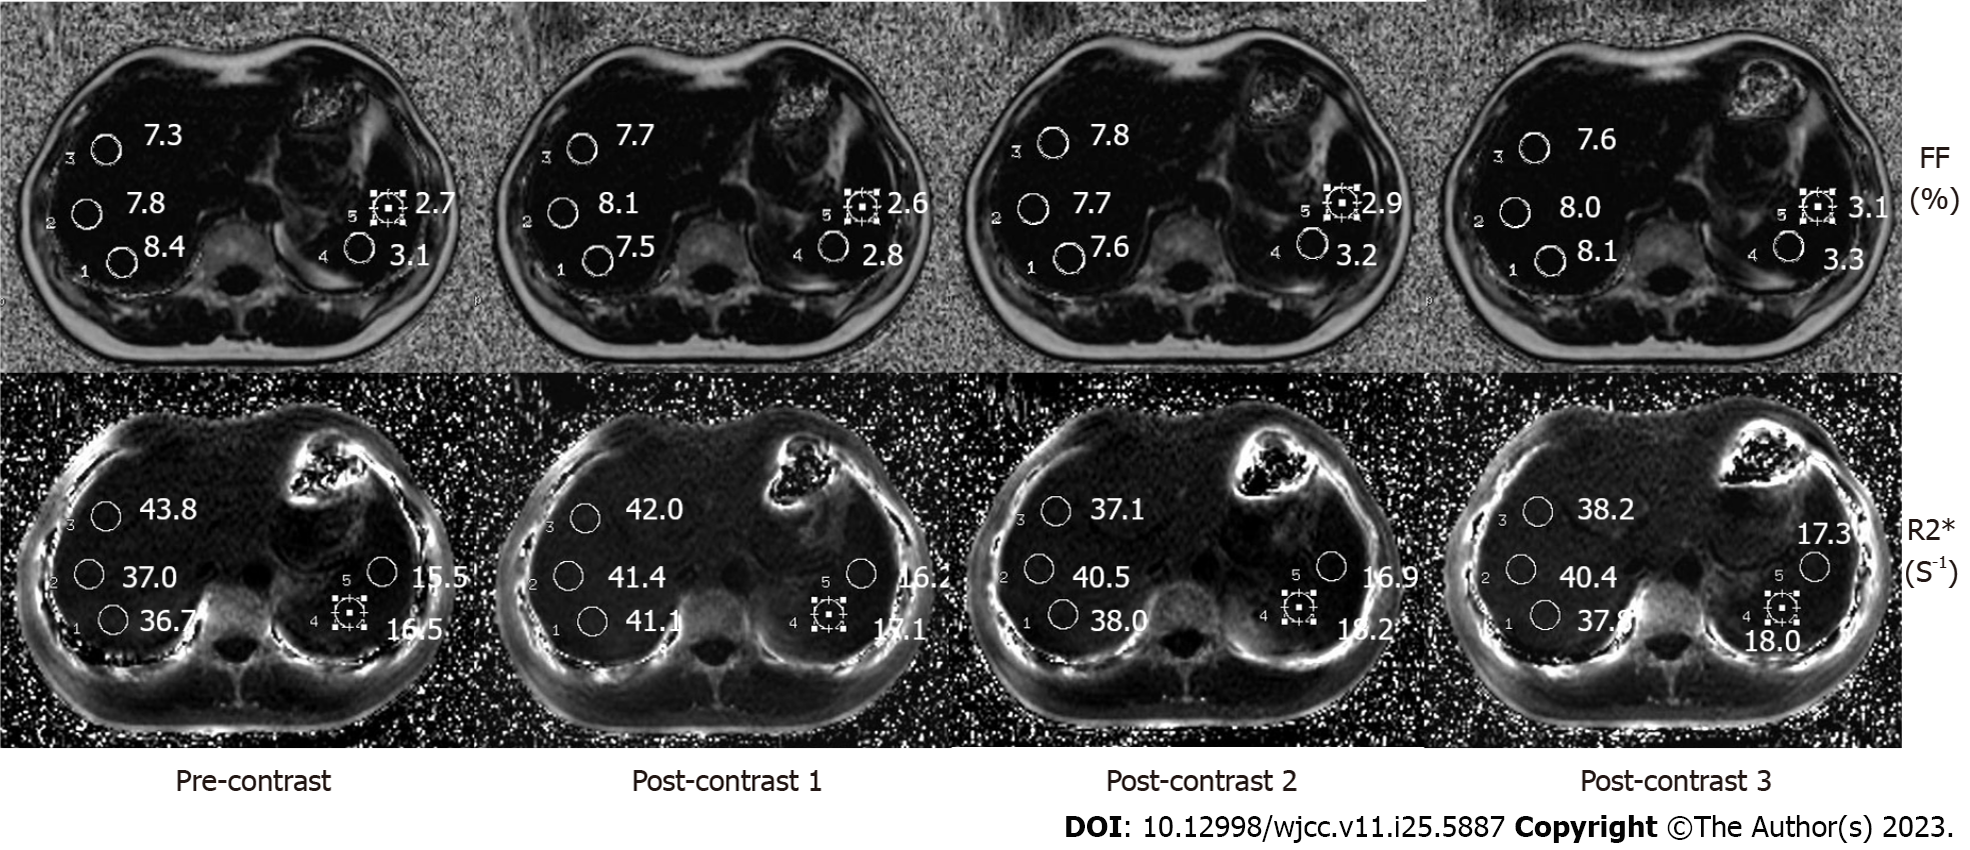
Figure 1 Fat fraction (%, upper row) and R2* (Hz, bottom row) mappings of the right liver lobe and spleen of a 57-year-old male patient with primary hepatocellular carcinoma.
The mean FF and R2* values of the right liver lobe and spleen are shown on the images. FF: Fat fraction.
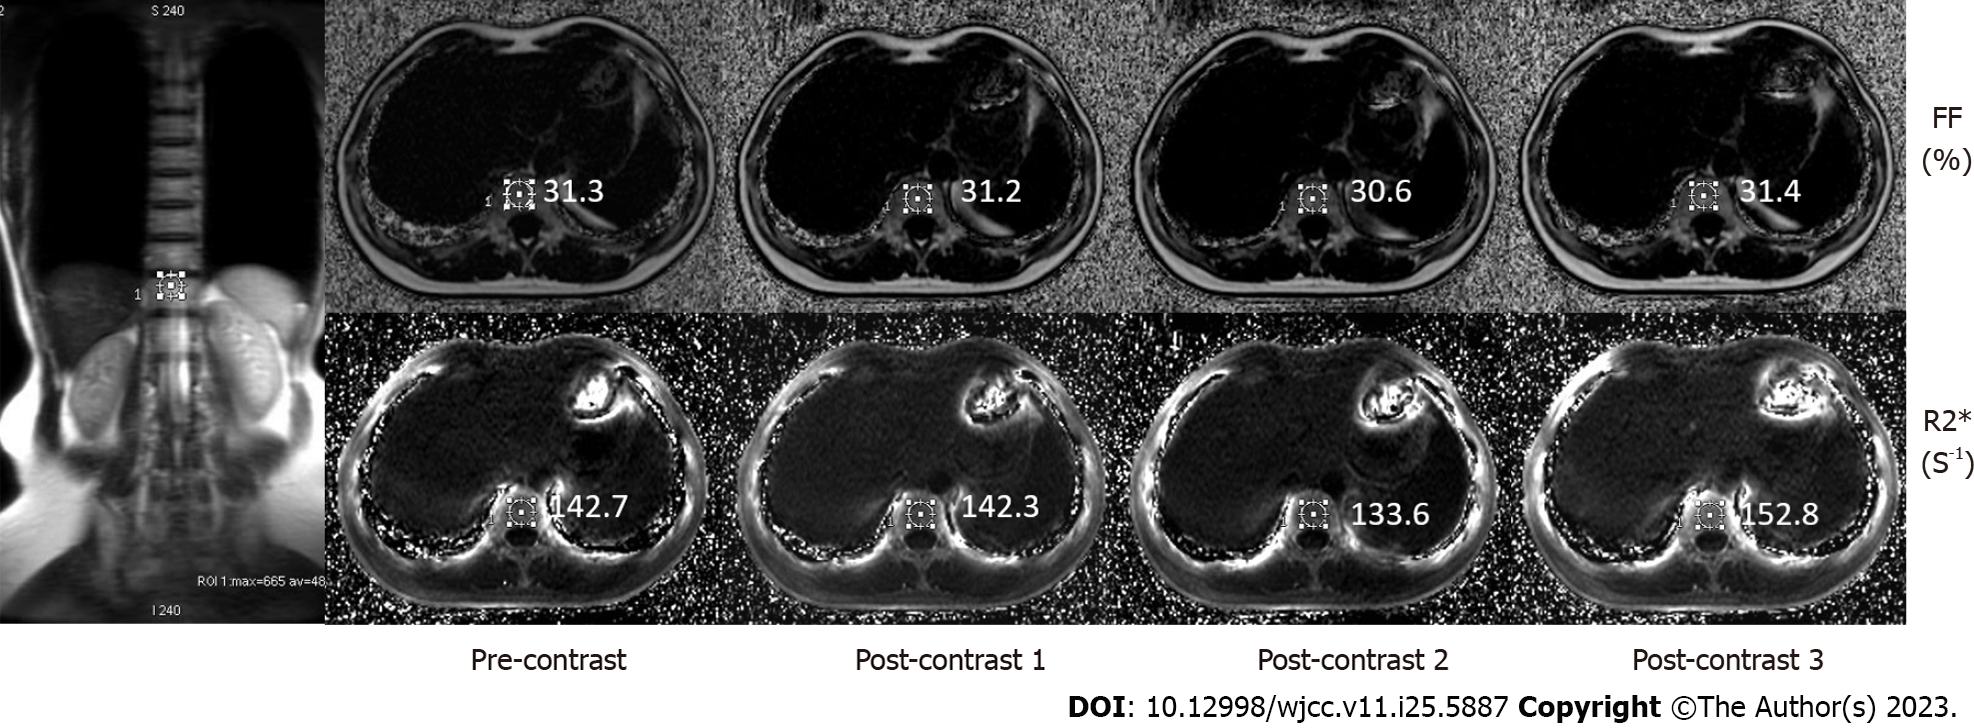
Figure 2 Fat fraction (%, upper row) and R2* (Hz, bottom row) mappings of the spine of a 47-year-old patient with hepatic hemangioma.
The obtained anatomical images were referred to the region of interest in the vertebral body bone marrow to avoid inclusion of the intervertebral disk. FF: Fat fraction.
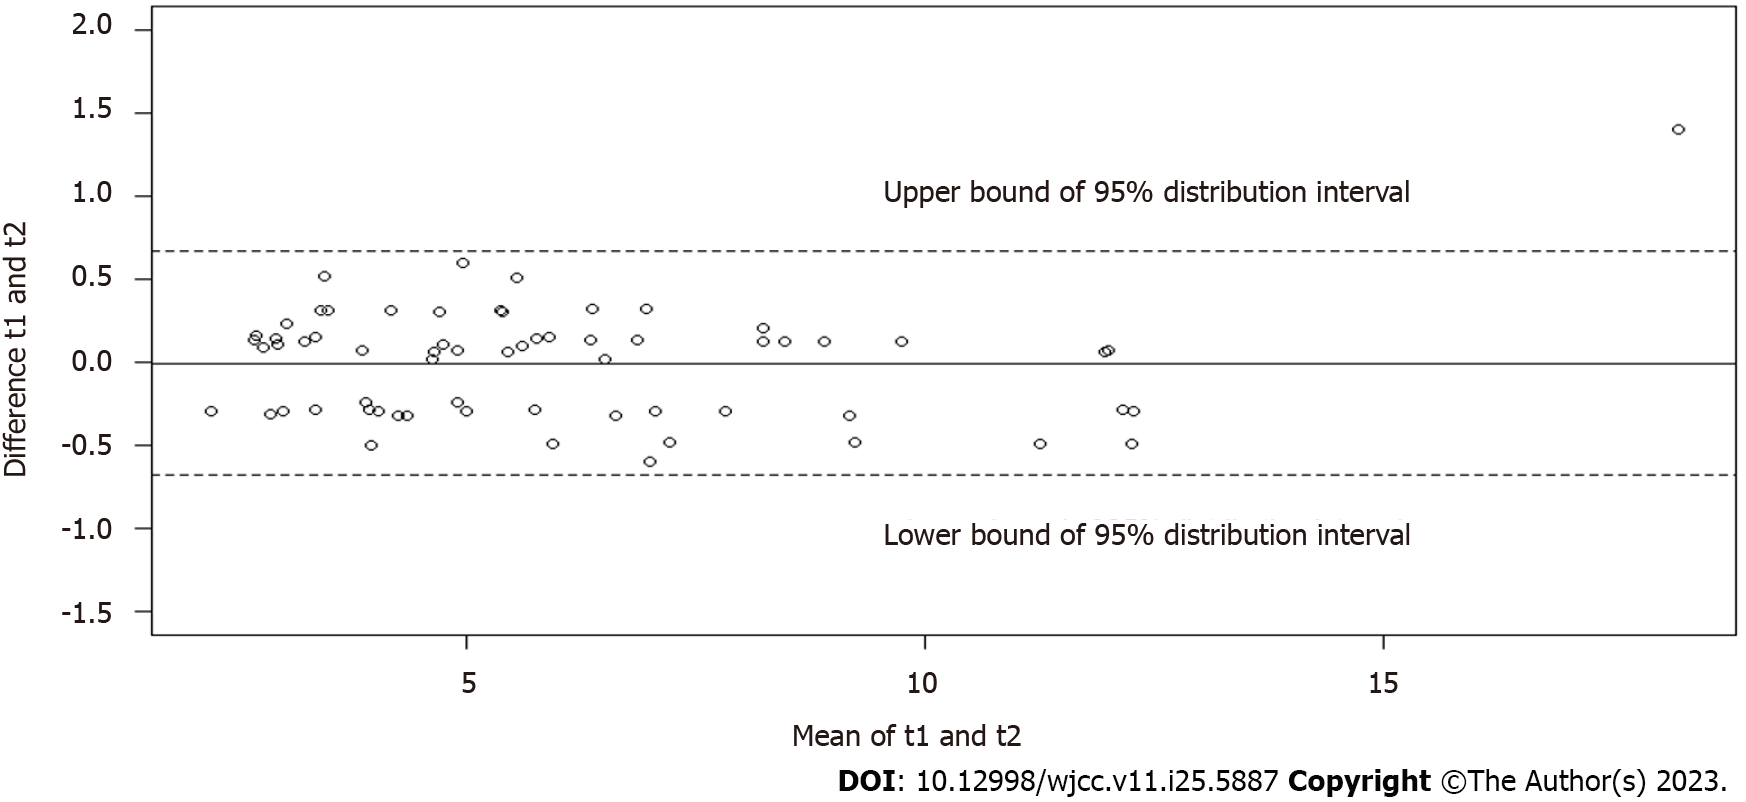
Figure 3 Agreement of fat fraction measurements between T1 (pre-contrast) and T2 (between portal phase and equilibrium phase).
Bland-Altman plots indicating 95% of confidence interval in the hepatic fat fraction measurements (-0.6768, 0.6658).
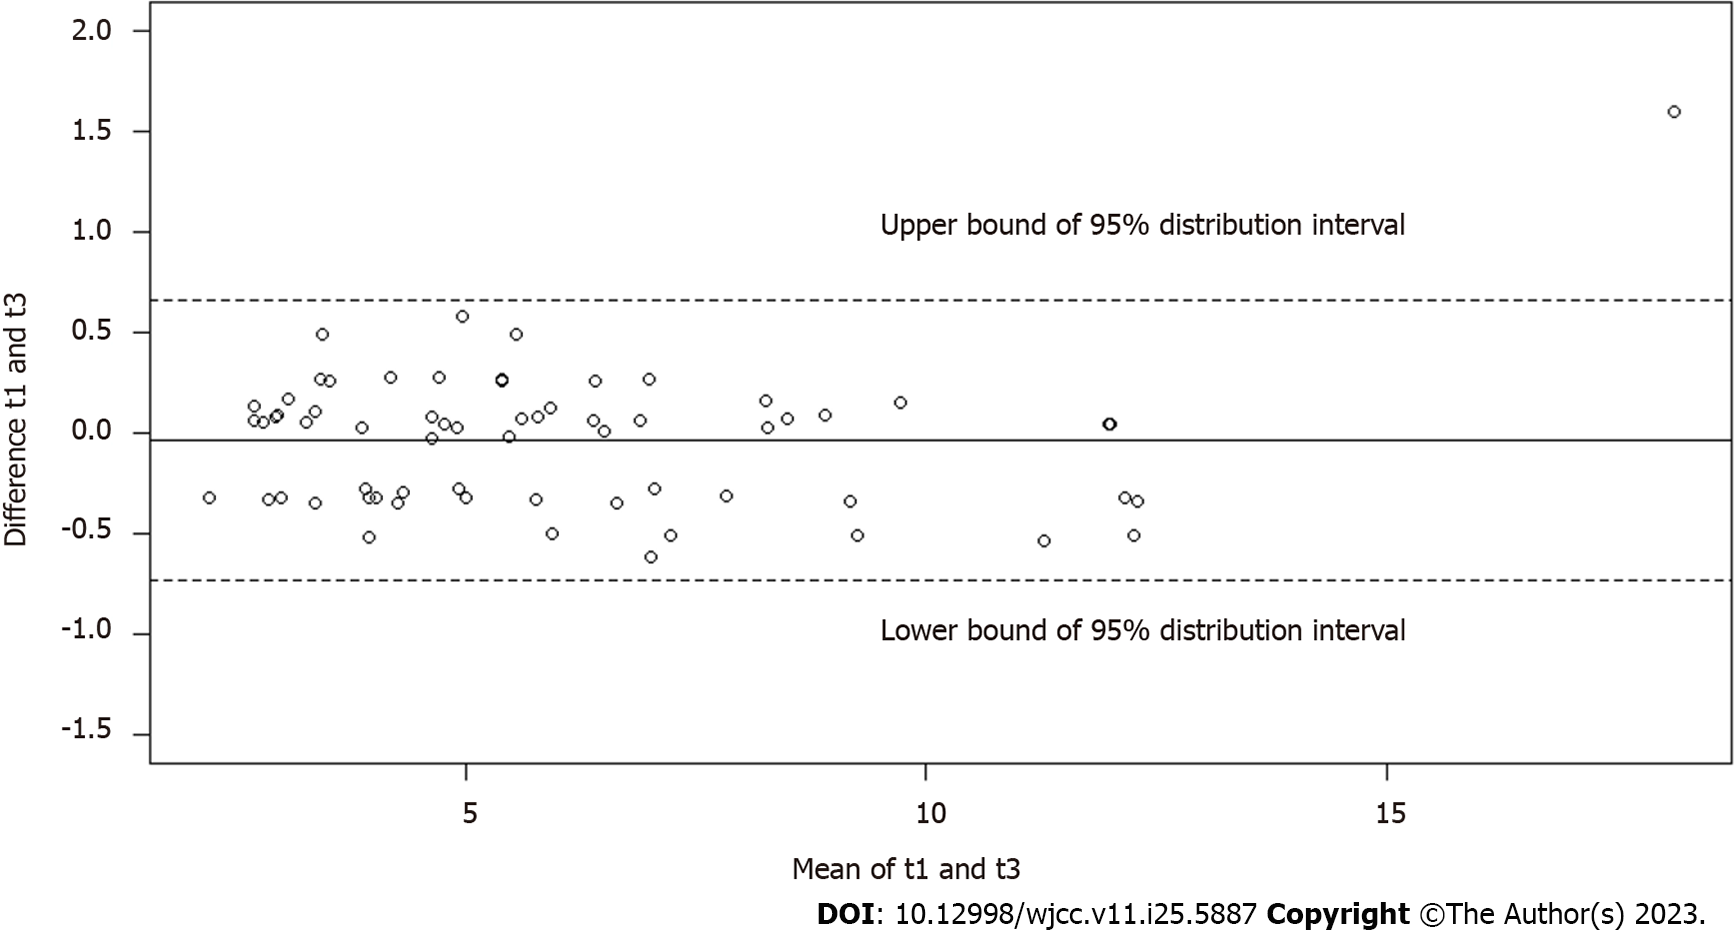
Figure 4 Agreement of fat fraction measurements between T1 (pre-contrast) and T3 (delayed phase).
Bland-Altman plots indicating 95% of confidence interval in the haptic fat fraction measurements (-0.3900, 0.3178).
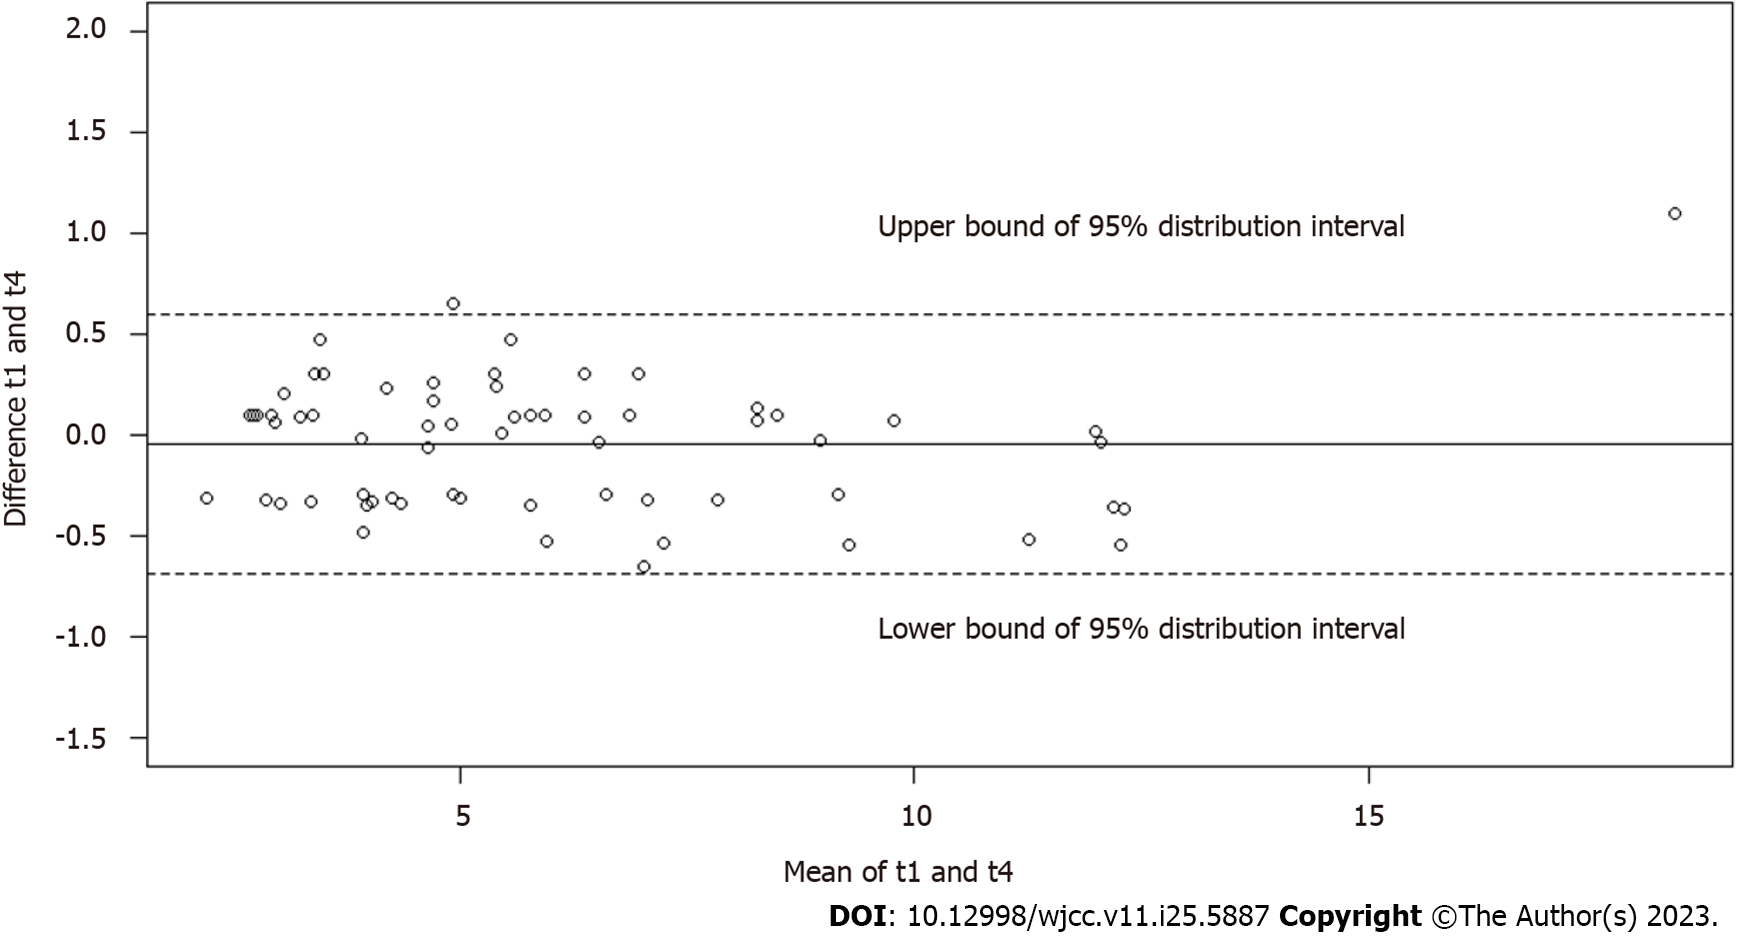
Figure 5 Agreement of fat fraction measurements between T1 (pre-contrast) and T4 (hepatobiliary phase).
Bland-Altman plots indicating 95% of confidence interval in the hepatic fat fraction measurements (-0.3750, 0.2825).
- Citation: Tian Y, Liu PF, Li JY, Li YN, Sun P. Hepatic MR imaging using IDEAL-IQ sequence: Will Gd-EOB-DTPA interfere with reproductivity of fat fraction quantification? World J Clin Cases 2023; 11(25): 5887-5896
- URL: https://www.wjgnet.com/2307-8960/full/v11/i25/5887.htm
- DOI: https://dx.doi.org/10.12998/wjcc.v11.i25.5887


