Copyright
©The Author(s) 2023.
World J Clin Cases. Aug 16, 2023; 11(23): 5530-5537
Published online Aug 16, 2023. doi: 10.12998/wjcc.v11.i23.5530
Published online Aug 16, 2023. doi: 10.12998/wjcc.v11.i23.5530
Figure 1 Preoperative diagnostics contrast enhanced computed tomography and axial positron emission tomography.
A: Coronal contrast enhanced computed tomography; B: Axial contrast enhanced computed tomography shows an exophytic mass of the jejunum (measuring 7 cm × 4 cm), heterogenous contrast enhancement and irregular margins, with partial necrosis; C: Contrast enhanced computed tomography and axial positron emission tomography.
Figure 2 Intraoperative exploration and detection of the arteriovenous malformation and complete resection of the tumour and the supplying mesenteric arcade.
A: Impression of the tumour after exploration; B: Diaphanoscopy of the tumour and the supplying arteries and veins; C: Tumourmass after resection.
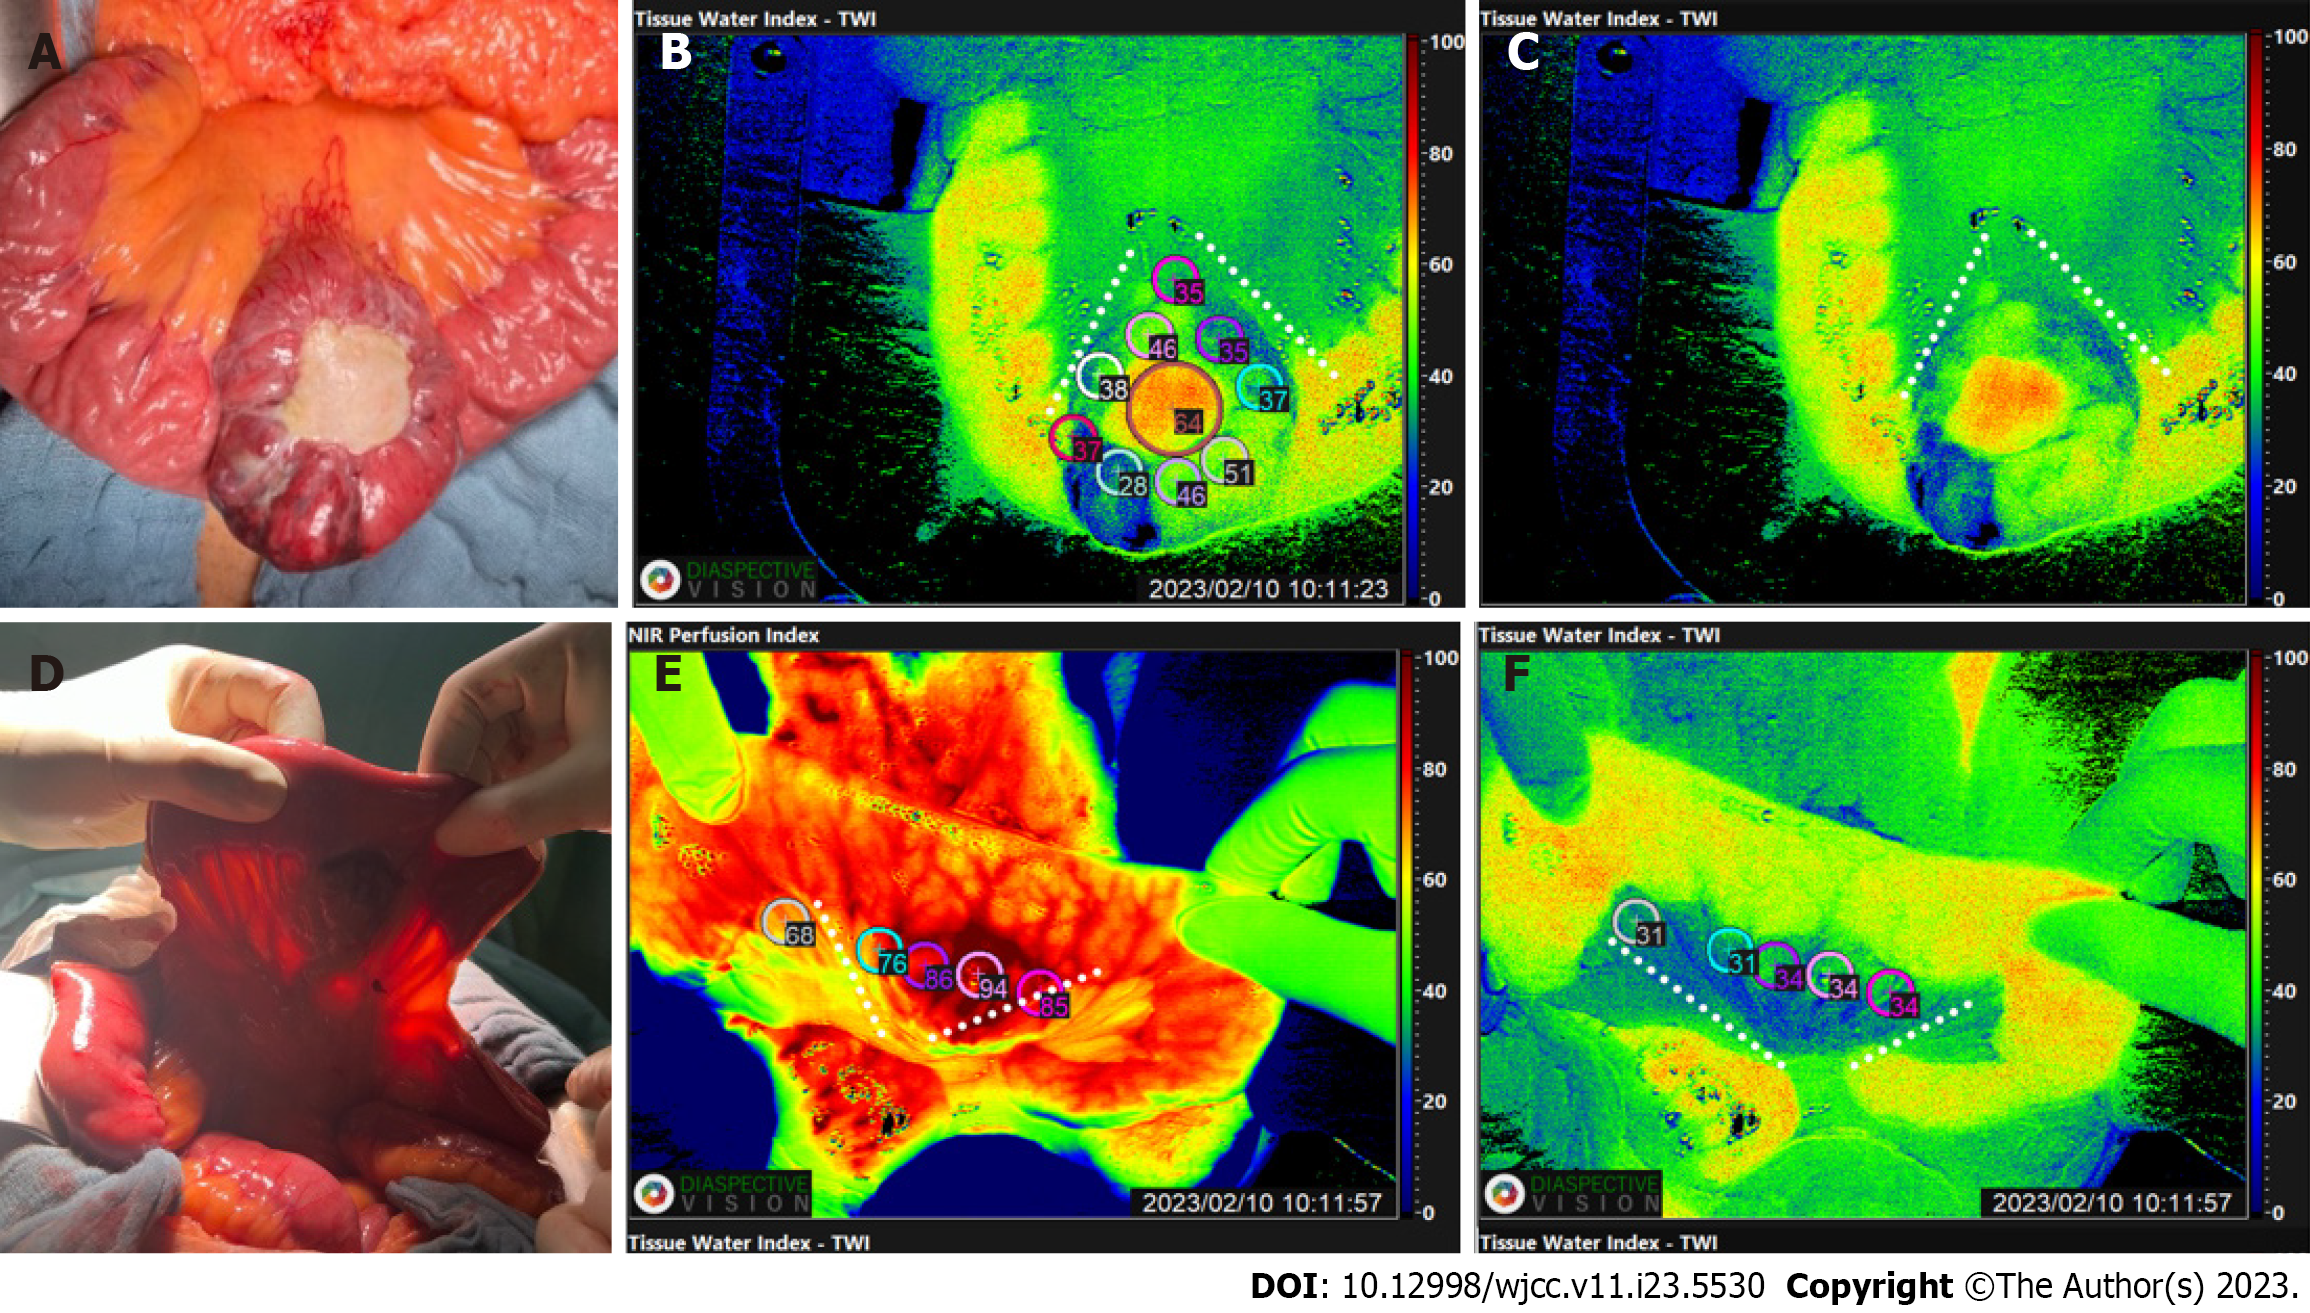
Figure 3 Intraoperative presentation and intraoperative calculation of the optical hyperspectral imaging parameters via TIVITA® tissue.
Circles represent the “region of interest” and the dotted line shows the selected resection margins before incision. A: Red–green–blue (RGB) image of the tumour; B: Tissue water index (TWI) of the tumour with the regions of interest (ROI) and planed resection margins; C: TWI of the tumour focused only on the resection margins; D: RGB of the tumour, focused on the antimesenteric side; E: Near-Infra-Red of the tumour with the ROI and planed resection margins, focused on the antimesenteric side; F: TWI of the tumour focused only on the resection margins, focused on the antimesenteric side.
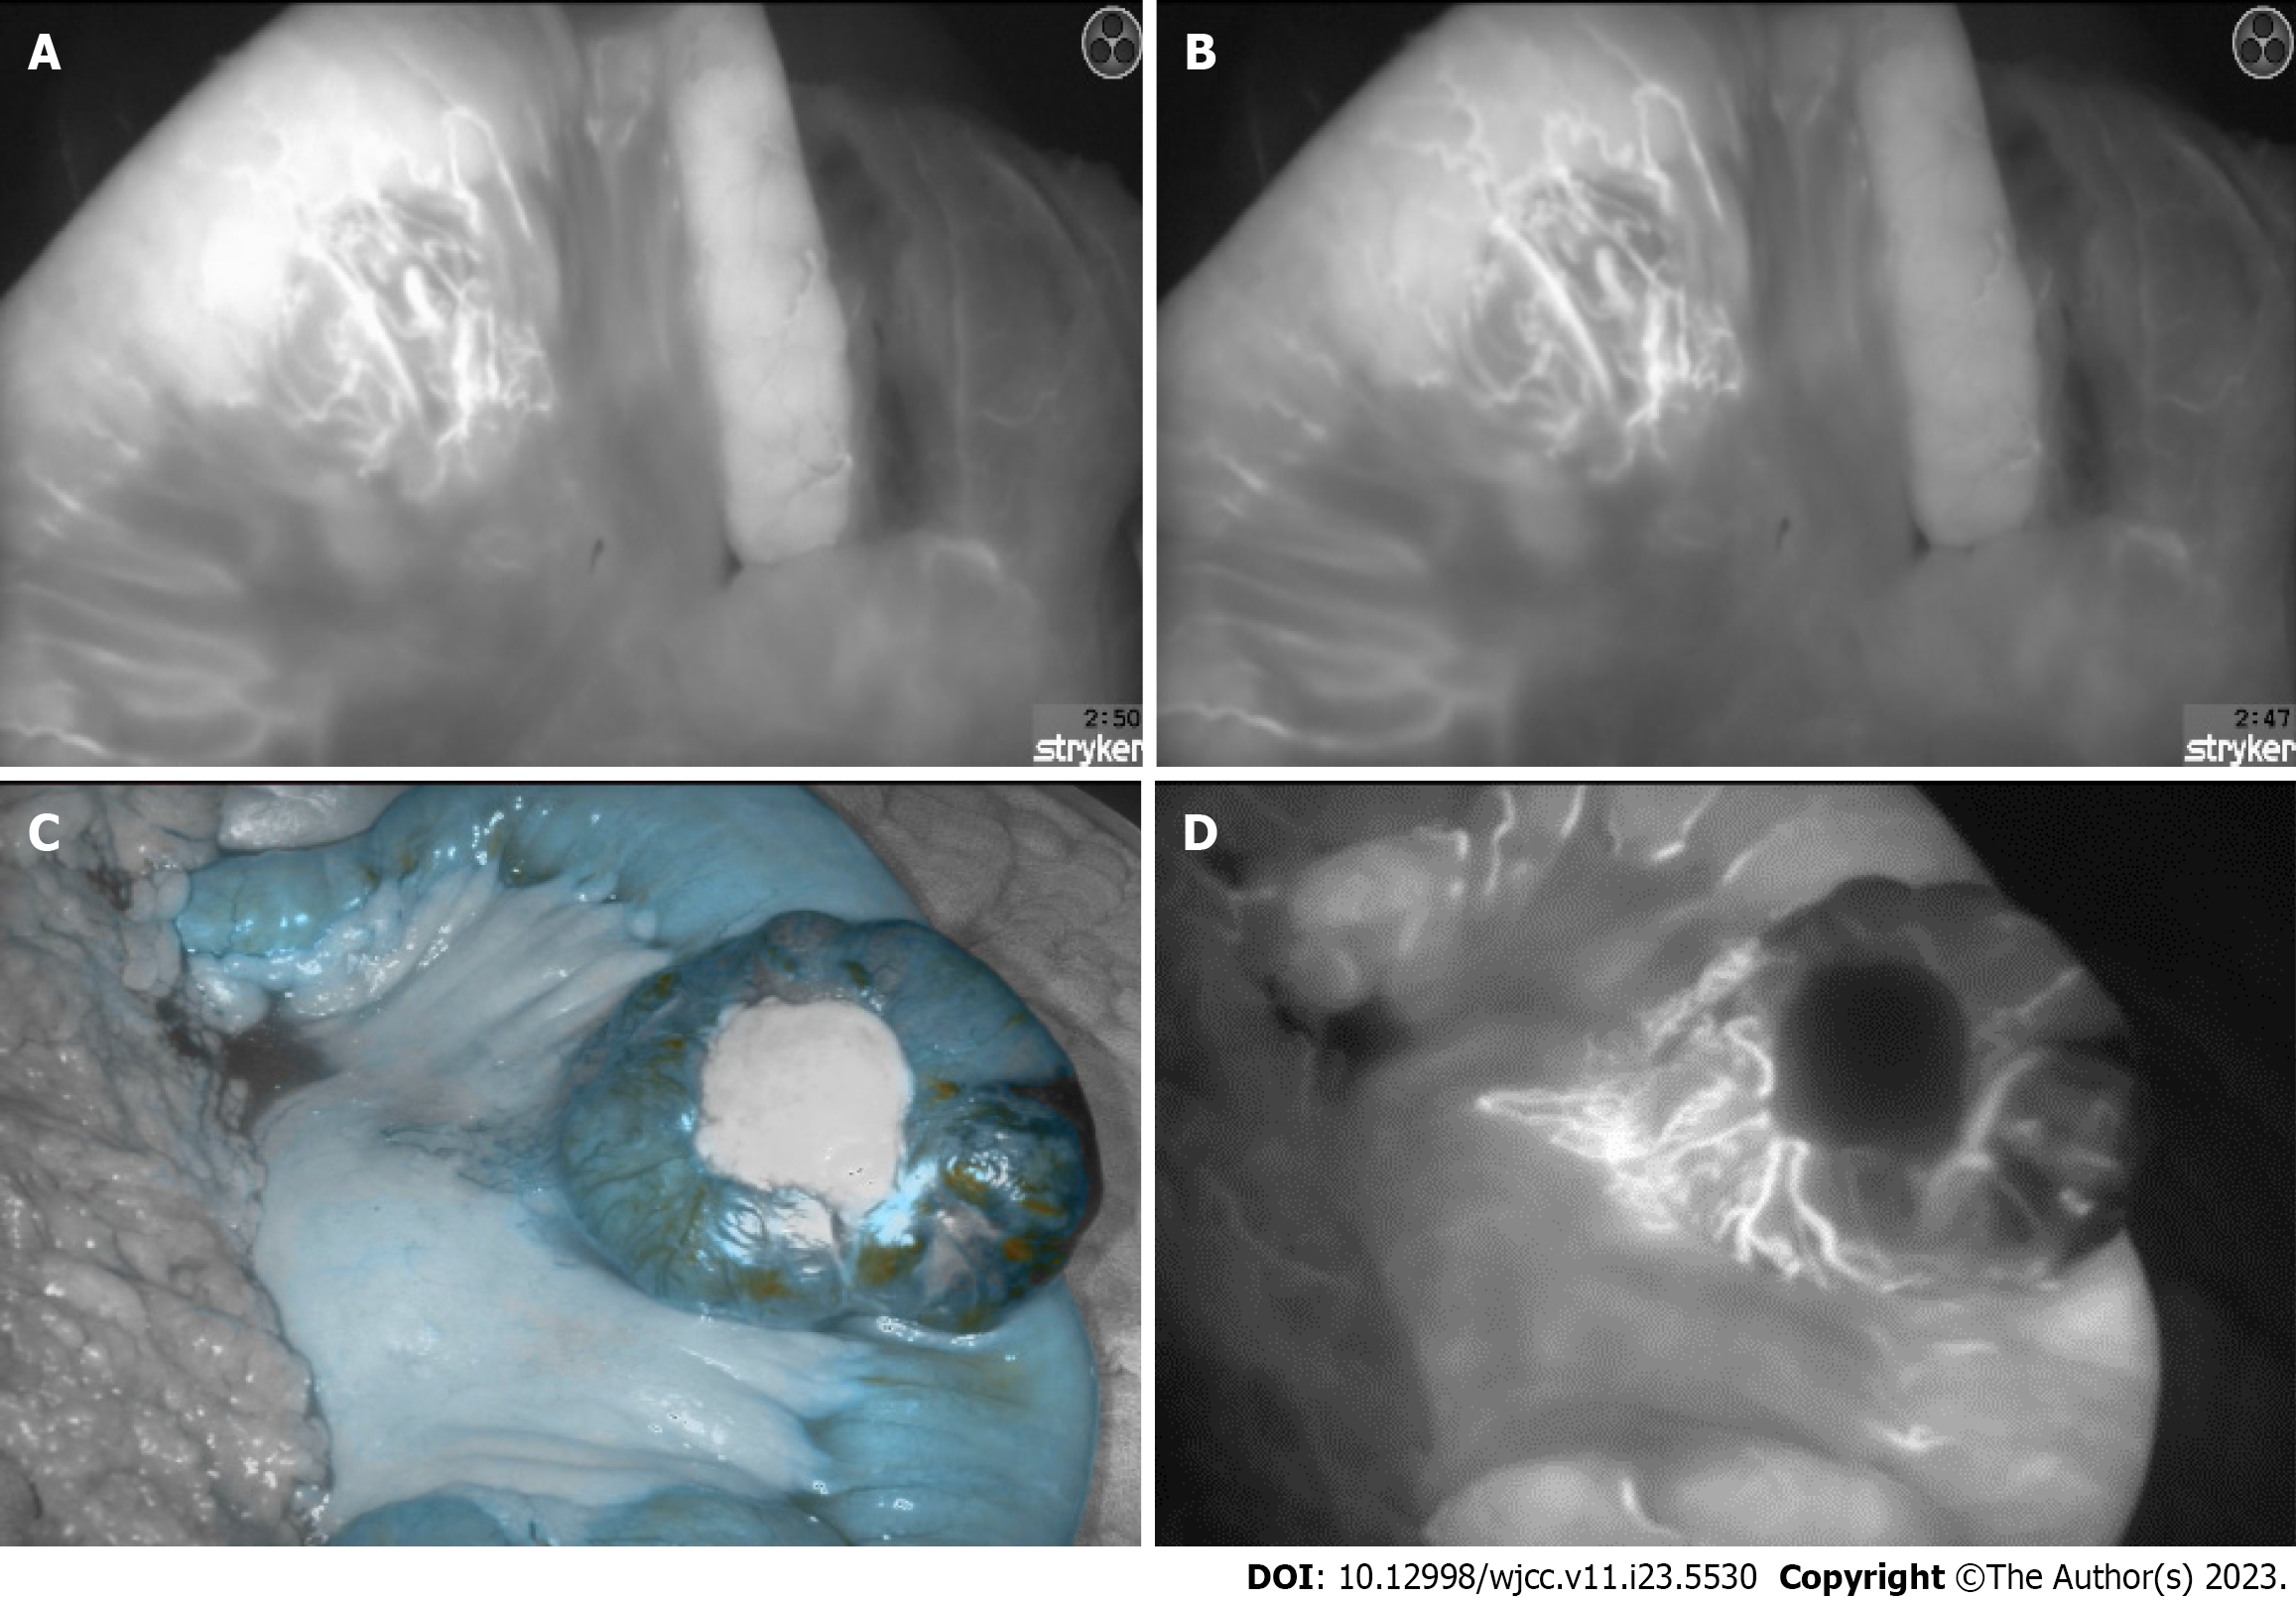
Figure 4 Early and late onset image of the anterior side posterior side of the tumor mass after indocyanine green application and simultaneous observation of the arteriovenous malformations using fluorescence imaging device.
A: Anterior side, early onset image of the tumor mass after indocyanine green application; B: Anterior side, late onset image of the tumor mass after indocyanine green application; C: Posterior side, early onset image of the tumor mass after indocyanine green application; D: Posterior side, onset image of the tumor mass after indocyanine green application.
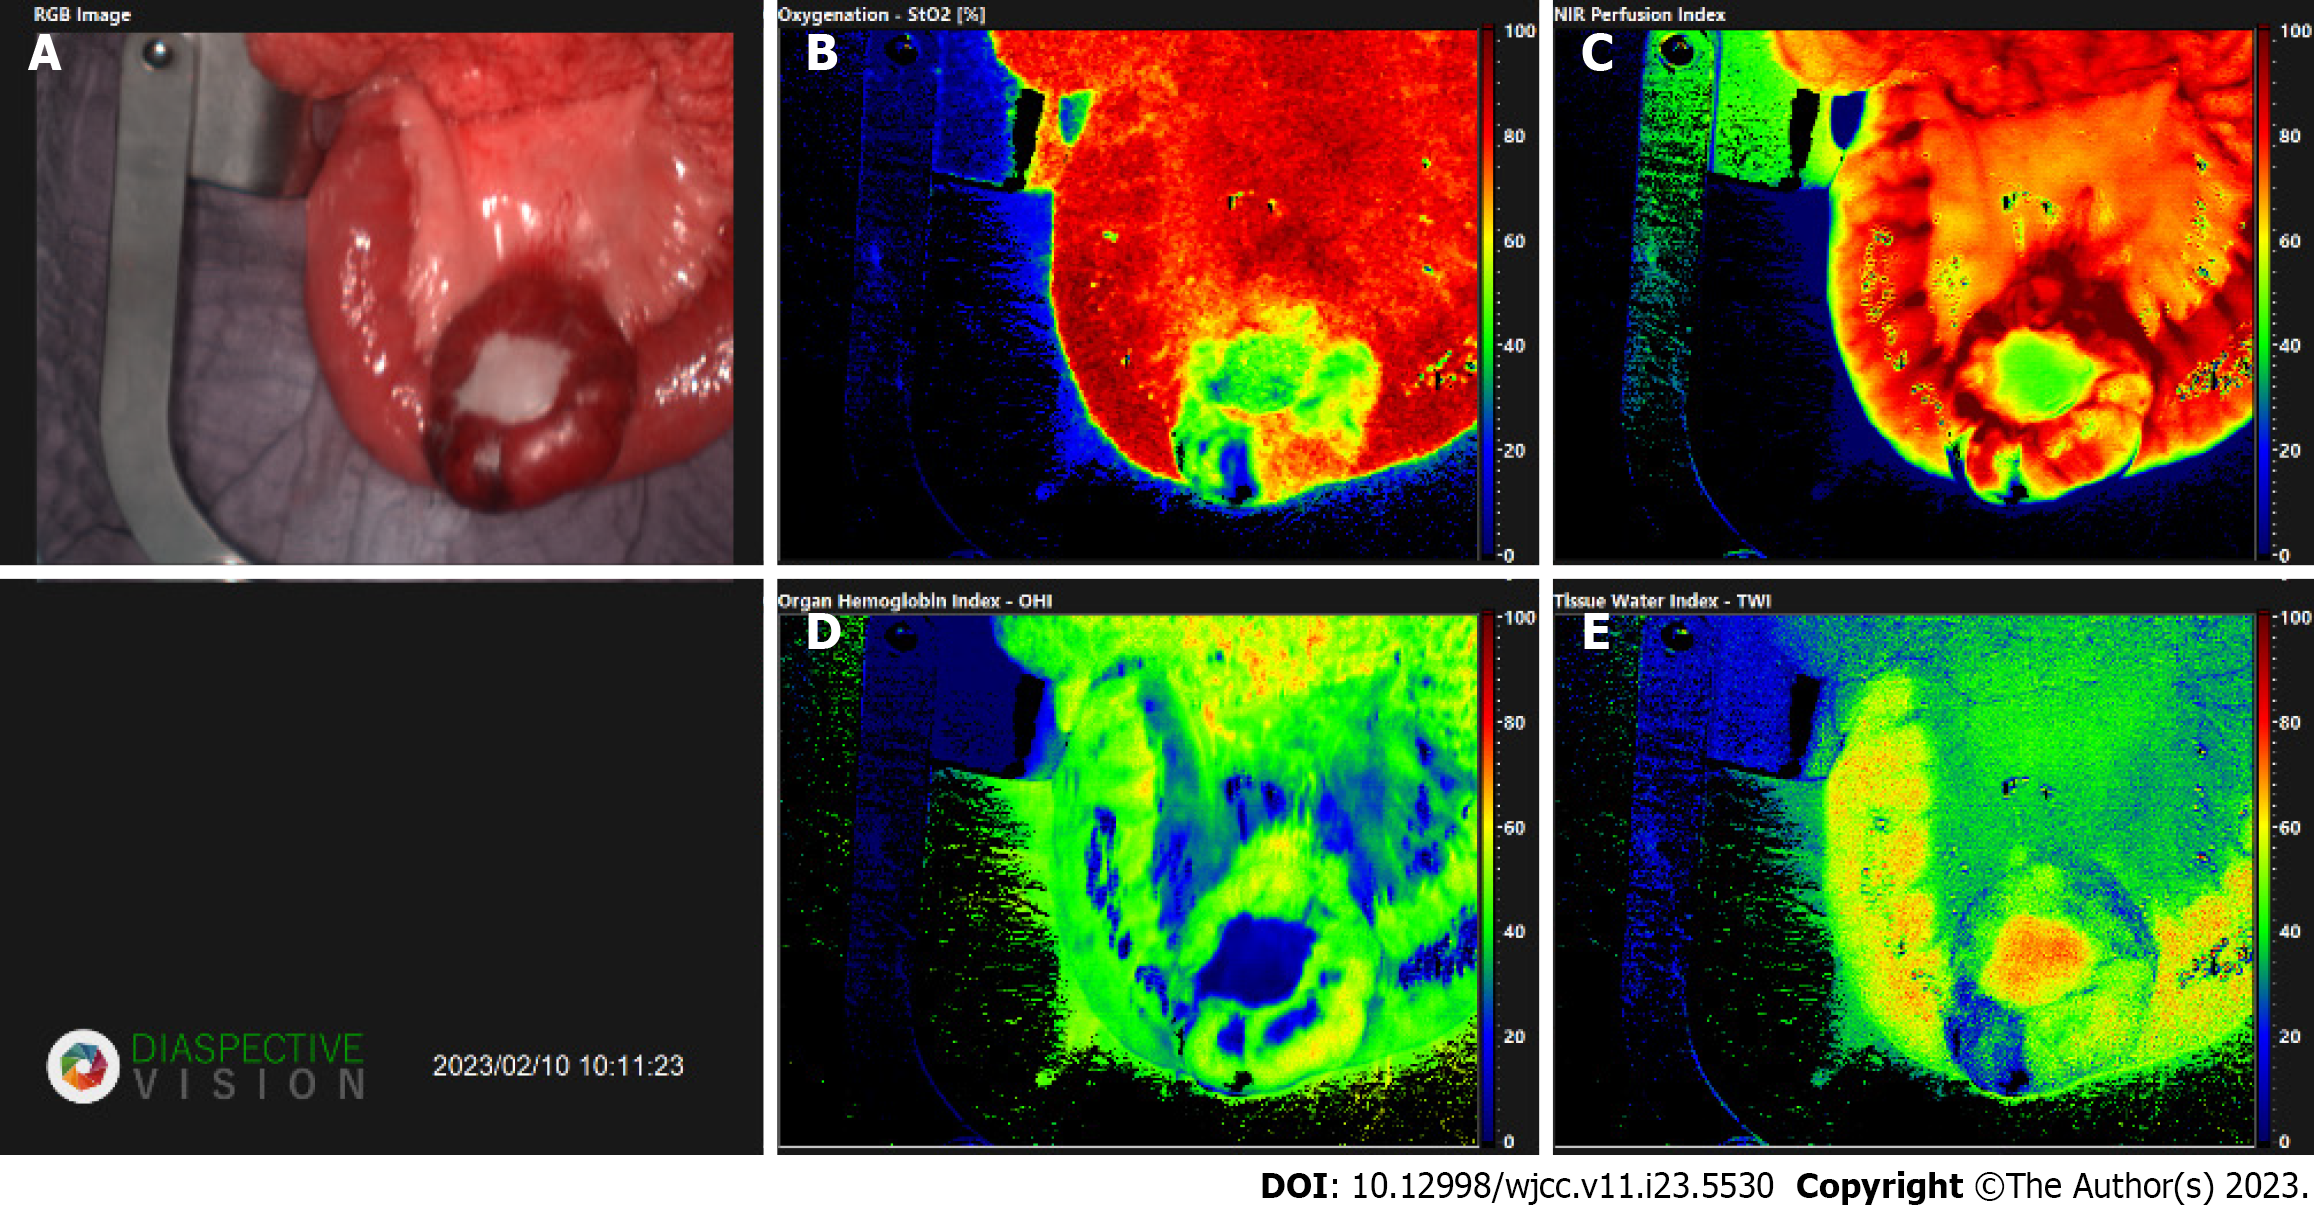
Figure 5 Images acquired via TIVITA® Tissue system (Diaspective Vision GmbH, Am Salzhaff, Germany).
The software provides a red–green–blue image (RGB image) and four false-color images with an effective number of 640 × 480 pixels, which respectively represent tissue oxygenation, near-infrared perfusion index, tissue water index, and organ hemoglobin index[5]. A: Red–green–blue image; B: Oxygenation; C: Near infra-red perfusion index; D: Organ hemoglobin index; E: Tissue- water- index.
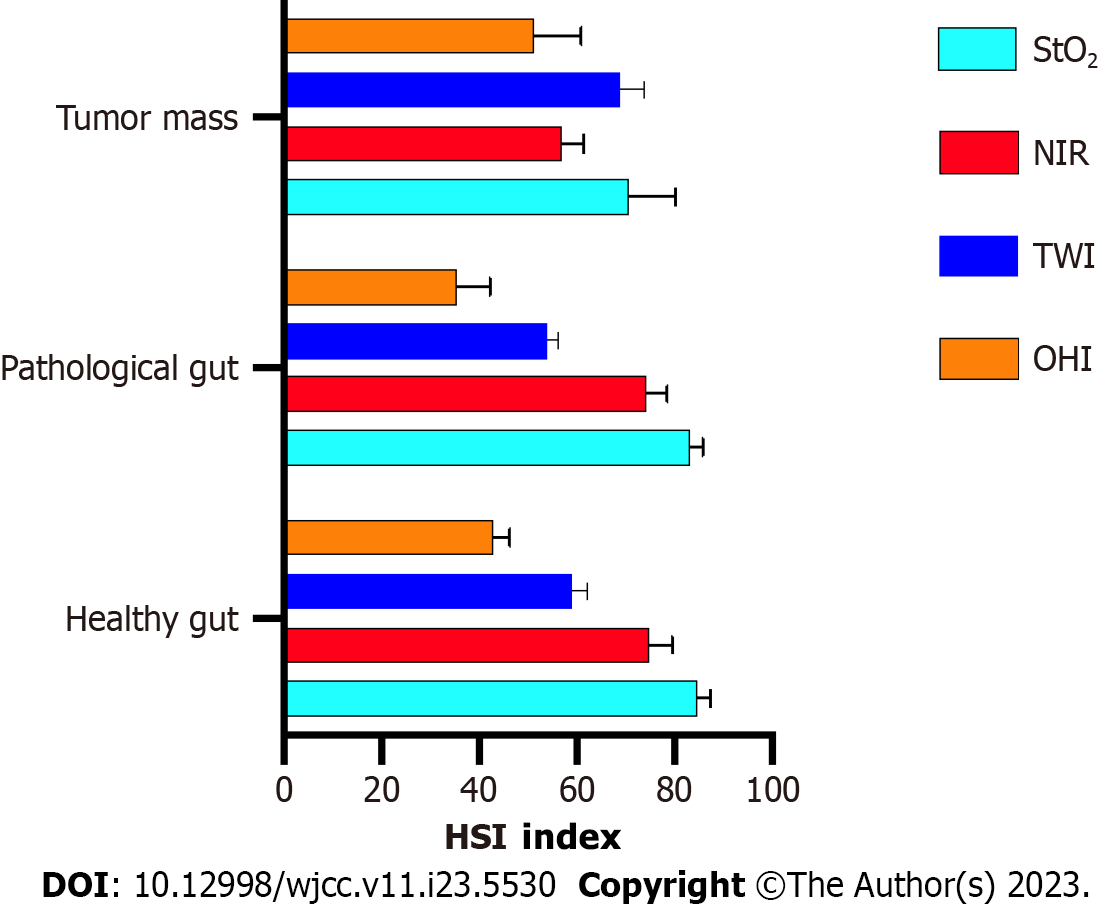
Figure 6 Comparison of the hyperspectral parameters of the macroscopic healthy, pathological transformed gut and the tumor mass/AV- fistula.
HSI: Hyperspectral imaging; TWI: Tissue water index.
- Citation: Wagner T, Mustafov O, Hummels M, Grabenkamp A, Thomas MN, Schiffmann LM, Bruns CJ, Stippel DL, Wahba R. Imaged guided surgery during arteriovenous malformation of gastrointestinal stromal tumor using hyperspectral and indocyanine green visualization techniques: A case report. World J Clin Cases 2023; 11(23): 5530-5537
- URL: https://www.wjgnet.com/2307-8960/full/v11/i23/5530.htm
- DOI: https://dx.doi.org/10.12998/wjcc.v11.i23.5530


