Copyright
©The Author(s) 2023.
World J Clin Cases. Aug 16, 2023; 11(23): 5479-5493
Published online Aug 16, 2023. doi: 10.12998/wjcc.v11.i23.5479
Published online Aug 16, 2023. doi: 10.12998/wjcc.v11.i23.5479
Figure 1 Keyword co-occurrence cluster of Zeiss Optical coherence tomography-angiography clinical researches based on bibliometric analysis in recent 20 years.
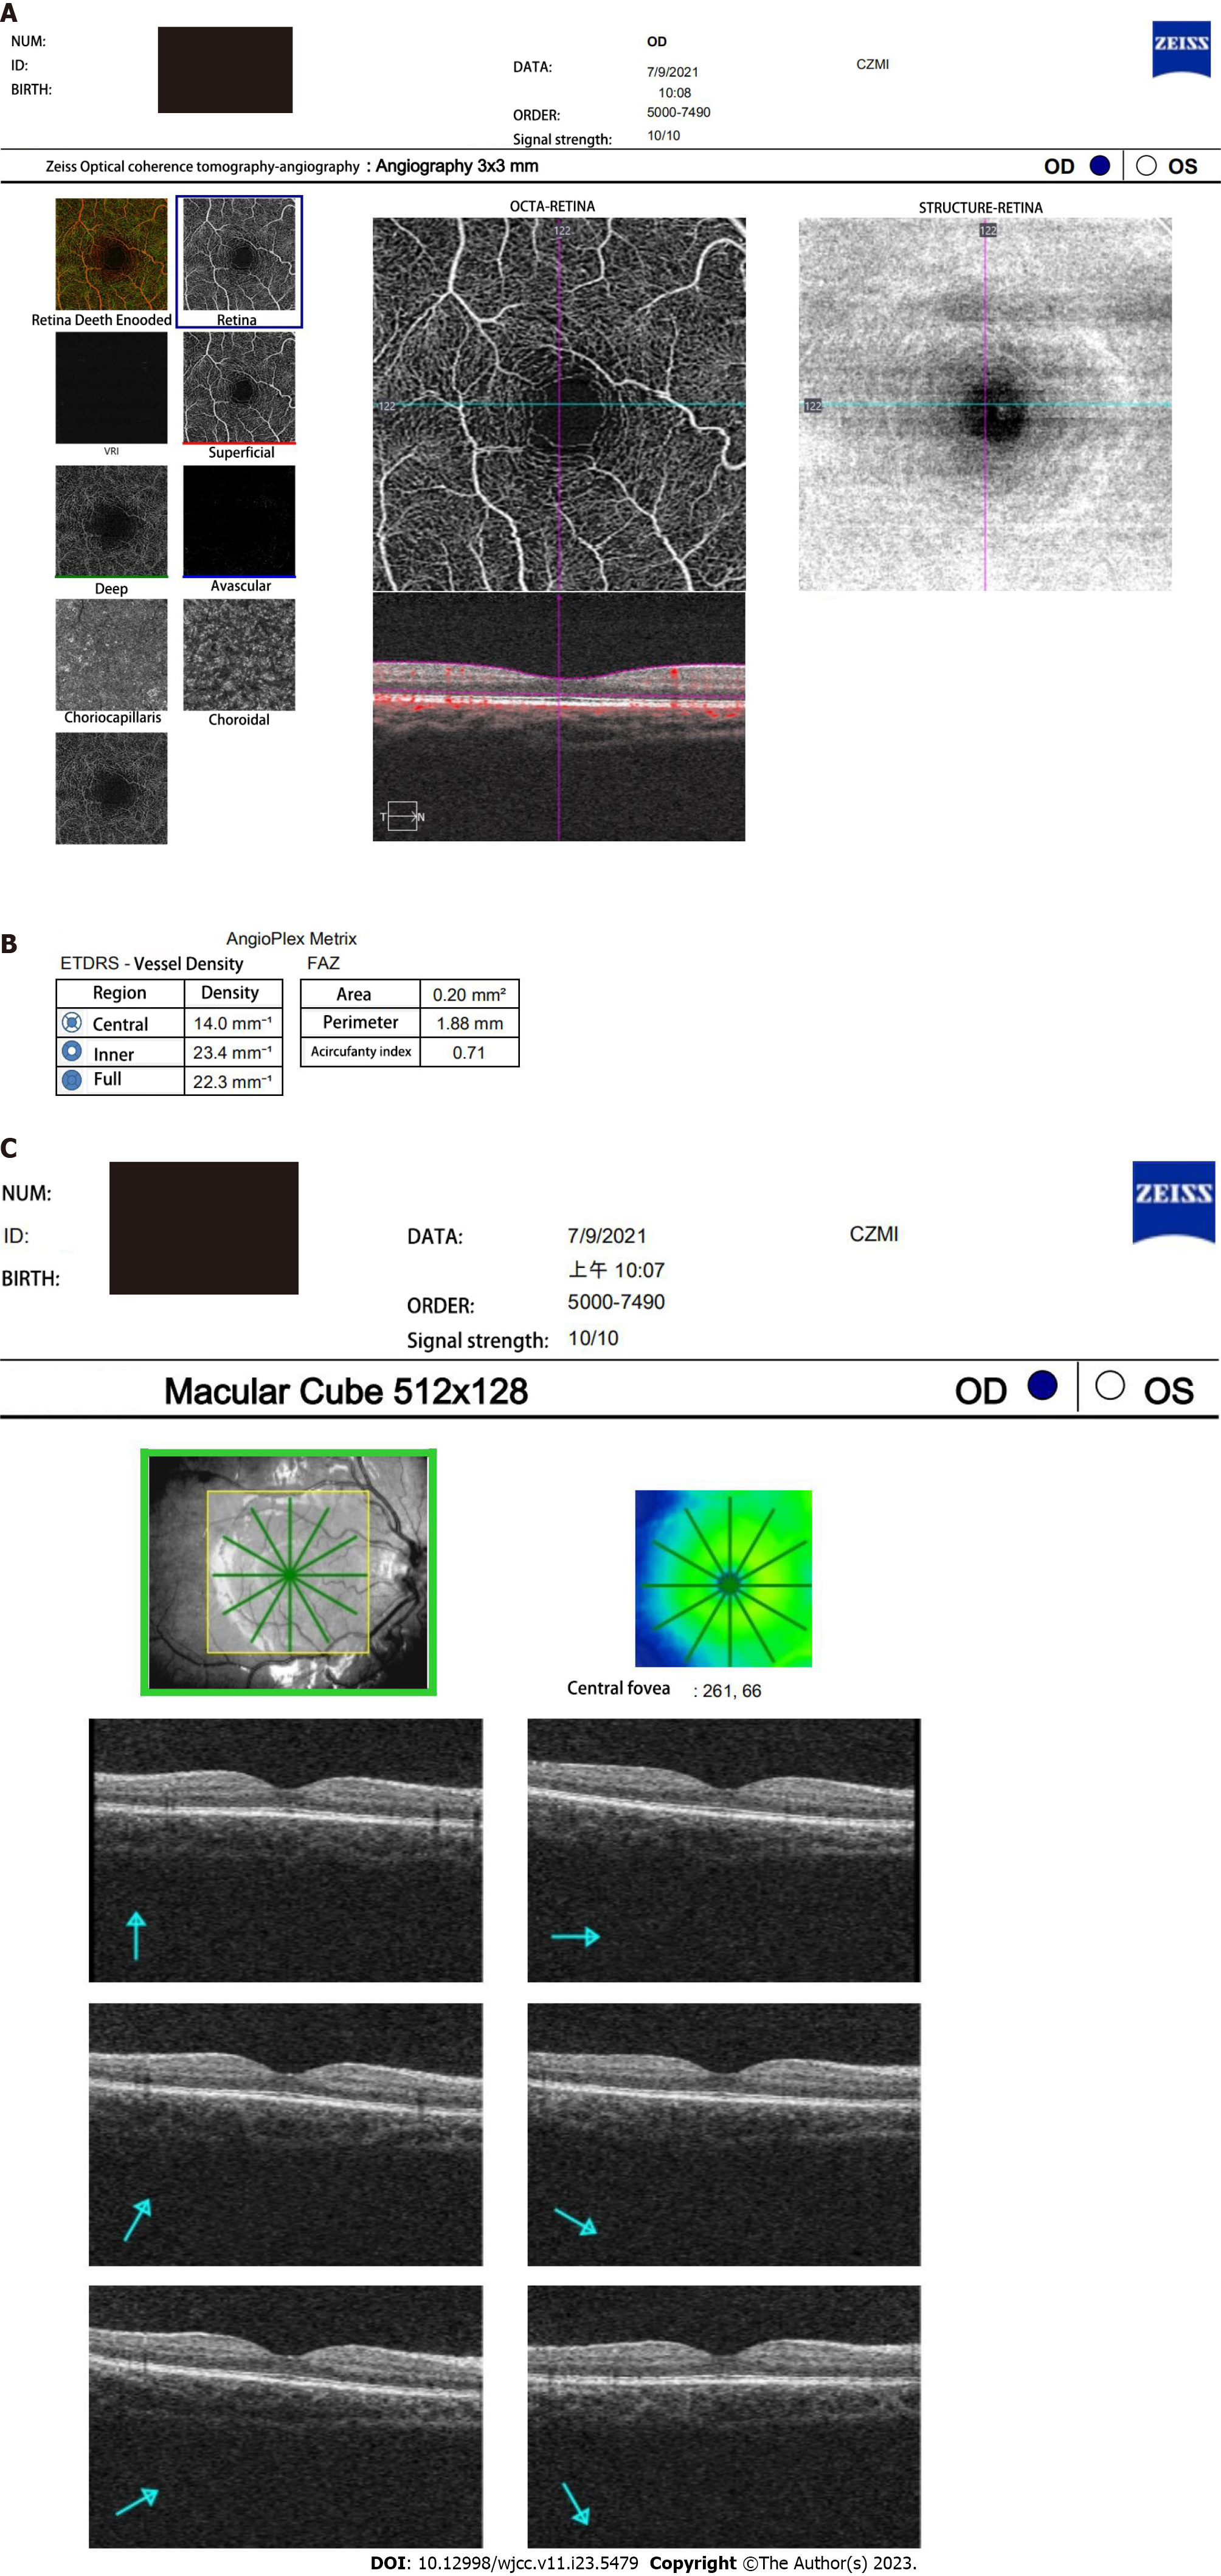
Figure 2 The optical coherence tomography angiography images obtained by participant.
A: Optical coherence tomography angiography (OCTA) images of superficial capillary plexus (SCP) in the macula; B: OCTA image showing 3 mm × 3 mm scanning model in the SCP of the macula. OCTA image showing foveal avascular zone area obtained automatically by OCTA software; C: OCTA image showing 512 × 128 scanning model in the macular cube. FAZ: Foveal avascular zone.
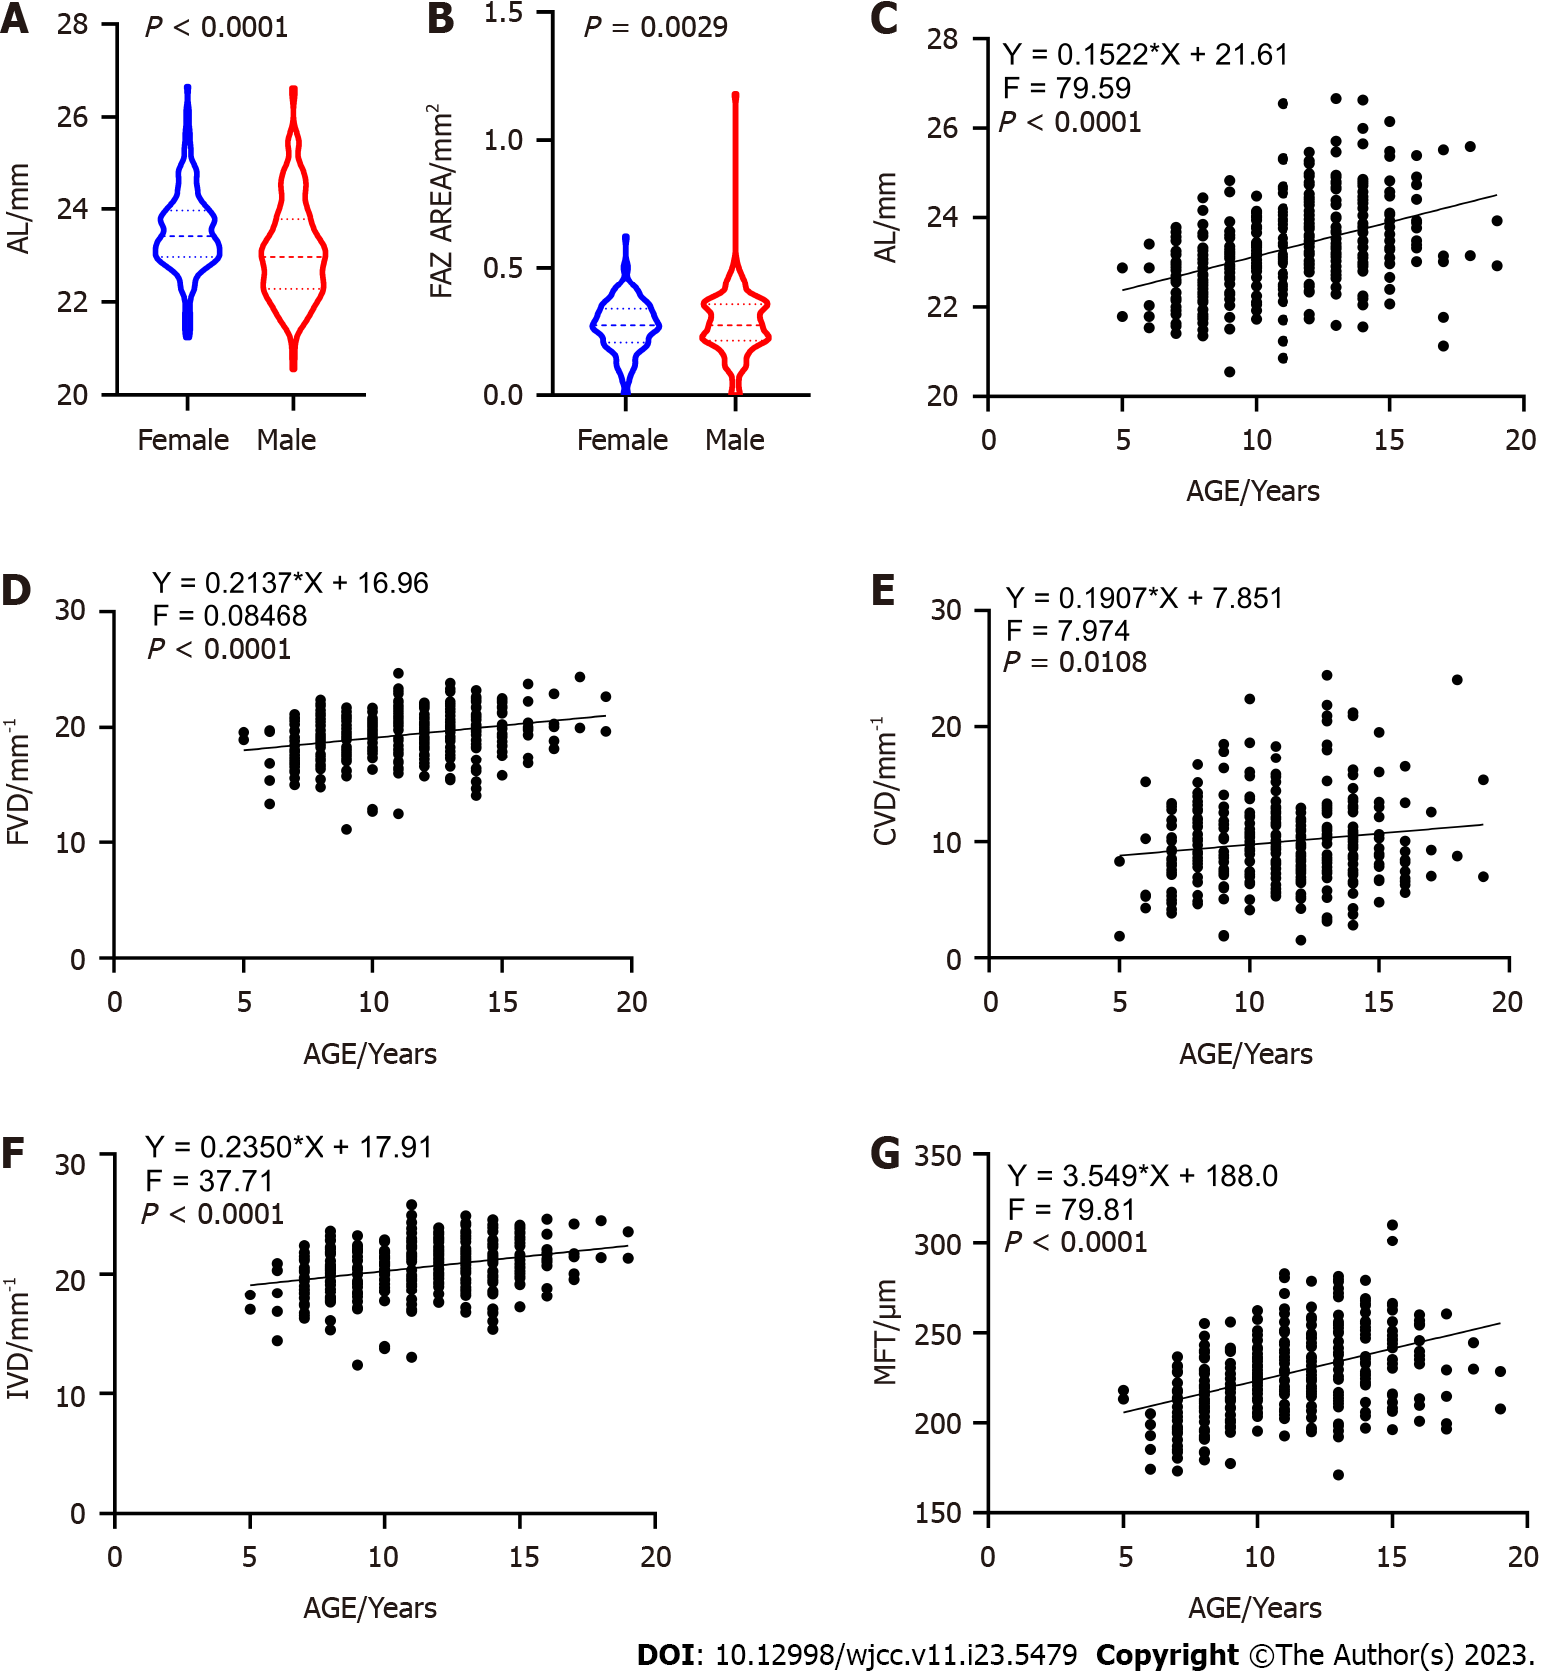
Figure 3 Graphs show vessel density and mean foveal thickness distribution.
A and B: The violin mapshows comparison of the axial length (AL, A) and foveal avascular zone area (B) by gender (P < 0.001); C: Scatter plots showing positive correlation between ages and AL; D-G: Scatter plots showing positive correlation between ages and full (D) and inner macular vascular density (E) whole and deep macular vascular density (F), positive correlation between ages and the mean foveal thickness (G). P < 0.01. AL: Axial length; FAZ: Foveal avascular zone; AREA: The living environment of participant; FVD: Full vascular plexus density; CVD: Central vascular plexus density; IVD: Inner vascular plexus density; MFT: Mean foveal thickness; AGE: Age of participant.
Figure 4 Box plot shows the habitat distribution of the optical coherence tomography angiography result in health students.
A: Axial length, P = 0.0346; B: Full vascular plexus density, P = 0.0532; C: Inner vascular plexus density, P = 0.0379. AL: Axial length; FVD: Full vascular plexus density; IVD: Inner vascular plexus density.
- Citation: Sun KX, Xiang YG, Zhang T, Yi SL, Xia JY, Yang X, Zheng SJ, Ji Y, Wan WJ, Hu K. Evaluation of childhood developing via optical coherence tomography-angiography in Qamdo, Tibet, China: A prospective cross-sectional, school-based study. World J Clin Cases 2023; 11(23): 5479-5493
- URL: https://www.wjgnet.com/2307-8960/full/v11/i23/5479.htm
- DOI: https://dx.doi.org/10.12998/wjcc.v11.i23.5479


