Copyright
©The Author(s) 2023.
World J Clin Cases. Jul 16, 2023; 11(20): 4833-4842
Published online Jul 16, 2023. doi: 10.12998/wjcc.v11.i20.4833
Published online Jul 16, 2023. doi: 10.12998/wjcc.v11.i20.4833
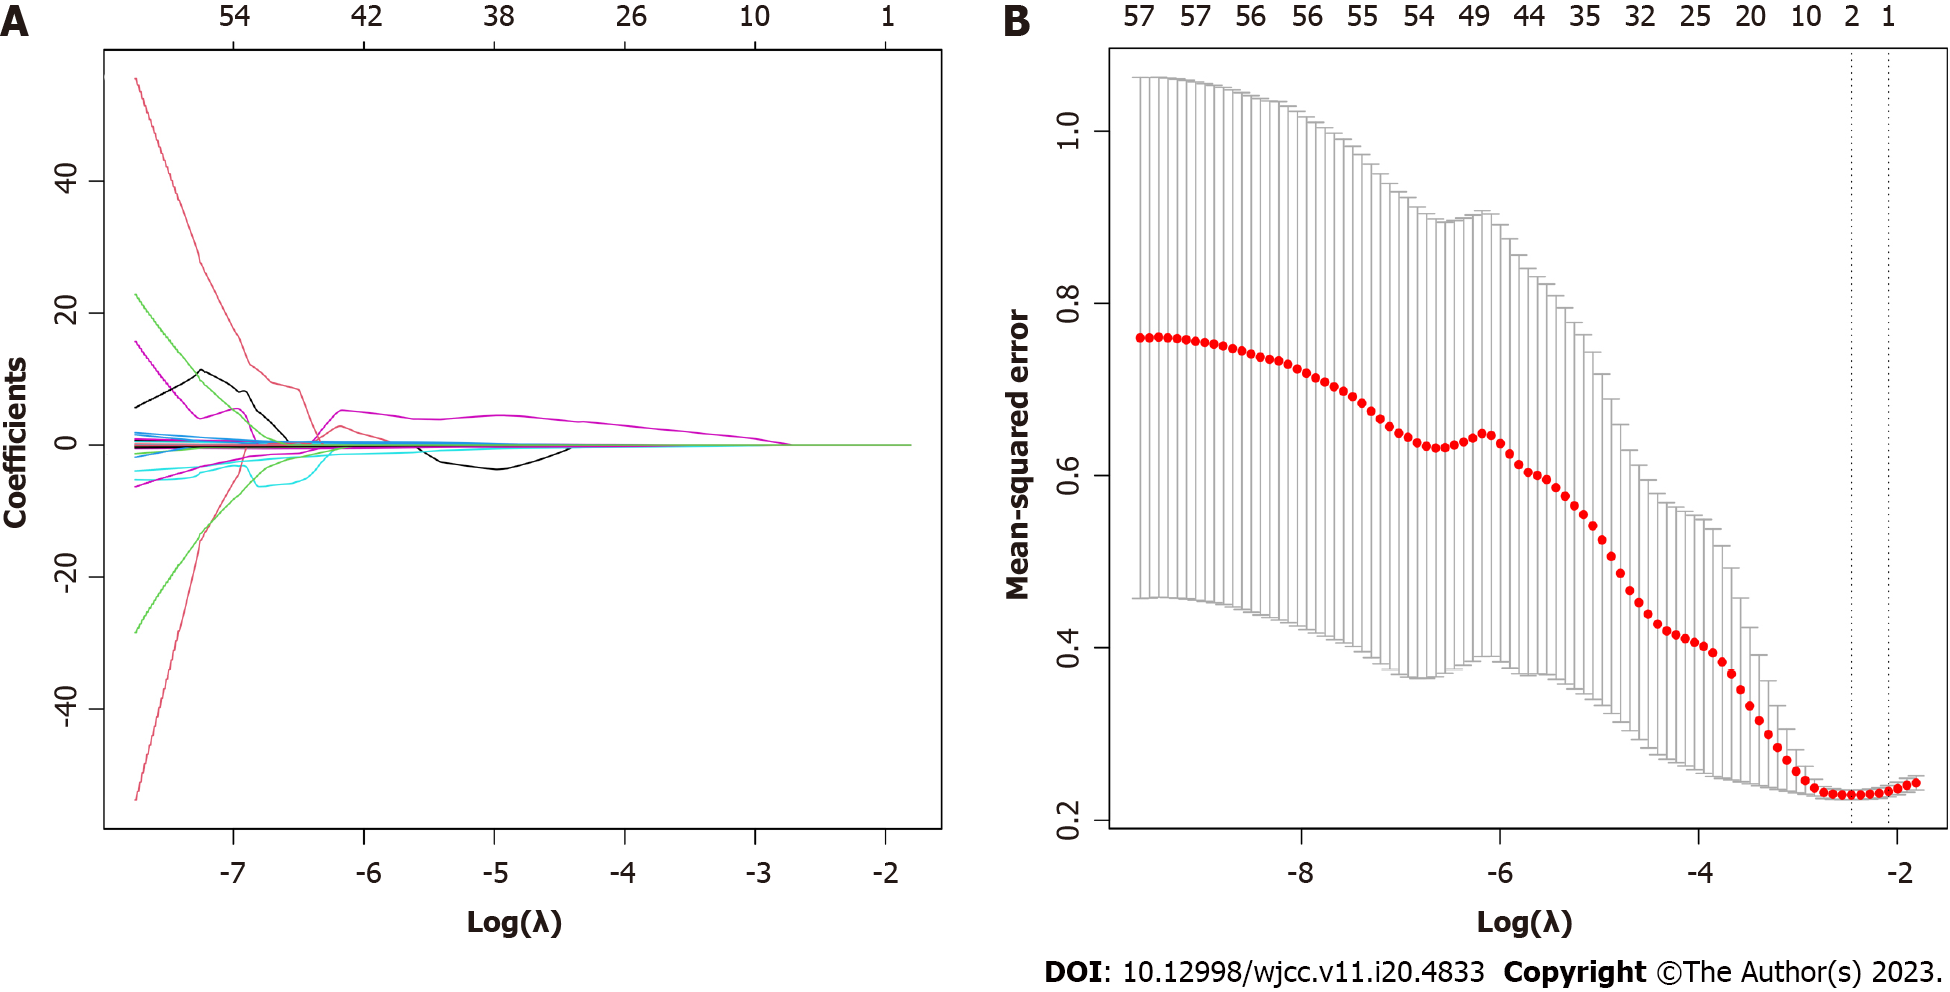
Figure 1 Identification of variables distinguishing Gram-positive from Gram-negative infection using least absolute shrinkage and selection operator regression analysis.
A: Least absolute shrinkage and selection operator regression coefficient curves of 57 variables for the log(λ) sequence. Ten-fold cross-validation was used to obtain the three variables with non-zero coefficients for the optimal parameter (λ): age, interleukin 6 and aspartate aminotransferase; B: The optimal parameter (λ) in the least absolute shrinkage and selection operator model was selected by ten-fold cross-validation and then used to yield the relationship between the partial binomial deviation curve and log(λ). The dashed vertical lines were delineated at the optimal value using the lowest standard error and 1-standard error.
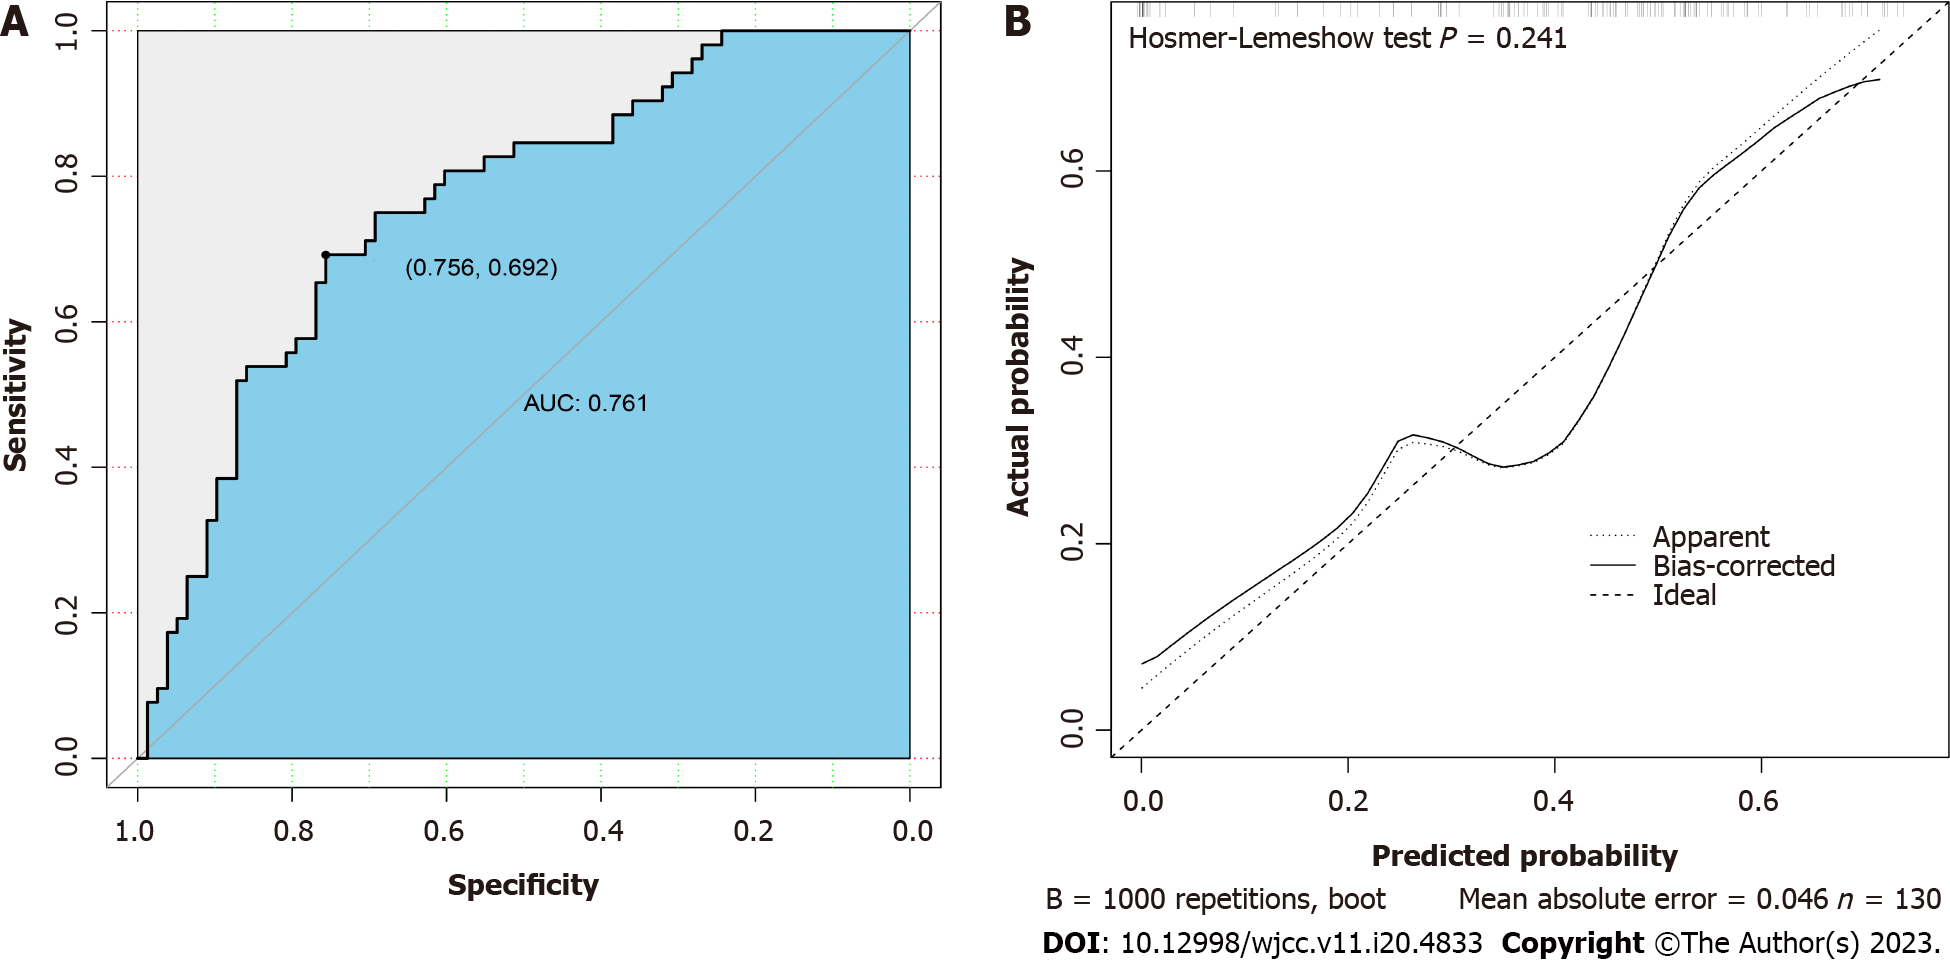
Figure 2 Validation of the predictive model by receiver operating characteristic curve analysis.
A: Receiver operating characteristic curve and area under the curve of the prediction model. The X-axis represented the specificity, and the Y-axis represented the sensitivity of the model; B: Calibration curve of the prediction model. The X-axis represented the predicted risk of Gram-positive bacterial infection, and the Y-axis represented the actual risk of Gram-positive bacterial infection. AUC: Area under the curve.
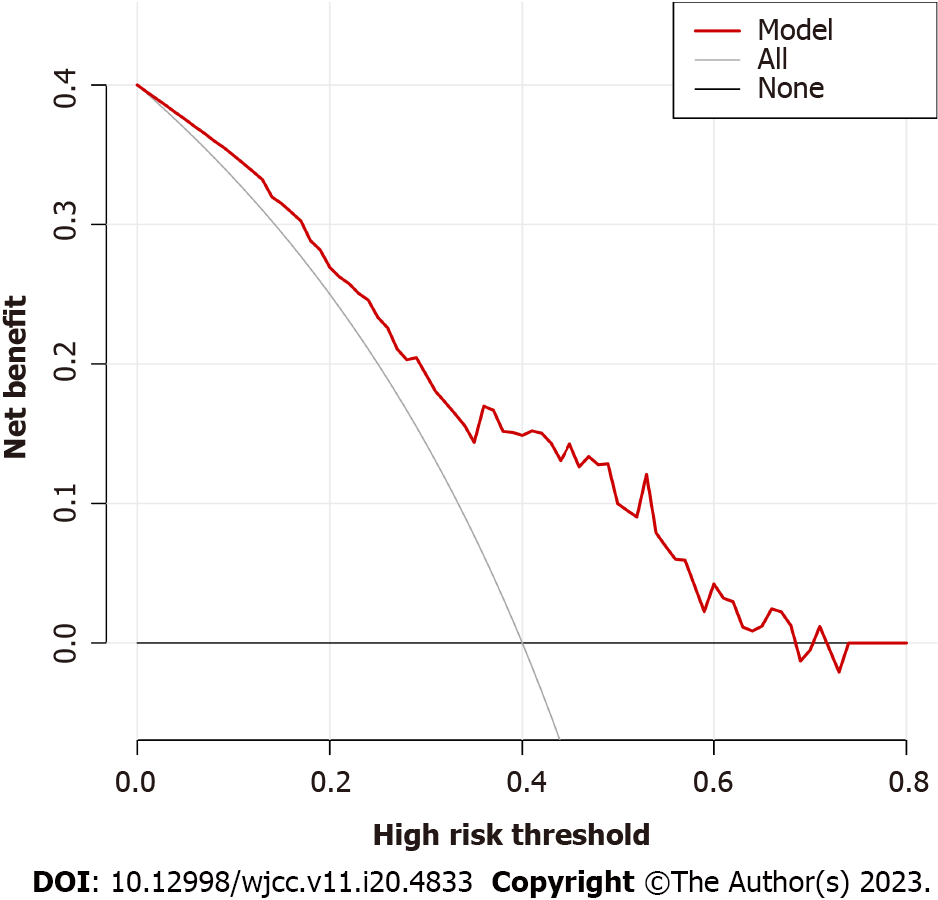
Figure 3 Decision curve analysis of the model.
The thin solid line represented the hypothesis that all patients were infected with Gram-positive bacteria, and the thick solid line represented the hypothesis that no patient was infected with Gram-positive bacteria. The Y-axis denoted the net benefit, which is positive from 0% to 68%.
Figure 4 A nomogram including age and plasma interleukin-6 concentration for distinguishing Gram-positive from Gram-negative bacteremia.
IL-6: Interleukin-6.
- Citation: Zhang W, Chen T, Chen HJ, Chen N, Xing ZX, Fu XY. Risk prediction model for distinguishing Gram-positive from Gram-negative bacteremia based on age and cytokine levels: A retrospective study. World J Clin Cases 2023; 11(20): 4833-4842
- URL: https://www.wjgnet.com/2307-8960/full/v11/i20/4833.htm
- DOI: https://dx.doi.org/10.12998/wjcc.v11.i20.4833


