Copyright
©The Author(s) 2023.
World J Clin Cases. Jul 16, 2023; 11(20): 4763-4787
Published online Jul 16, 2023. doi: 10.12998/wjcc.v11.i20.4763
Published online Jul 16, 2023. doi: 10.12998/wjcc.v11.i20.4763
Figure 1 Flowchart for research into bioinformatics data from Gene Expression Omnibus, The Cancer Genome Atlas and Gene Expression Profiling Interactive Analysis.
GEO: Gene Expression Omnibus; TCGA: The Cancer Genome Atlas; GEPIA: Gene Expression Profiling Interactive Analysis; DEGs: Differentially expressed genes; GO: Gene Ontology; KEEG: Kyoto Encyclopedia of Gene and Genome; GSEA: Gene Set Enrichment Analysis.
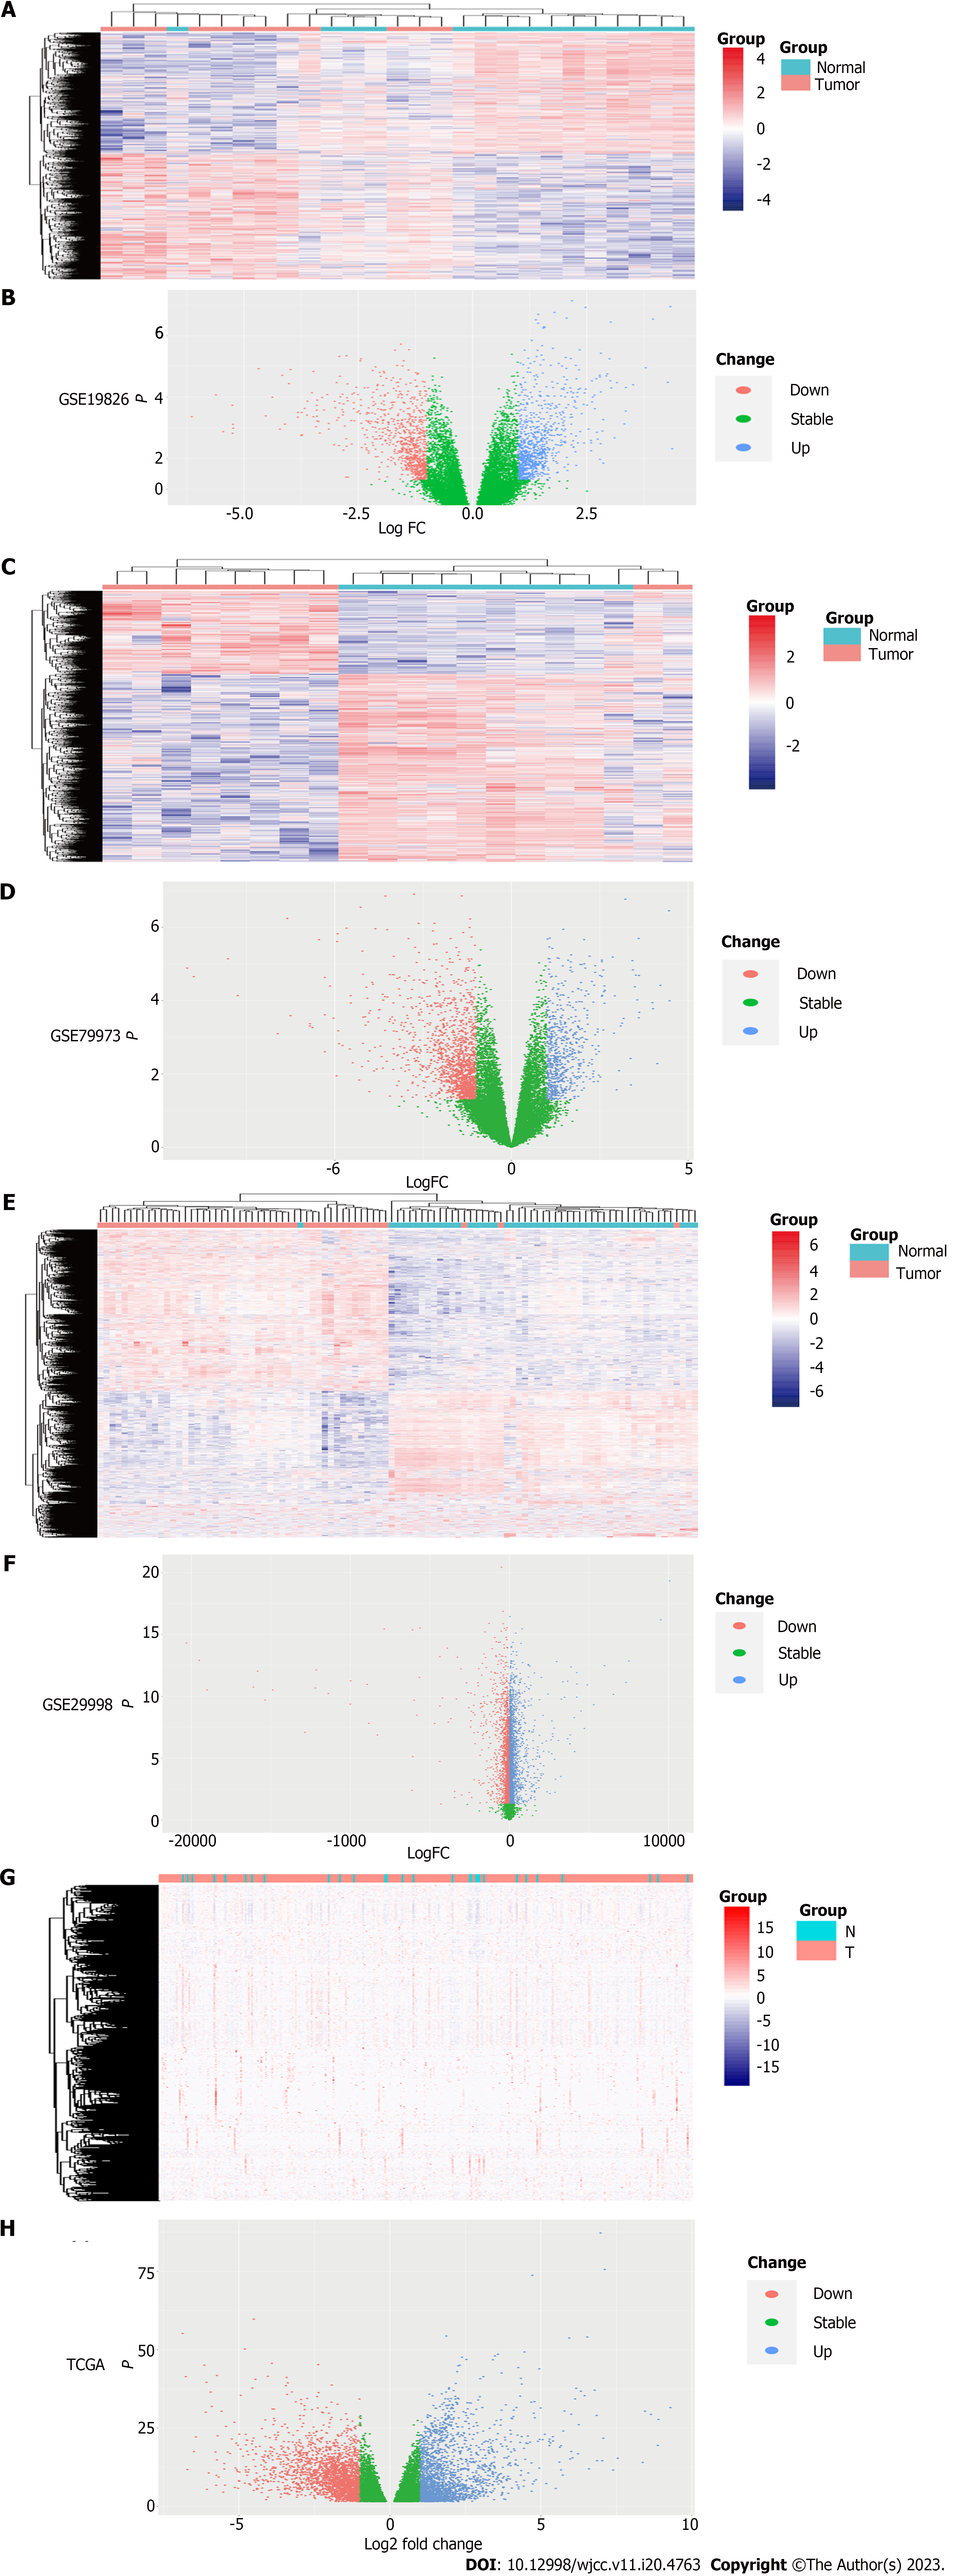
Figure 2 Identification of differentially expressed genes from The Cancer Genome Atlas and Gene Expression Omnibus Datasets.
A: The heat map of GSE19826 data set, with 2202 up-regulated genes and 2700 down-regulated genes. The blue normal samples, and the red are tumor samples; B: The volcanic map of GSE19826 dataset; C: The heat map of GSE79973 dataset, with 665 up-regulated genes and 1507 down-regulated genes. The blue are normal samples, and the red are tumor samples; D: The volcanic map of GSE79973 dataset; E: The heat map of GSE29998 dataset, with 4346 up-regulated genes and 3002 down-regulated genes. The blue are normal samples, and the red are tumor samples; F: The volcanic map of GSE29998 data set; G: The heat map of The Cancer Genome Atlas (TCGA) data set, with 2133 up-regulated genes and 2349 down-regulated genes. The blue are normal samples, and the red are tumor samples; H: The volcanic map of TCGA dataset. In B, D, F and H, the red dots are down-regulated genes and the blue dots are up-regulated genes. TCGA: The Cancer Genome Atlas.
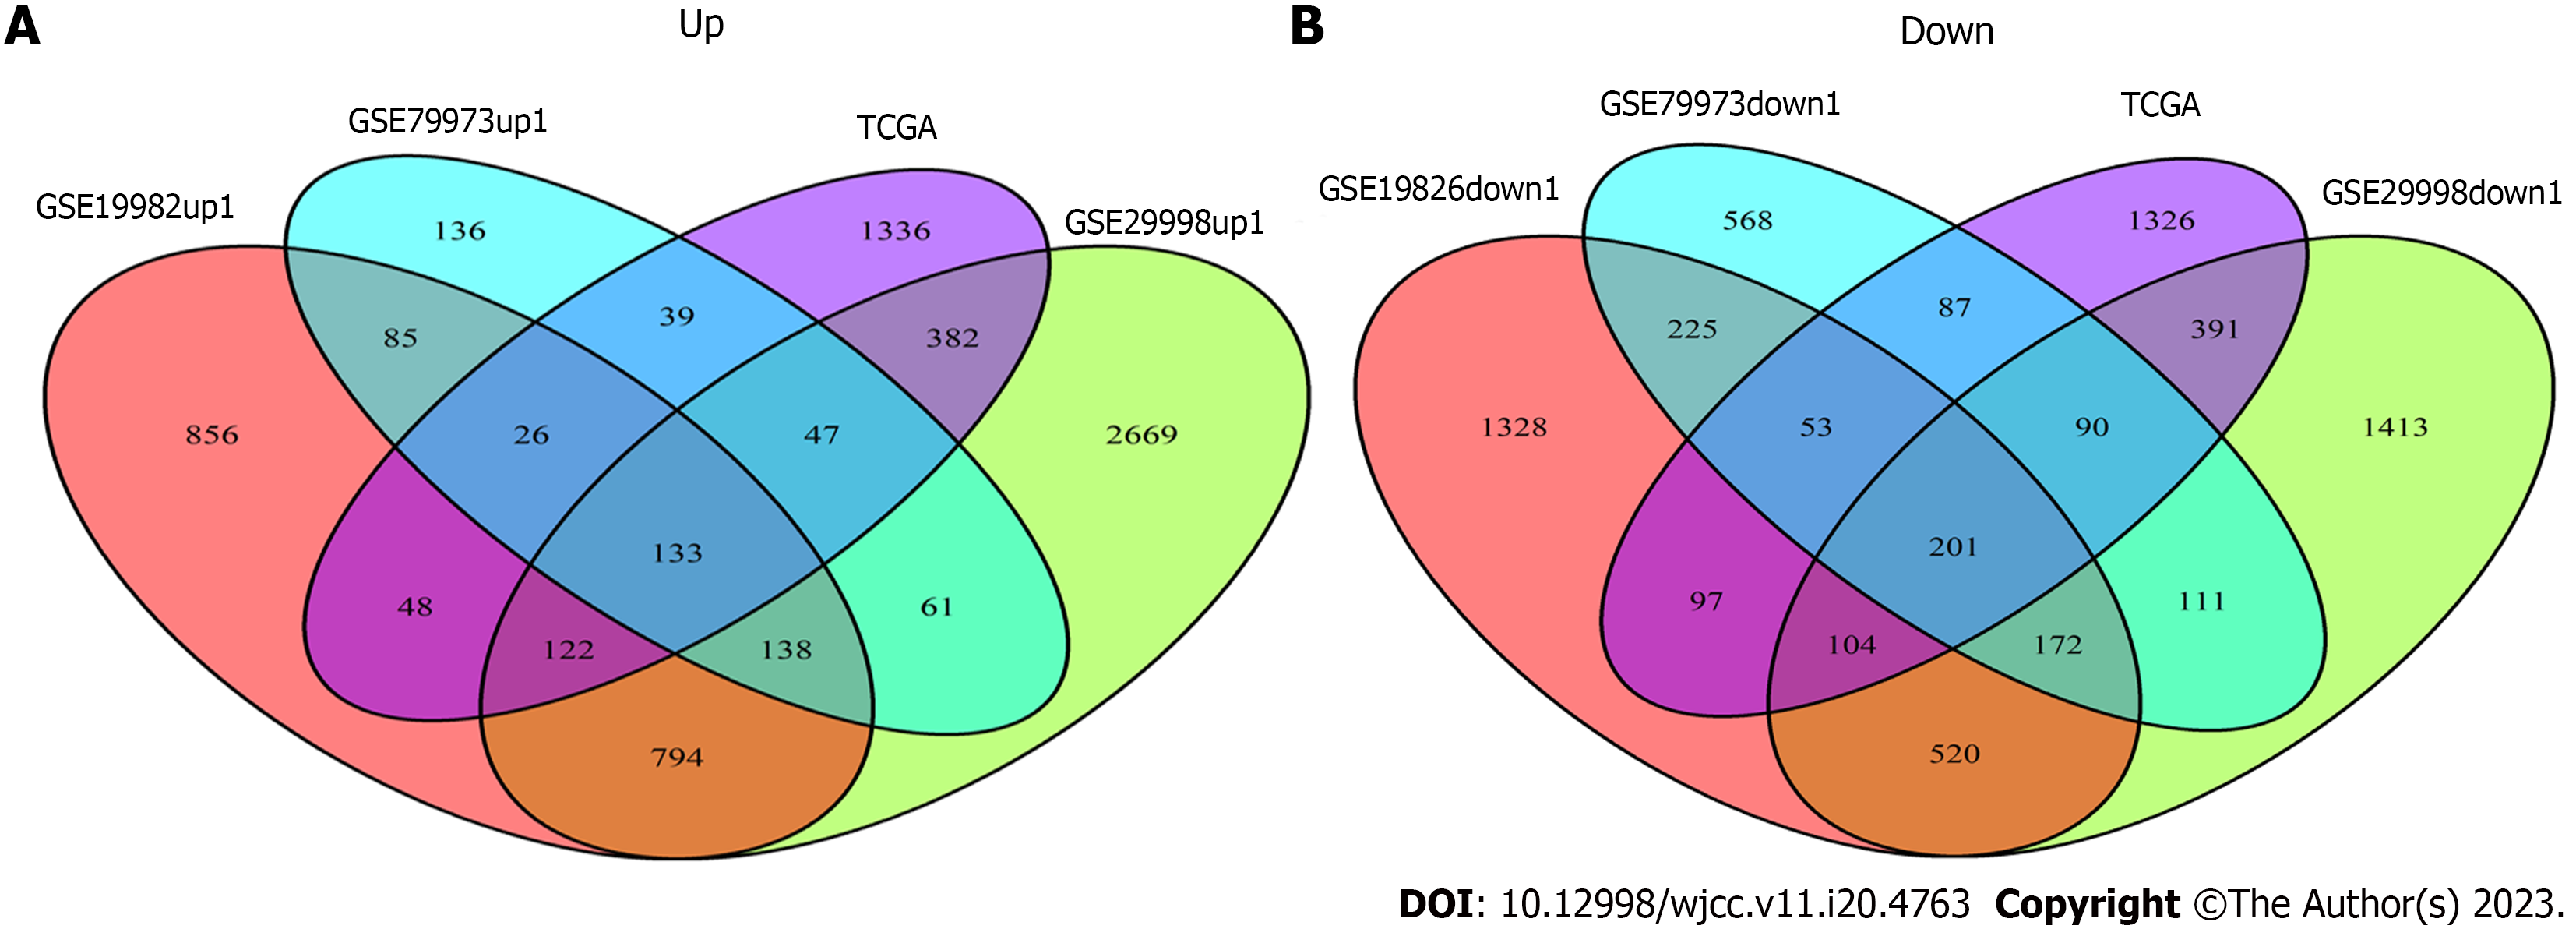
Figure 3 The Venn analysis of differentially expressed genes from Gene Expression Omnibus and The Cancer Genome Atlas datasets.
A: The Venn diagram of GSE19826 (red) 2202 up-regulated genes, GSE79973 (blue) 665 up-regulated genes, GSE29998 (green) 4346 up-regulated genes, The Cancer Genome Atlas (TCGA)-STad (purple) 2133 up-regulated genes, among which 133 genes intersect; B: The Venn diagram of GSE19826 (red) 2700 down-regulated genes, GSE79973 (blue) 1507 down-regulated genes, GSE29998 (green) 3002 down-regulated genes, TCGA-STad (purple) 2349 down-regulated genes, among which 201 genes intersect. TCGA: The Cancer Genome Atlas.
Figure 4 Gene Ontology, Kyoto Encyclopedia of Gene and Genome and Gene Set Enrichment Analysis enrichment analysis of co-expression of differential genes.
A: The histogram of Gene Ontology (GO) analysis; B: The bubble diagram analyzed by GO; C: The network diagram analyzed by GO; D: The clustering diagram of GO analysis; E: The circle graph of GO analysis; F: Kyoto Encyclopedia of Gene and Genome (KEGG) analysis bubble diagram; G: KEGG analysis histogram; H: KEGG analysis cluster graph; I: KEGG analysis circle graph; J: KEGG analysis network diagram; K: Gene Set Enrichment Analysis diagram. GO: Gene Ontology.
Figure 5 The protein-protein interaction analysis of co-expression of differential genes.
A: The protein-protein interaction network diagram of co-expression of differential genes (co-DEGs) constructed by STRING11.5; B: 84 nodes and 654 edges of co-DEGs was revealed by Cytoscape software. aP < 0.05.
Figure 6
The Box diagram of 84 key genes visualized by Gene Expression Profiling Interactive Analysis, showing significant expression difference between the tumor tissues and normal tissues.
Figure 7 The prognosis of 12 key genes associated with gastric cancer screened by Gene Expression Profiling Interactive Analysis survival analysis tool, showing CEP55 was the protective factor (Logrank P < 0.
05, hazard ratio < 1).
Figure 8 The prognosis of 12 genes screened out by Gene Expression Profiling Interactive Analysis survival analysis tool were analyzed and plotted by Kaplan Meier Plotter online network tool, confirming that CEP55 was a protective factor (Logrank P < 0.
05, hazard ratio < 1).
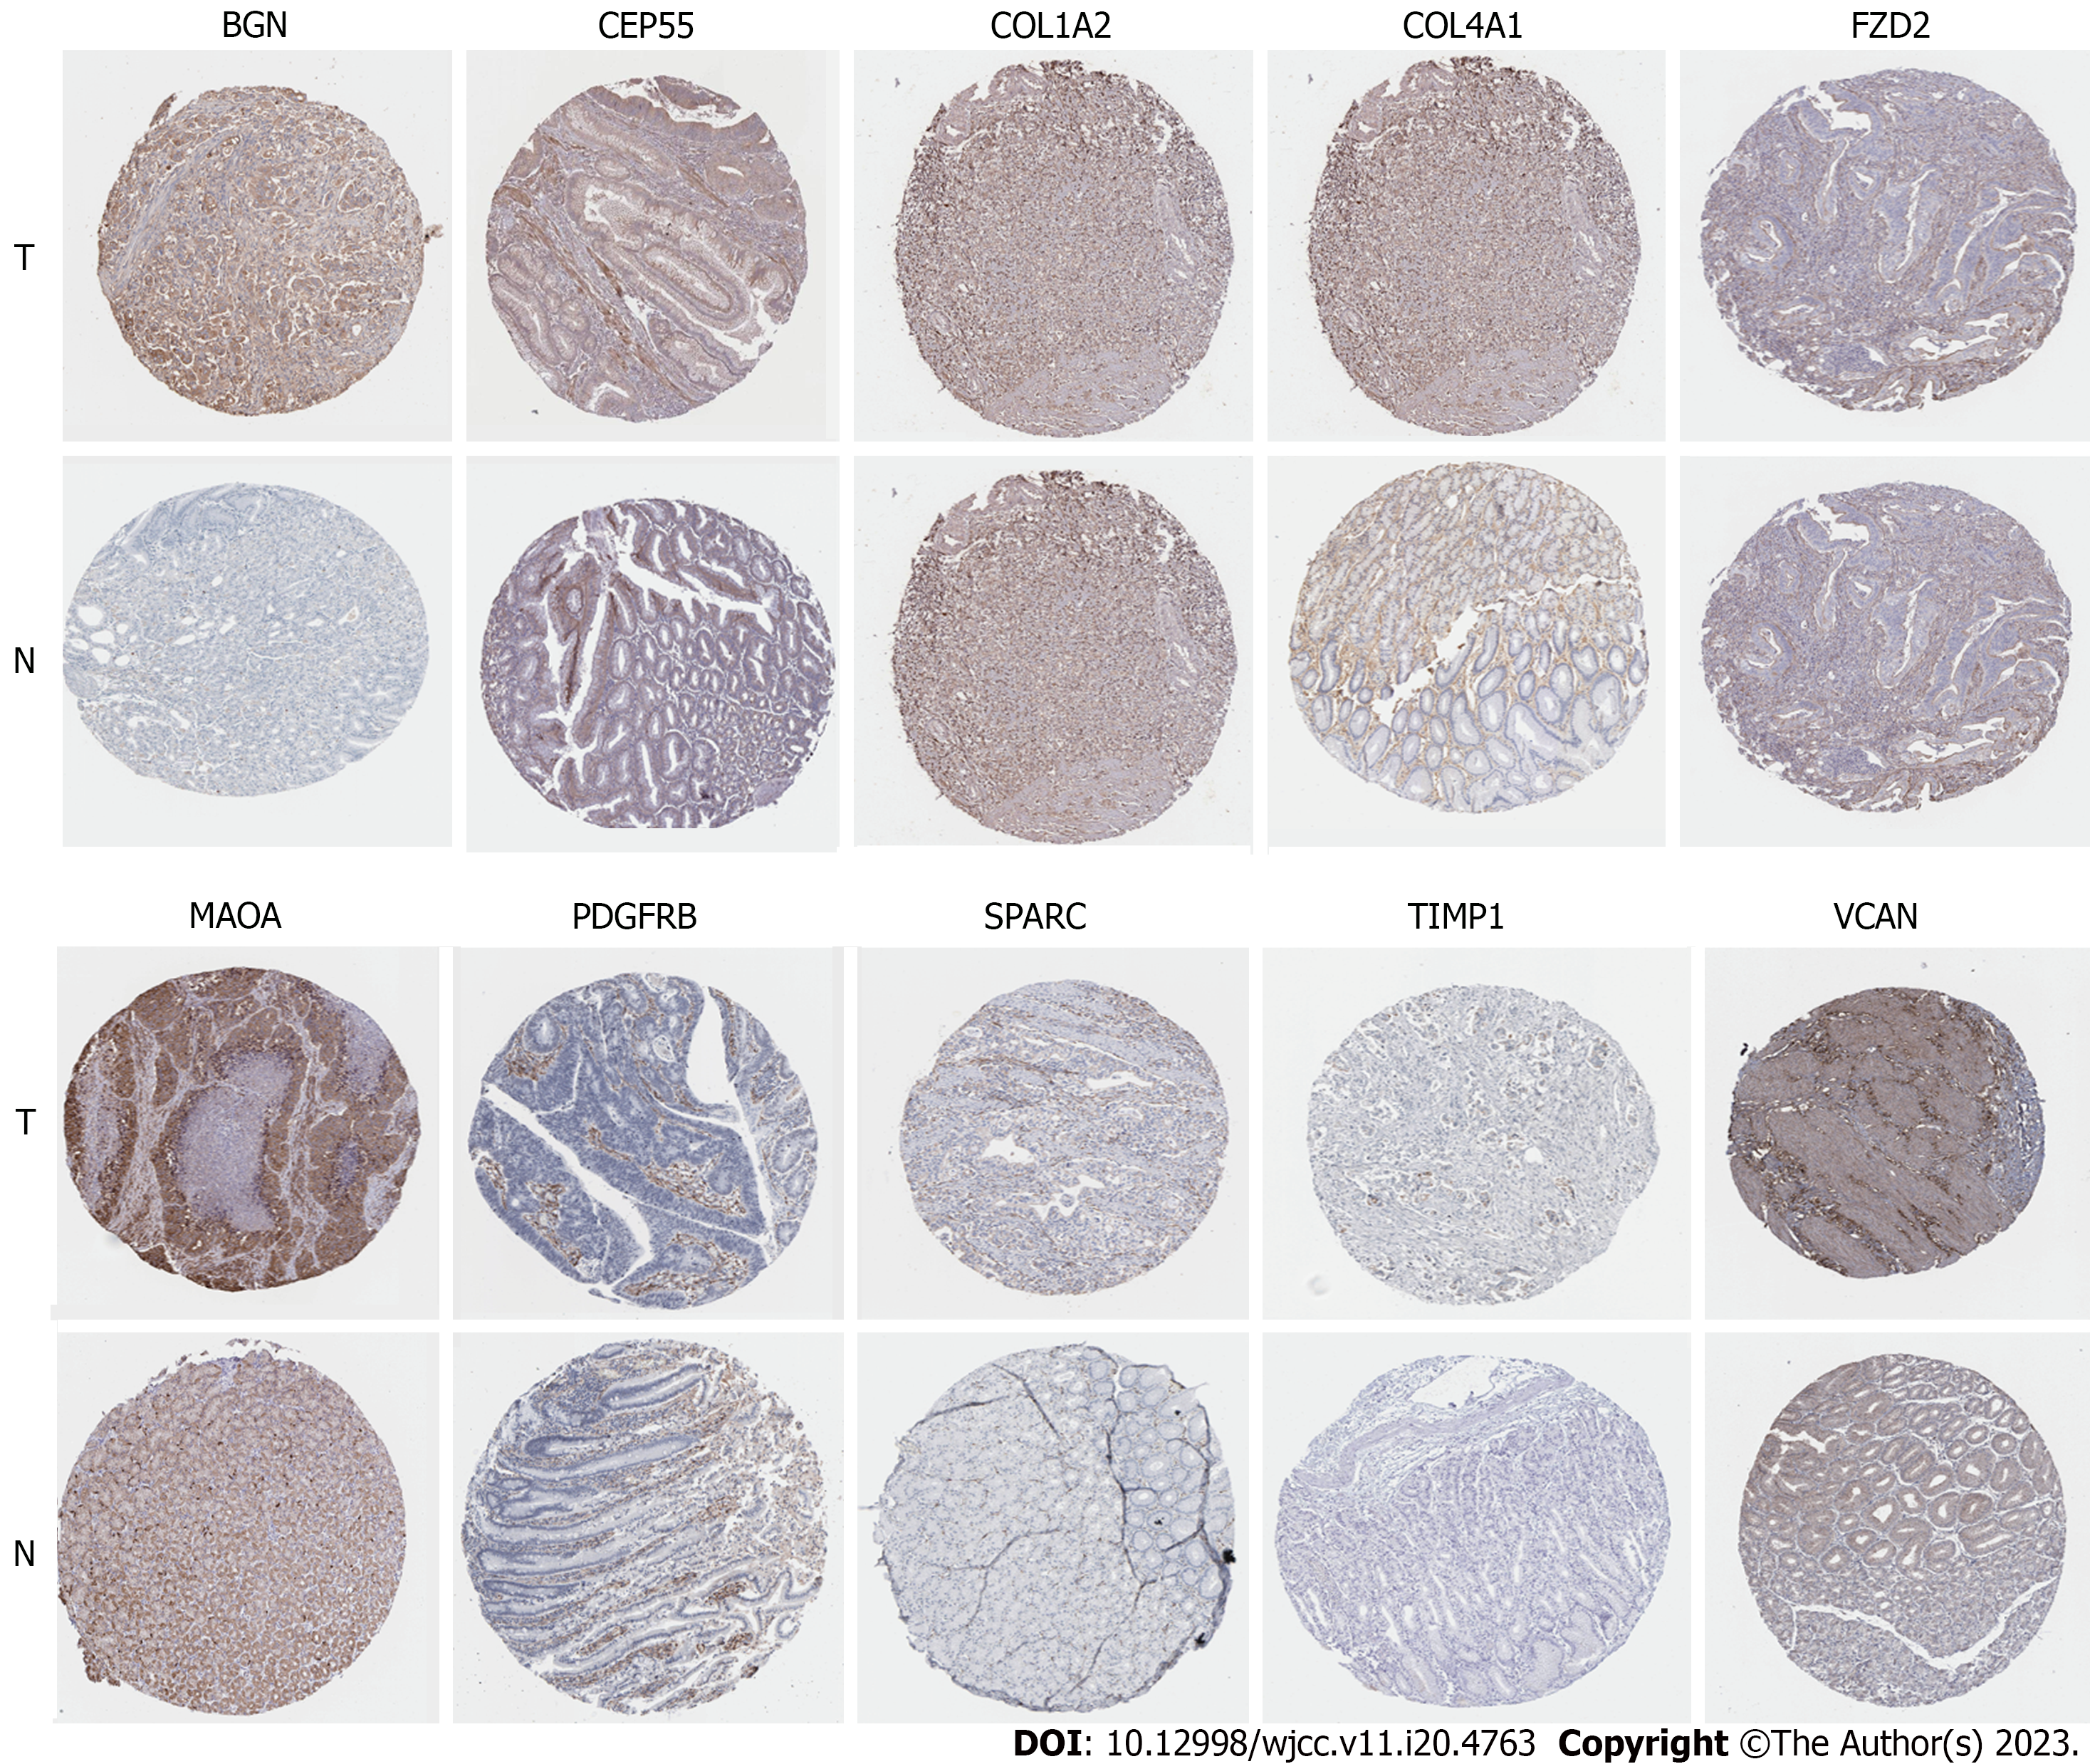
Figure 9 Elevated 10 protein expressions of BGN, CEP55, COL1A2, COL4A1, FZD2, MAOA, PDGFRB, SPARC, TIMP1 and VCAN were screened out from HPA immunohistochemistry database (hematoxylin and eosin × 100).
T: Tumor tissues; N: Normal tissues.
- Citation: Yin LK, Yuan HY, Liu JJ, Xu XL, Wang W, Bai XY, Wang P. Identification of survival-associated biomarkers based on three datasets by bioinformatics analysis in gastric cancer. World J Clin Cases 2023; 11(20): 4763-4787
- URL: https://www.wjgnet.com/2307-8960/full/v11/i20/4763.htm
- DOI: https://dx.doi.org/10.12998/wjcc.v11.i20.4763


