Copyright
©The Author(s) 2023.
World J Clin Cases. Jul 6, 2023; 11(19): 4664-4669
Published online Jul 6, 2023. doi: 10.12998/wjcc.v11.i19.4664
Published online Jul 6, 2023. doi: 10.12998/wjcc.v11.i19.4664
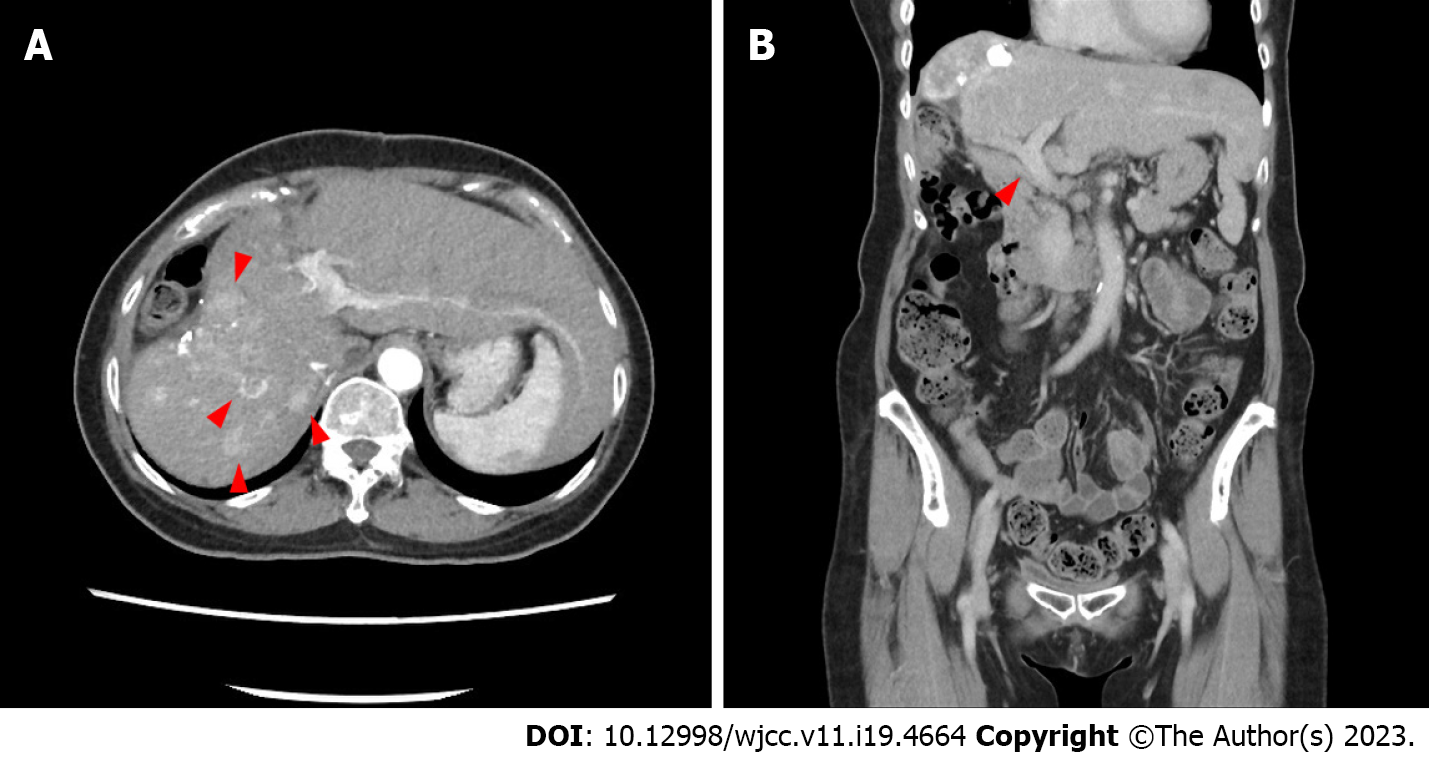
Figure 1 Abdominal computed tomography scans following the second transarterial chemoembolization.
A: Transverse plane showing multiple hepatocellular carcinoma nodules in the right lobe of the liver (red arrows); B: Coronal plane showing an unobstructed portal vein and typical bile ducts (red arrow).
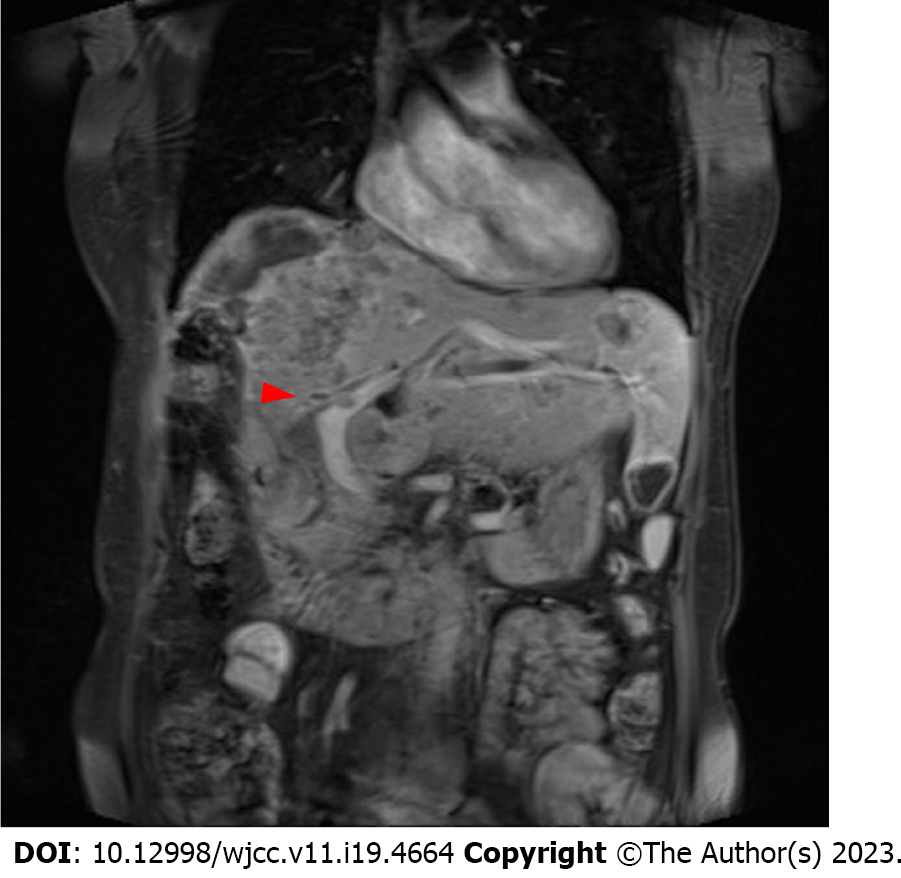
Figure 2
Contrast-enhanced magnetic resonance imaging showed rapid progression of hepatocellular carcinoma volume with involvement of the left intra-hepatic duct and portal vein tumor invasions (red arrow) two weeks after the third transarterial chemoembolization.
- Citation: Yeo KF, Ker A, Kao PE, Wang CC. Hypothetical hypoxia-driven rapid disease progression in hepatocellular carcinoma post transarterial chemoembolization: A case report. World J Clin Cases 2023; 11(19): 4664-4669
- URL: https://www.wjgnet.com/2307-8960/full/v11/i19/4664.htm
- DOI: https://dx.doi.org/10.12998/wjcc.v11.i19.4664


