Copyright
©The Author(s) 2023.
World J Clin Cases. Jul 6, 2023; 11(19): 4612-4624
Published online Jul 6, 2023. doi: 10.12998/wjcc.v11.i19.4612
Published online Jul 6, 2023. doi: 10.12998/wjcc.v11.i19.4612
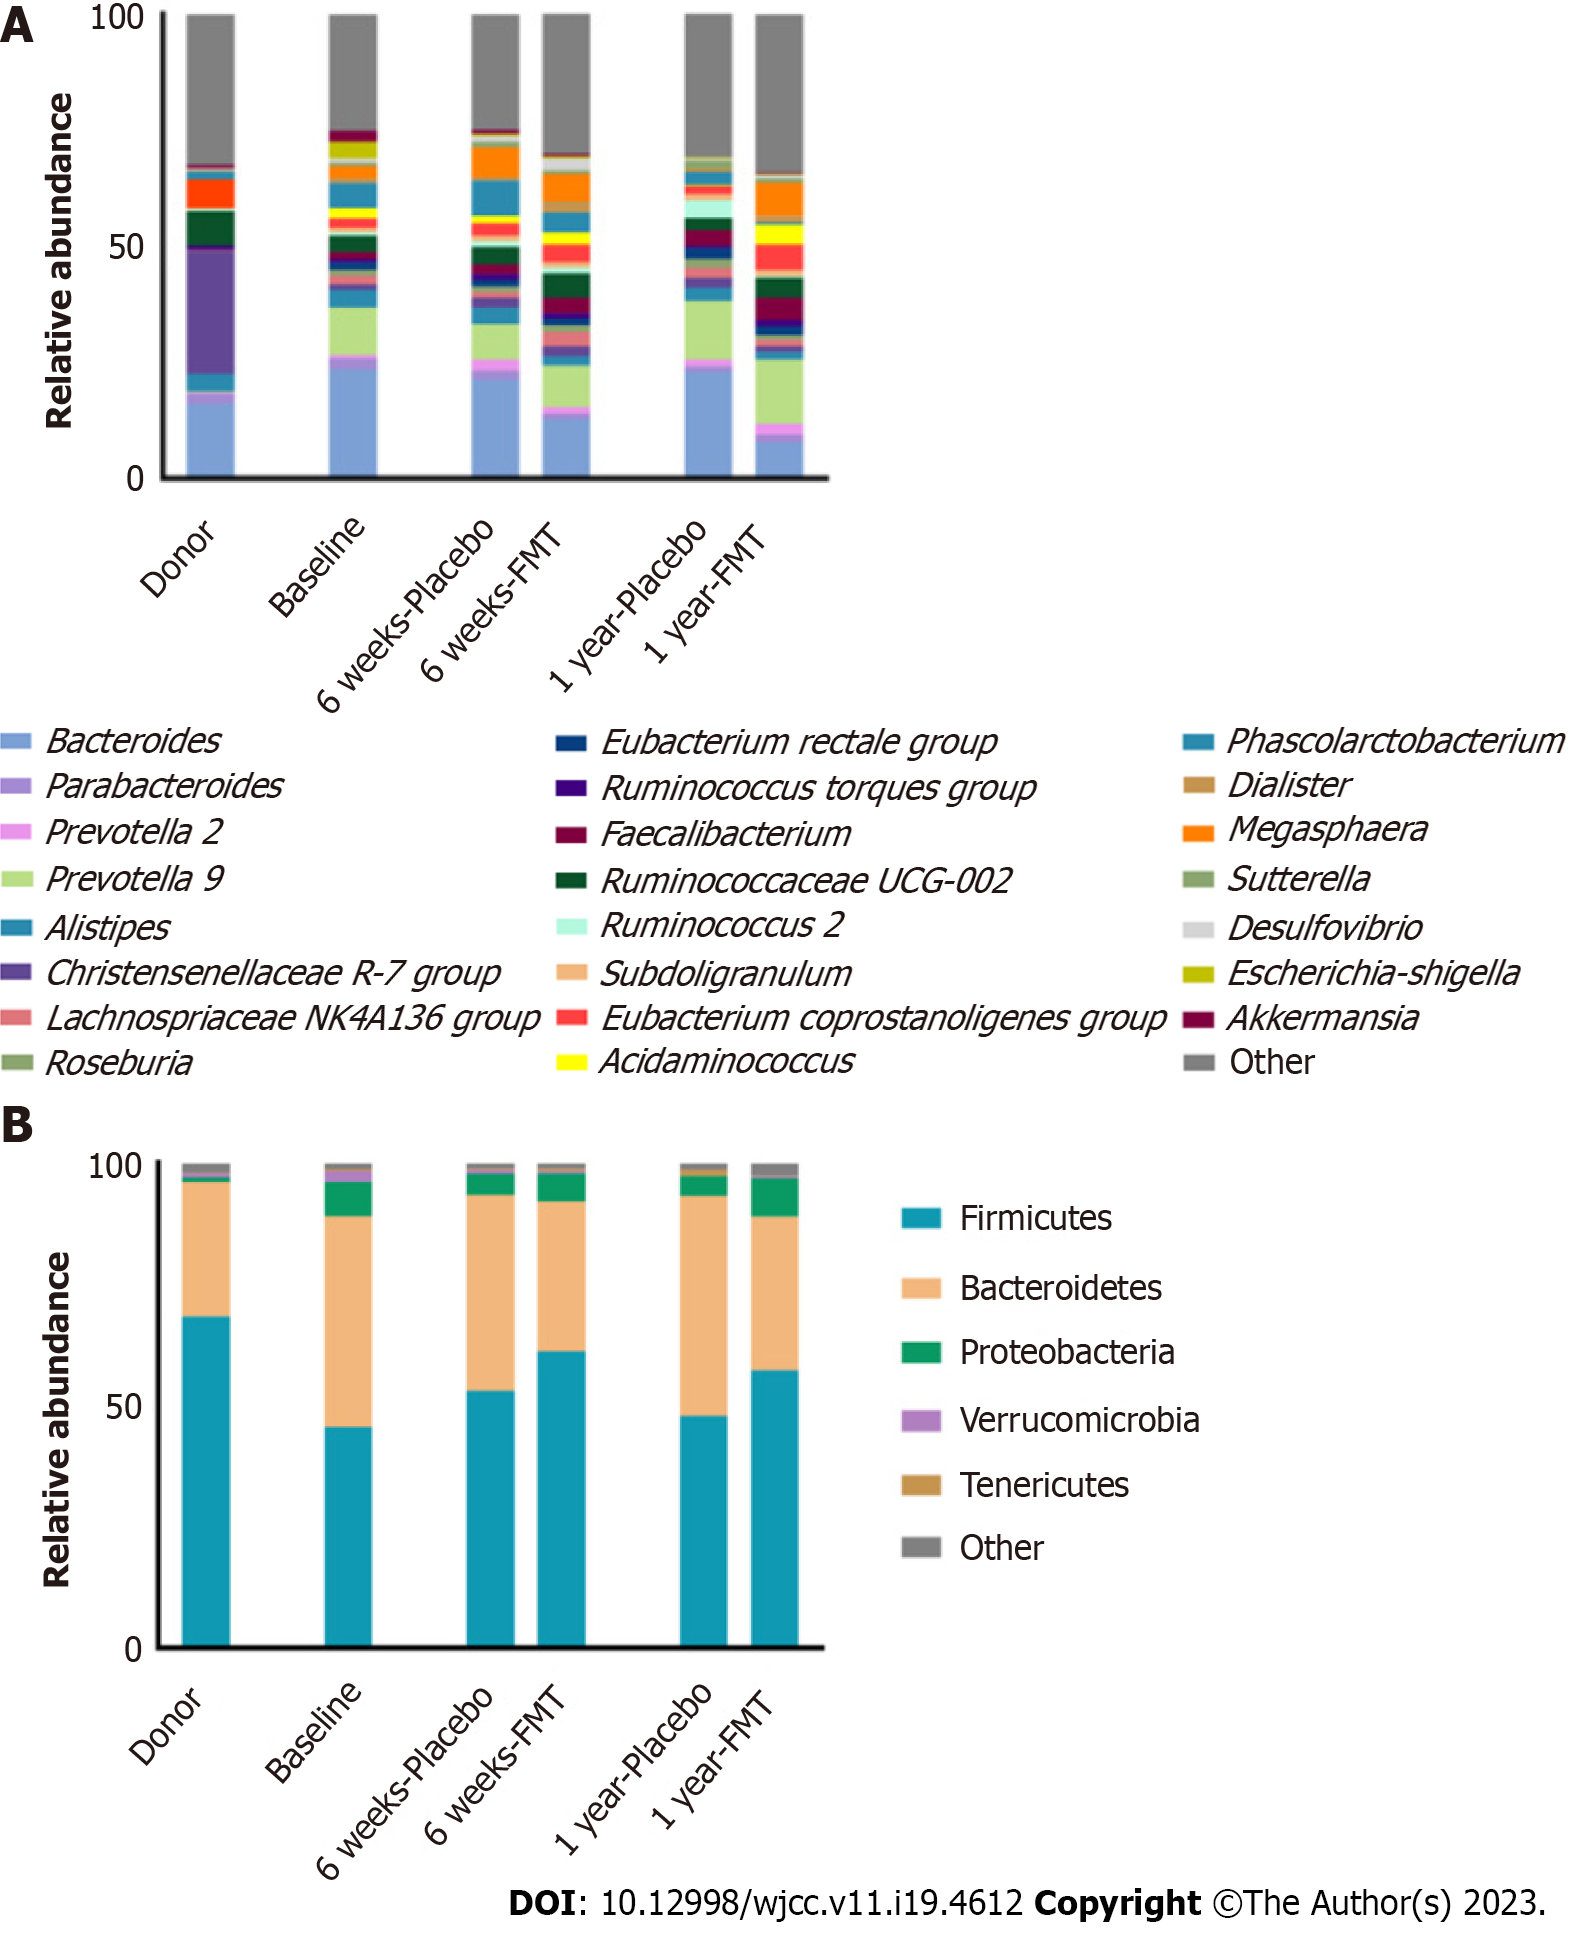
Figure 1 Relative abundance of taxa.
A and B: Show the relative abundance of phyla and of the top 15 genera, respectively, in all samples at baseline, as well as in the placebo and fecal microbiota transplantation groups at 6 wk and 1 year after the procedures. FMT: Fecal microbiota transplantation.
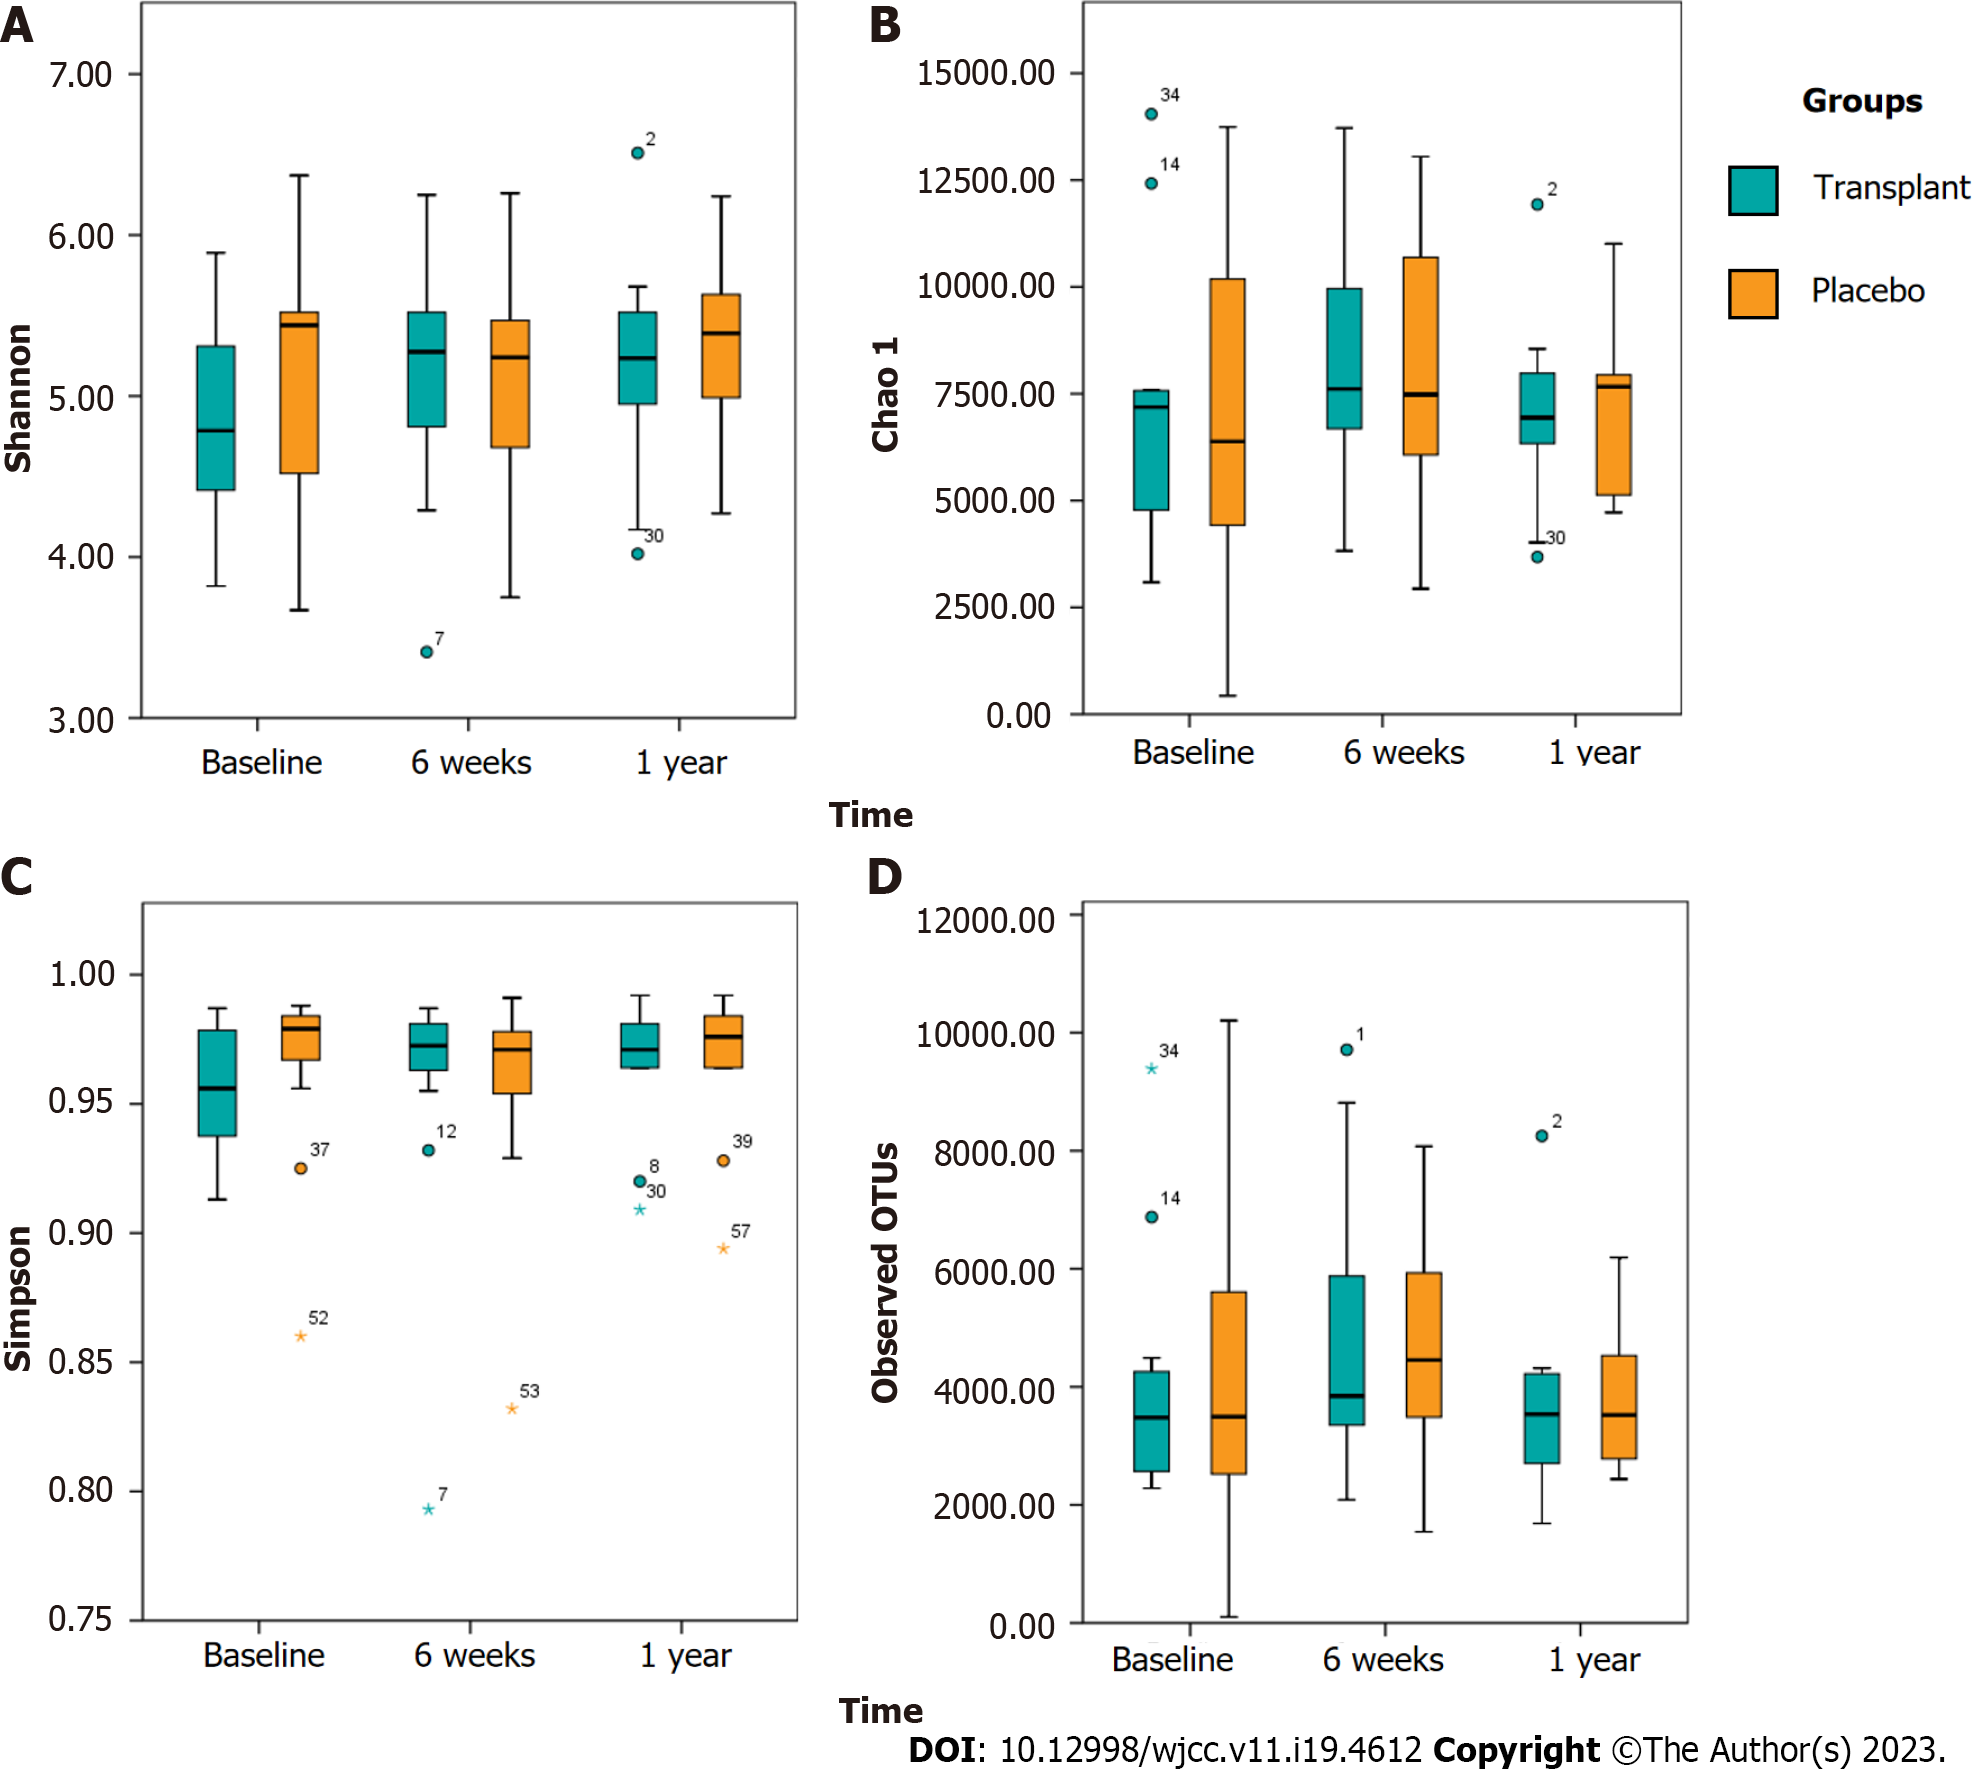
Figure 2 Alpha diversity indices, by group, over time.
A: The Shannon diversity index; B: The Chao1 richness estimate; C: The Simpson diversity index; D: The operational taxonomic units observed, over time, in the placebo and fecal microbiota transplantation groups. FMT: Fecal microbiota transplantation; OTUs: Operational taxonomic units.
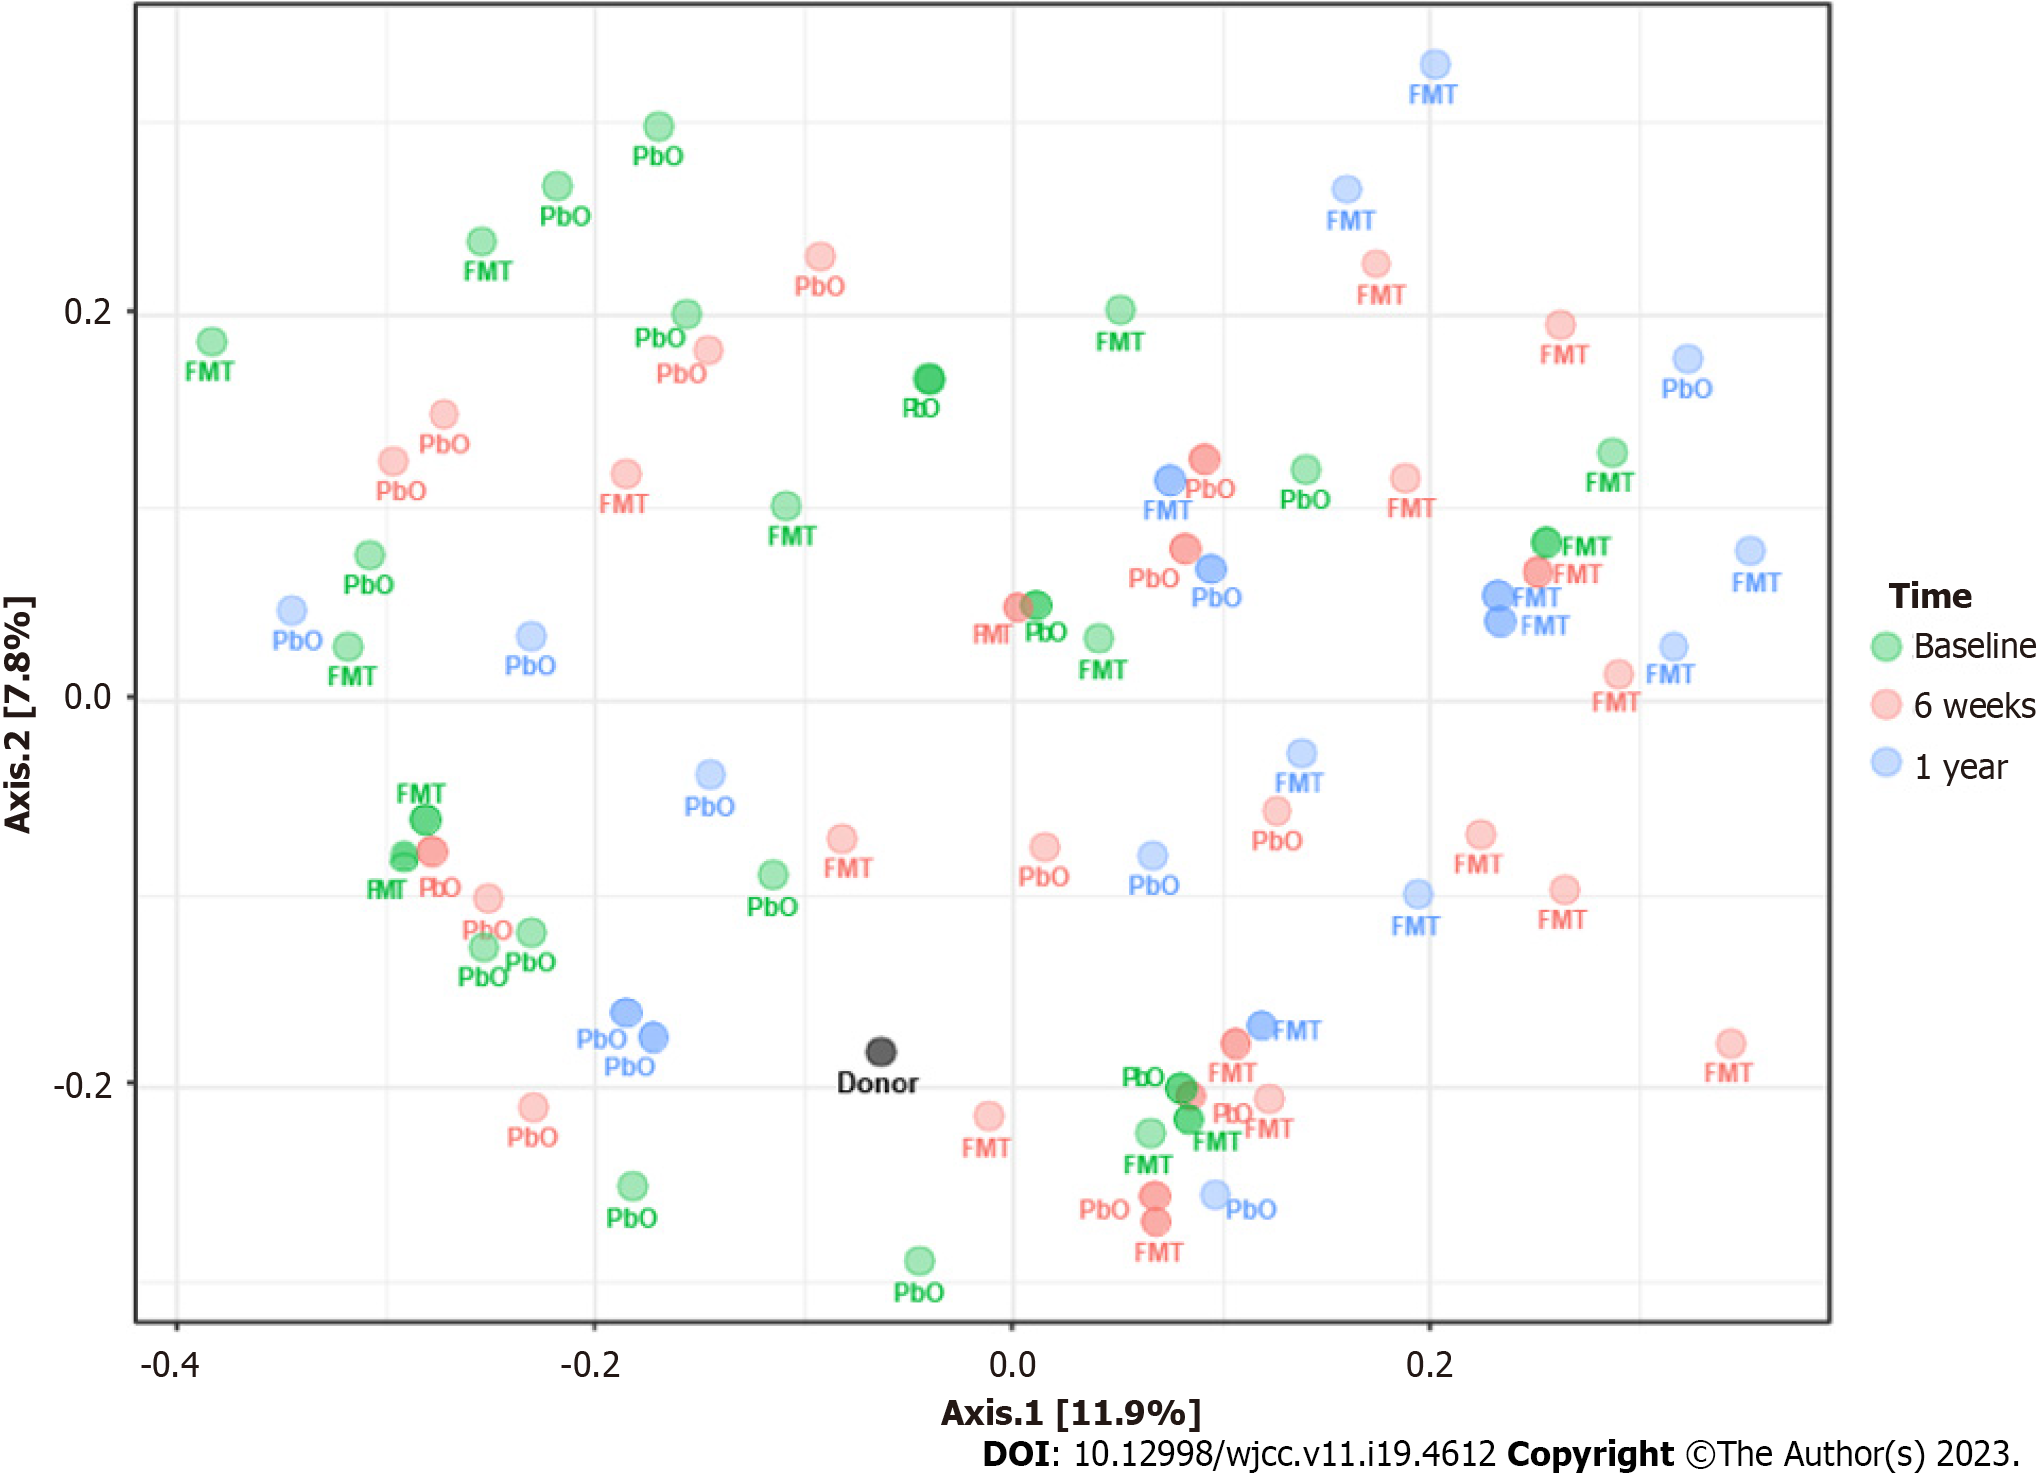
Figure 3 Beta diversity over time.
PbO: Placebo; FMT: Fecal microbiota transplantation.
- Citation: da Ponte Neto AM, Clemente ACO, Rosa PW, Ribeiro IB, Funari MP, Nunes GC, Moreira L, Sparvoli LG, Cortez R, Taddei CR, Mancini MC, de Moura EGH. Fecal microbiota transplantation in patients with metabolic syndrome and obesity: A randomized controlled trial. World J Clin Cases 2023; 11(19): 4612-4624
- URL: https://www.wjgnet.com/2307-8960/full/v11/i19/4612.htm
- DOI: https://dx.doi.org/10.12998/wjcc.v11.i19.4612


