Copyright
©The Author(s) 2023.
World J Clin Cases. Jun 16, 2023; 11(17): 3993-4002
Published online Jun 16, 2023. doi: 10.12998/wjcc.v11.i17.3993
Published online Jun 16, 2023. doi: 10.12998/wjcc.v11.i17.3993
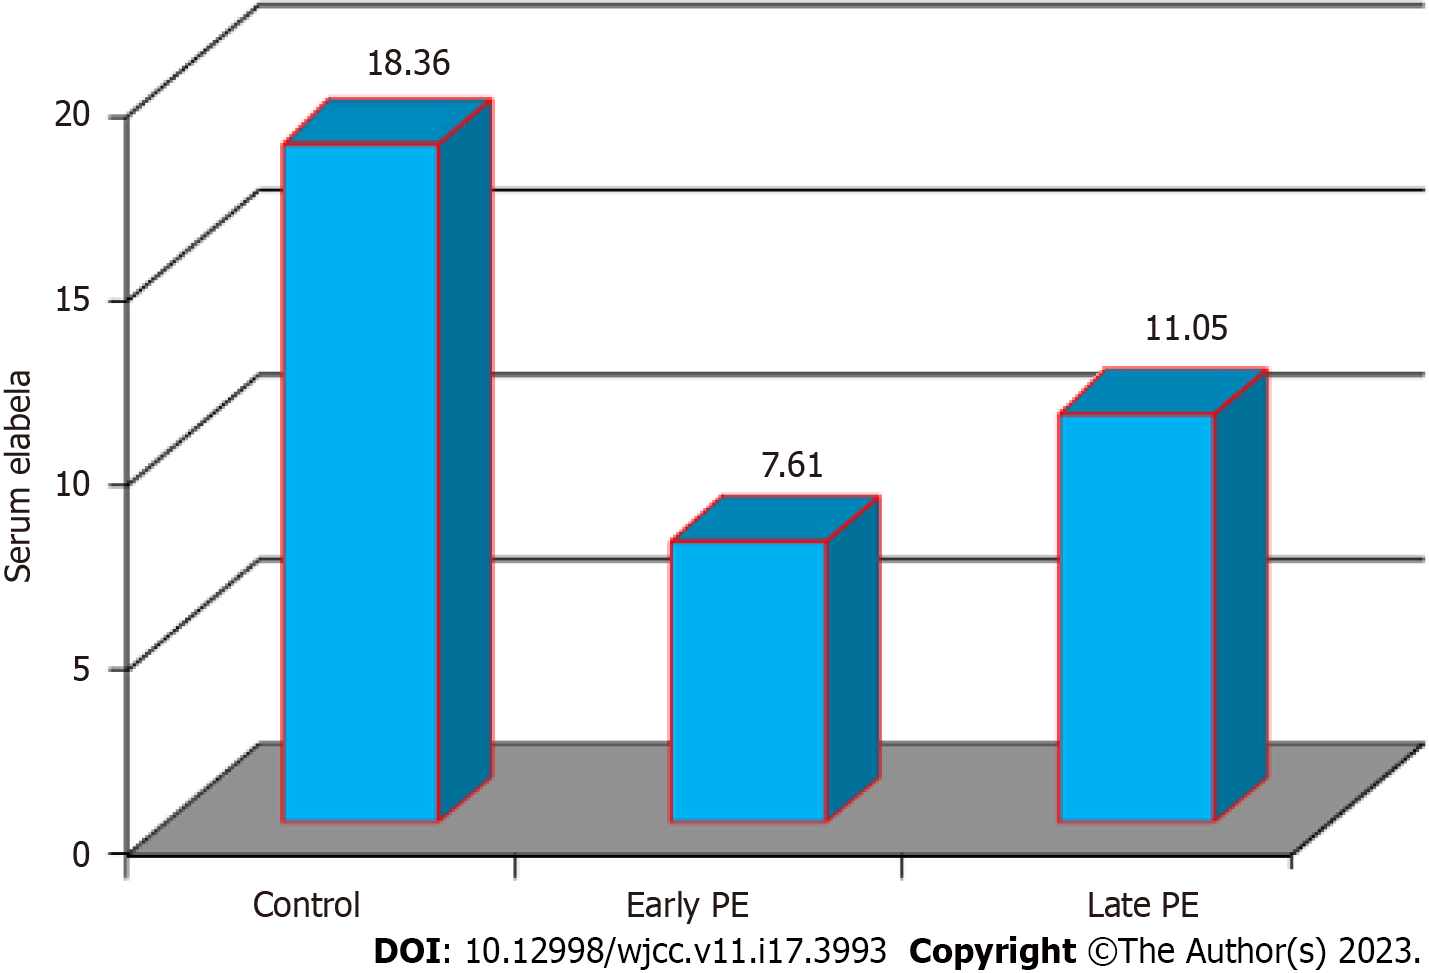
Figure 1 Showing serum elabela across the study participants.
PE: Preeclampsia.
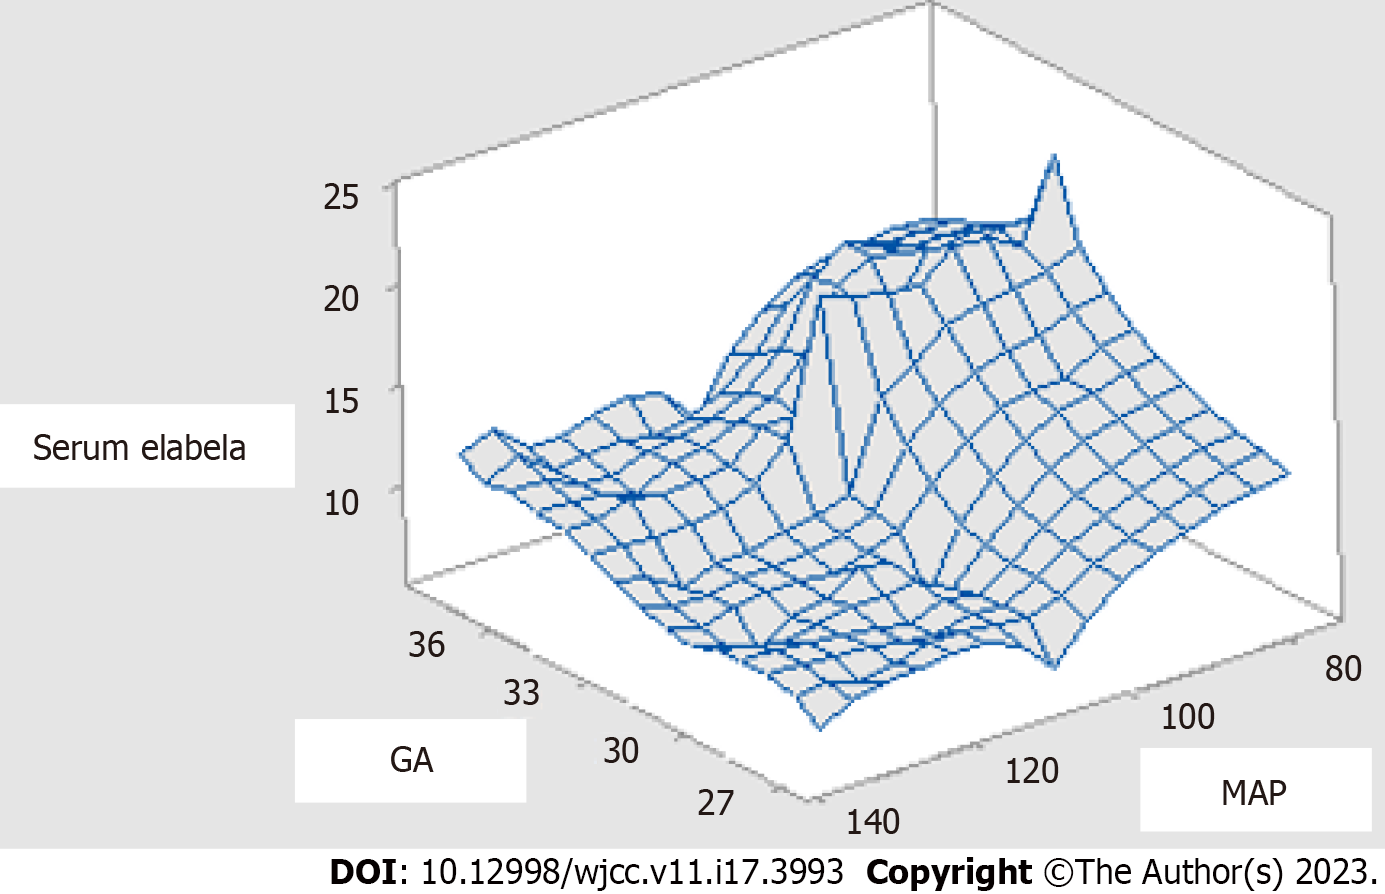
Figure 2 A three-dimensional figures showing the inverse correlation relationship between serum elabela with mean arterial blood pressure and the positive correlation with gestational age.
It can be noted seen that the lowest serum elabela is seen at 27-33 wk; early onset preeclampsia. GA: Gestational age; MAP: Mean arterial blood pressure.
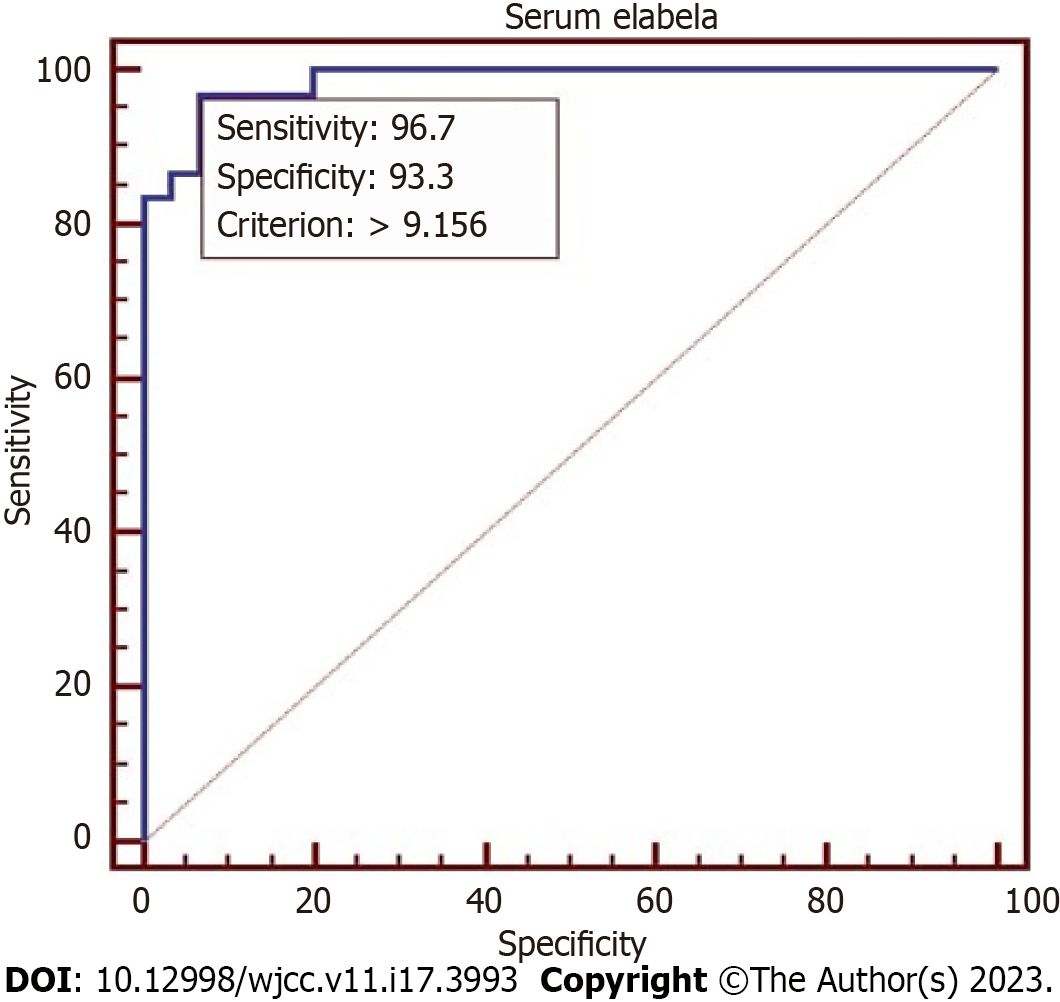
Figure 3 The receiver operator characteristic curve for serum elabela as a diagnostic marker in early vs late pre-eclampsia cases.
Area under the curve = 0.986, P < 0.0001.
- Citation: Amer Ali E, Nori W, Salman AF, Al-Rawi TSS, Hameed BH, Al-Ani RM. Elabela is a reliable biomarker for predicting early onset preeclampsia: A comparative study. World J Clin Cases 2023; 11(17): 3993-4002
- URL: https://www.wjgnet.com/2307-8960/full/v11/i17/3993.htm
- DOI: https://dx.doi.org/10.12998/wjcc.v11.i17.3993


