Copyright
©The Author(s) 2023.
World J Clin Cases. May 26, 2023; 11(15): 3583-3591
Published online May 26, 2023. doi: 10.12998/wjcc.v11.i15.3583
Published online May 26, 2023. doi: 10.12998/wjcc.v11.i15.3583
Figure 1 Preoperative lumbar computed tomography.
A and B: Uneven density of L2-3 vertebral bodies, local bone defects at opposite margin, mass-like soft tissue density shadow around, left psoas enlargement with uneven density, and infection is suspected (arrows); C: Local bone destruction of anterior and middle L2-3 vertebral bodies, and uneven density around (arrow).
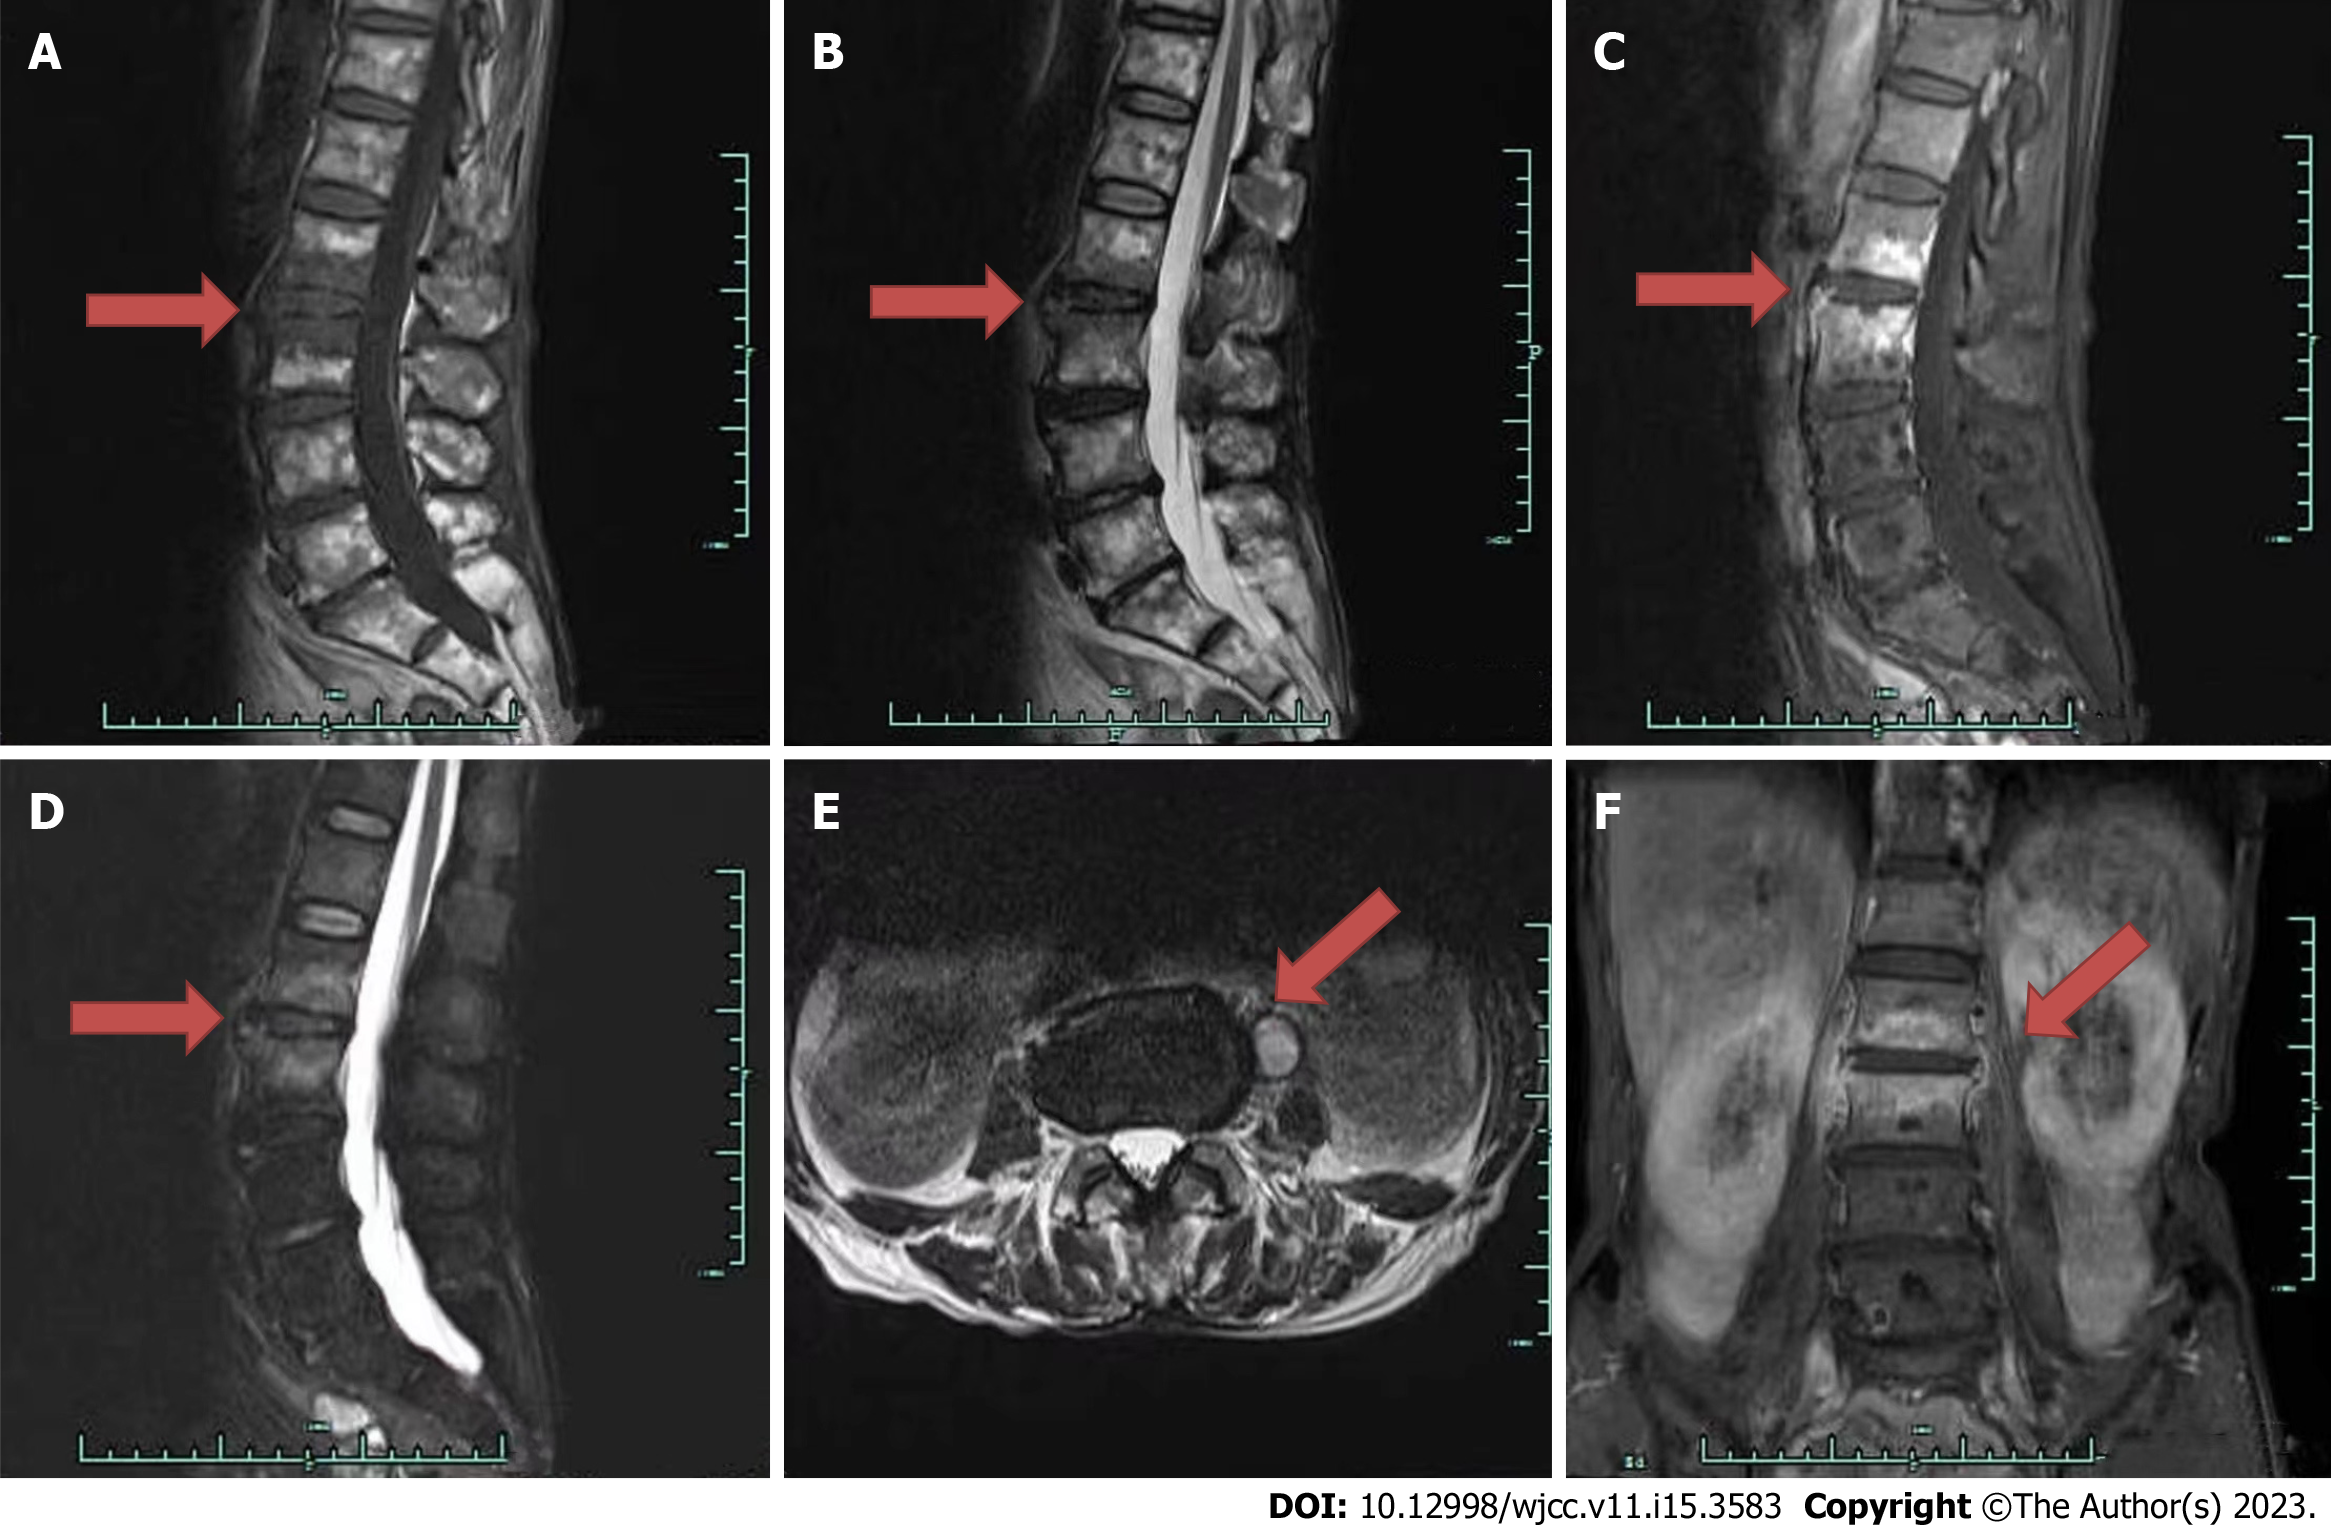
Figure 2 Preoperative lumbar magnetic resonance imaging plain and enhanced scans.
A and B: The vertebral signal changes, with no evident changes observed in the intervertebral disc (arrows). T1 and T2 weighted images show patchy hypo-intense signal in the L2-L3 vertebral bodies; C and D: Images with fat suppression show that the cortical bone of spine is incomplete, hyper-intense signals are seen in the L2-3 vertebral bodies, and no obvious enhancement is seen after enhanced scan (arrows); E: Long T1 and T2 signal shadows in the left psoas major muscle, and annular enhancement is seen from enhanced scan, suspected of abscess formation (arrow); F: Coronal patchy changes in the L2-3 vertebral bodies (arrow).
- Citation: Zou LC, Qian J, Bian ZY, Wang XP, Xie T. Pyogenic spondylitis caused by Escherichia coli: A case report and literature review. World J Clin Cases 2023; 11(15): 3583-3591
- URL: https://www.wjgnet.com/2307-8960/full/v11/i15/3583.htm
- DOI: https://dx.doi.org/10.12998/wjcc.v11.i15.3583


