Copyright
©The Author(s) 2023.
World J Clin Cases. Apr 26, 2023; 11(12): 2825-2831
Published online Apr 26, 2023. doi: 10.12998/wjcc.v11.i12.2825
Published online Apr 26, 2023. doi: 10.12998/wjcc.v11.i12.2825
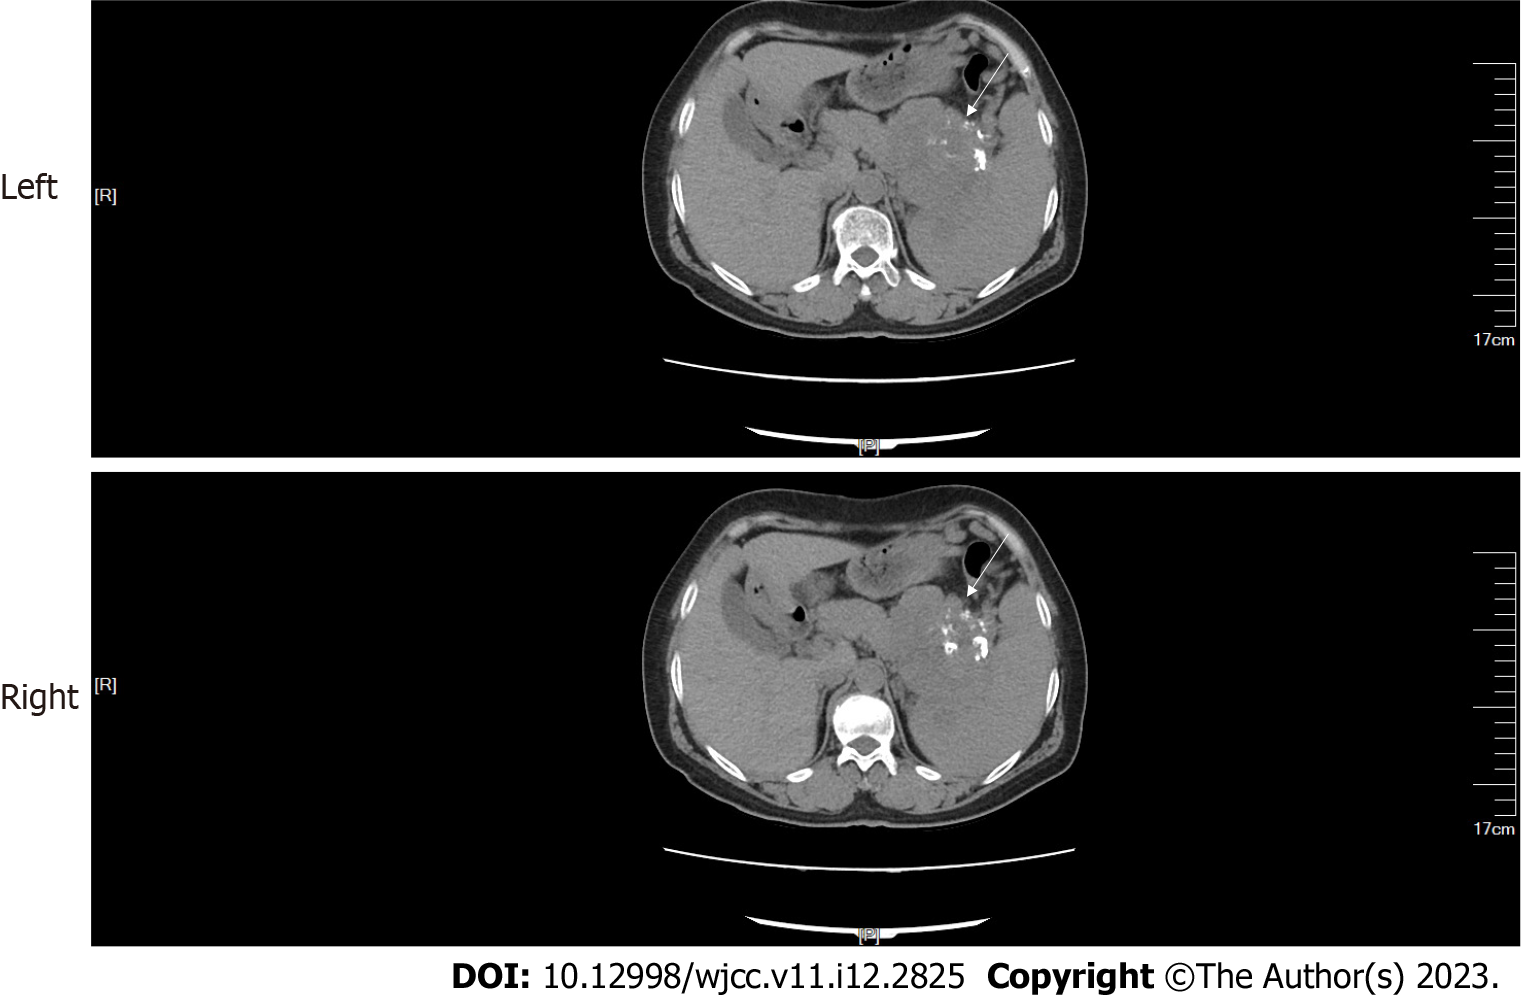
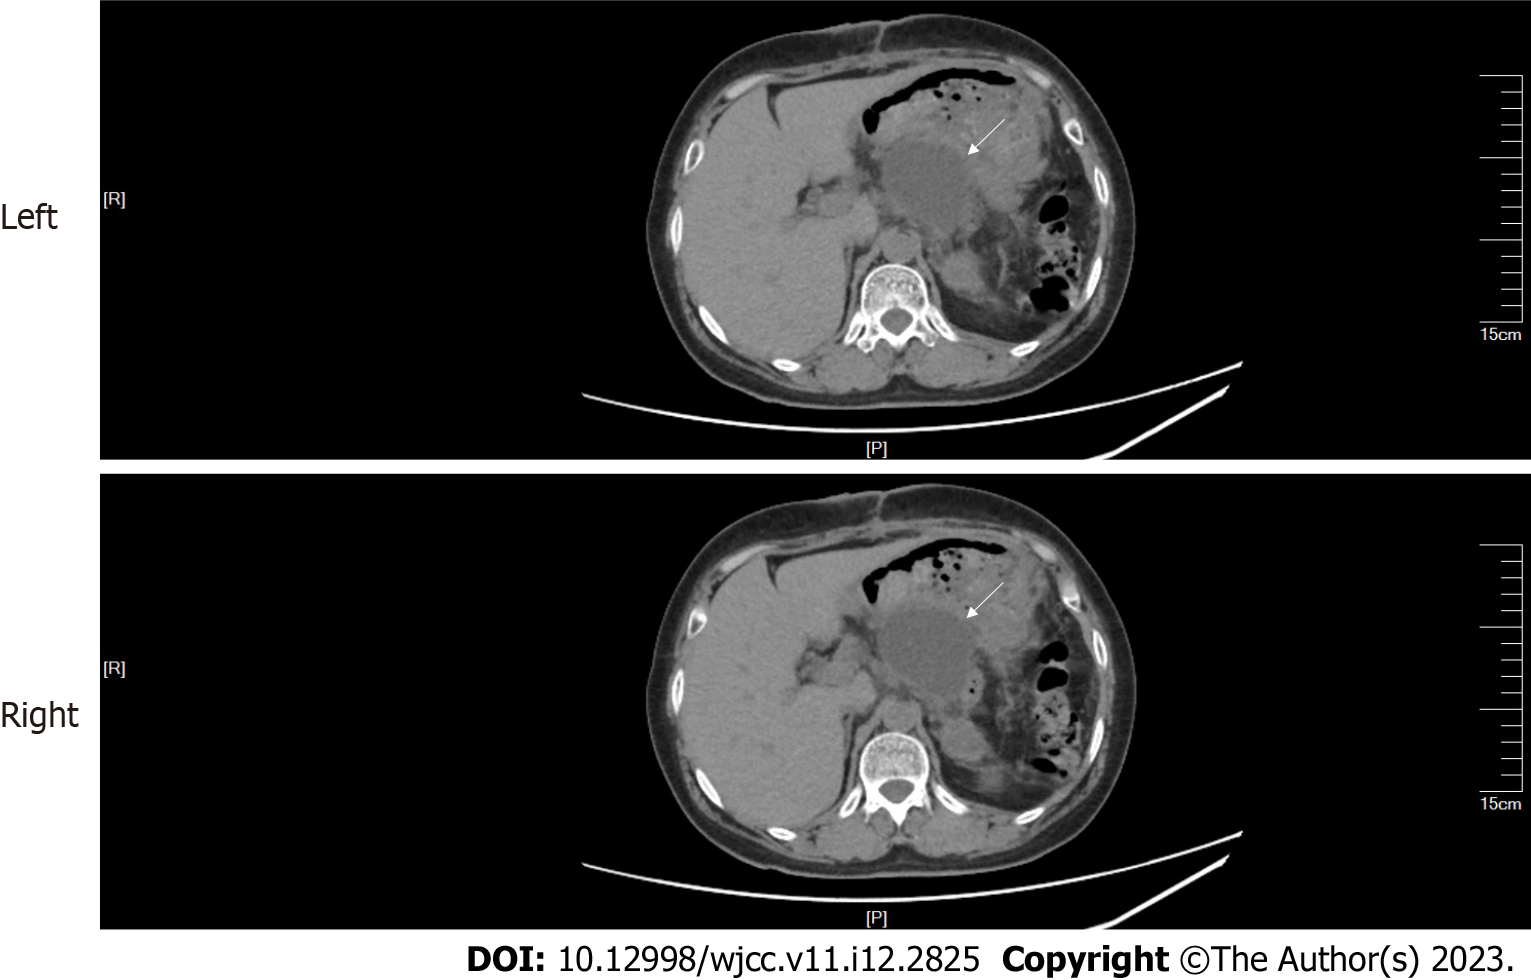
Figure 1 Abdominal computed tomography.
A mass (arrow) with multiple calcifications between the pancreas and the spleen was observed. The boundary between the mass and the pancreas and spleen was poorly defined.
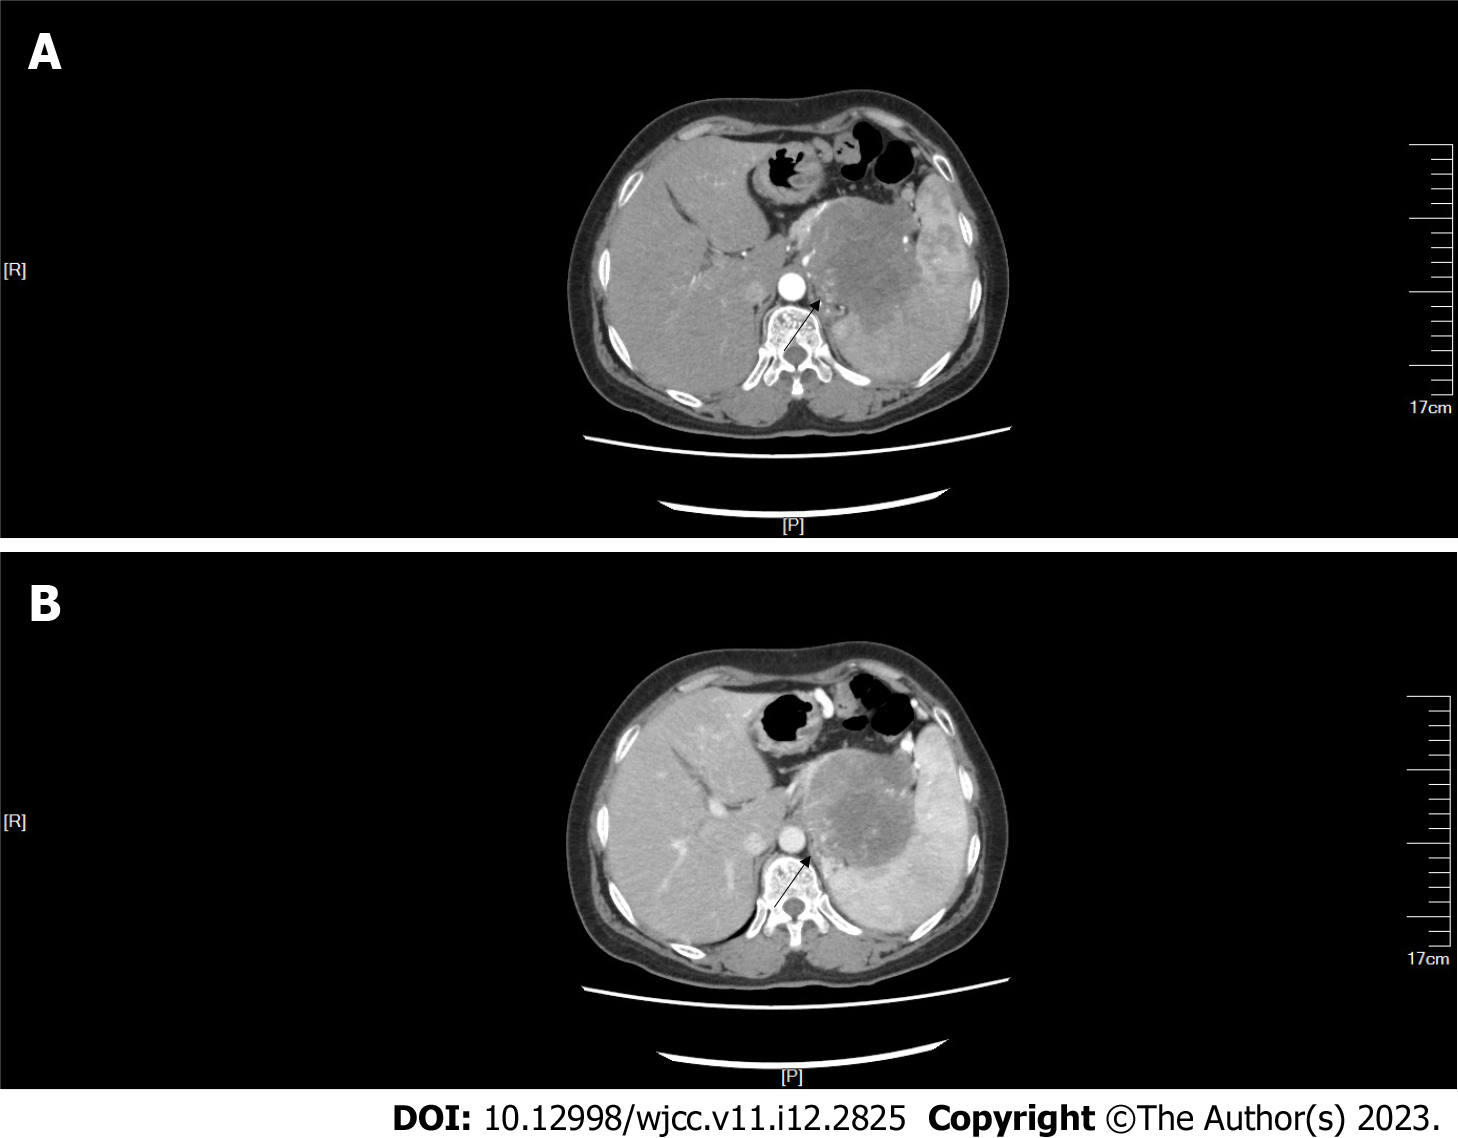
Figure 2 Abdominal computed tomography with contrast showed that the upper abdominal mass was unevenly and gradually enhanced (arrow).
A: Arterial time; B: Venous time.
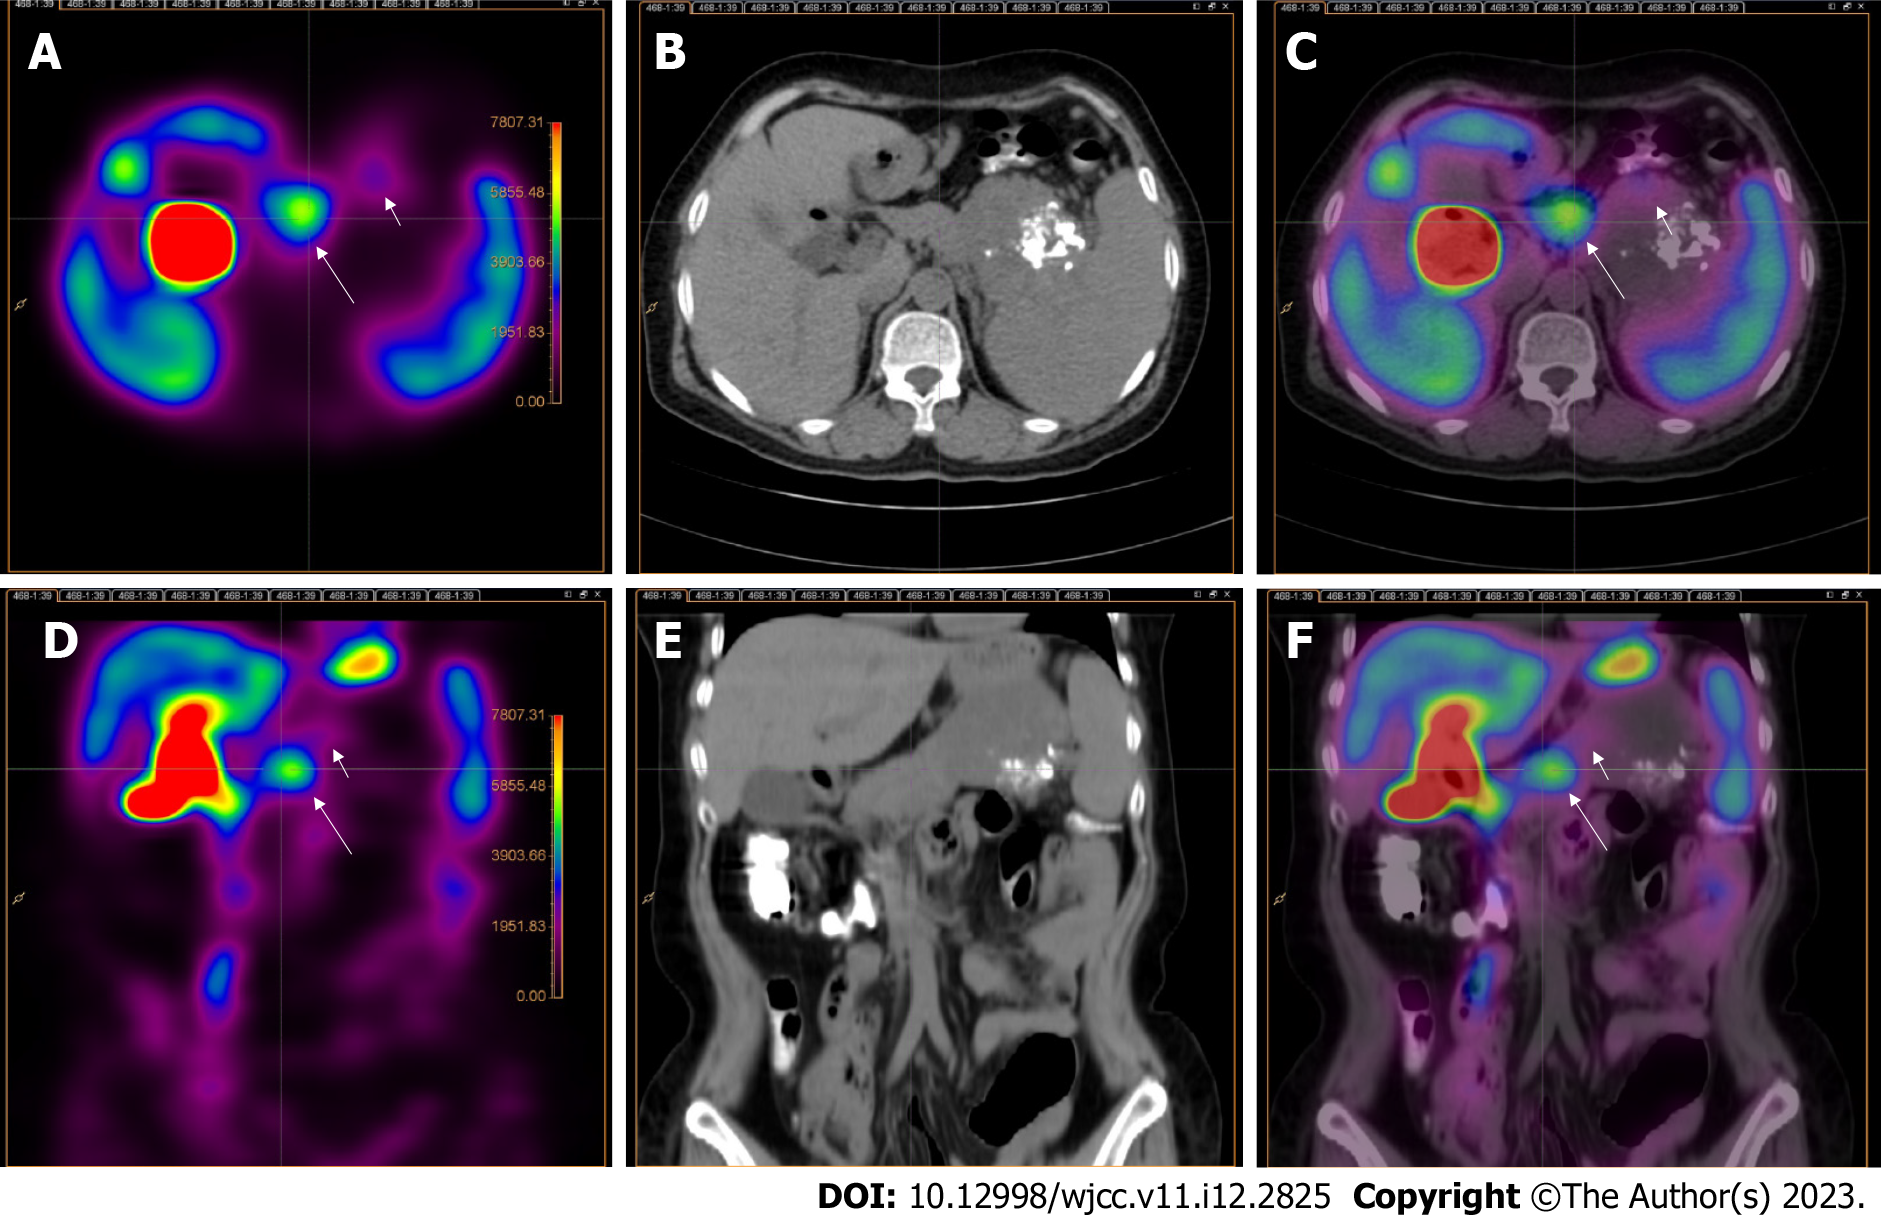
Figure 3 Abdominal technetium-99m methoxy-2-isobutylisonitrile single photon emission computed tomography/computed tomography.
Technetium-99m methoxy-2-isobutylisonitrile single photon emission computed tomography (SPECT)/CT of the abdomen showed that a focal radioactive concentration (long arrow) with mild radioactive concentration (short arrow) was present on SPECT (A, D) and technetium-99m methoxy-2-isobutylisonitrile SPECT/CT fusion images (C, F) at the sites corresponding to the pancreatic body and tail and the upper abdominal mass discovered by CT (B, E). A-C: Transverse axis; D-F: Coronal axis.
Figure 4 Hematoxylin and eosin staining.
A: The pathology of the focal radioactive concentration of the pancreatic body and tail shown on technetium-99m methoxy-2-isobutylisonitrile single photon emission computed tomography (CT)/CT indicated a well-differentiated pancreatic neuroendocrine tumor via hematoxylin and eosin staining (× 200); B: The pathology of the upper abdominal mass shown on CT indicated a well-differentiated pancreatic neuroendocrine tumor via hematoxylin and eosin staining (× 200); C: Normal spleen cells observed after hematoxylin and eosin stain (× 100).
Figure 5 Immunohistochemical staining of tumor cells.
A: Positive for insulinoma-associated protein 1; B: Positive for synaptophysin; C: Positive for cluster of differentiation 56 (× 200).
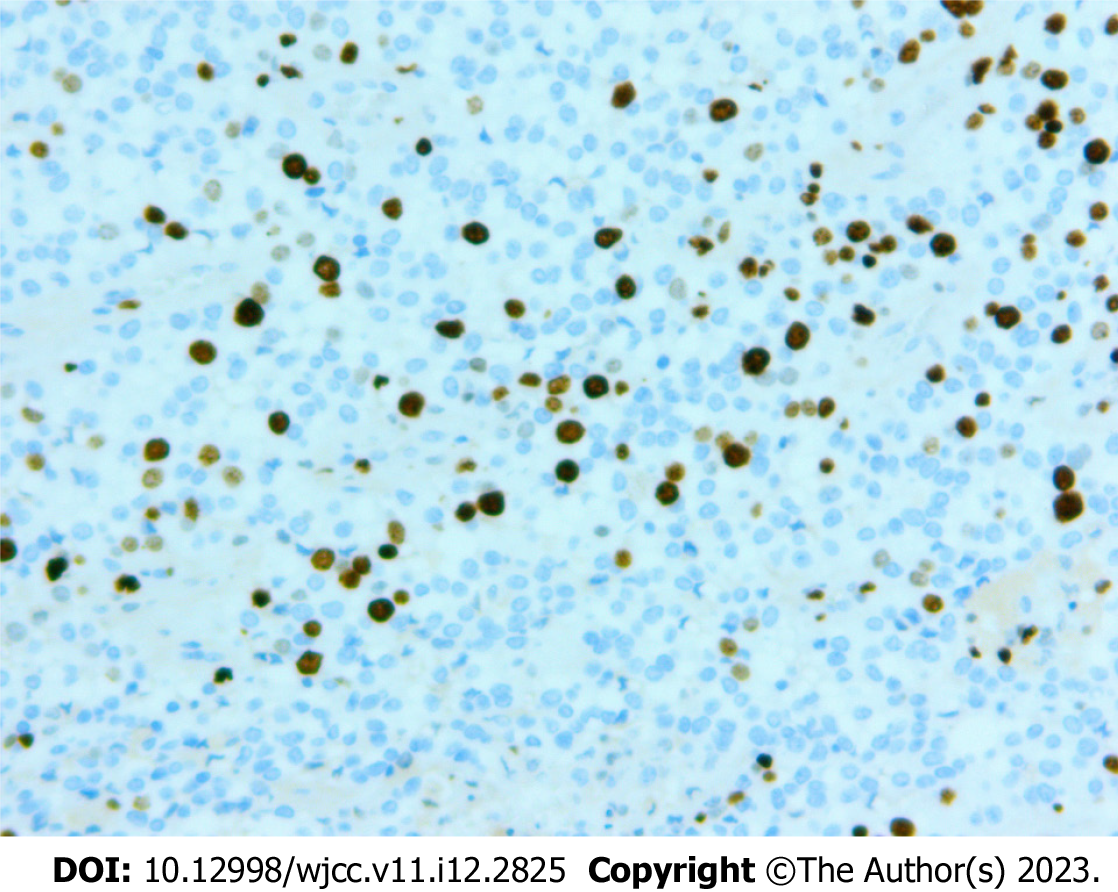
Figure 6 Immunohistochemical staining (EnVision technique) showed Ki-67 (marker of proliferation Ki-67) proliferative index of 10% (× 400).
Figure 7 Encapsulated effusion (arrow) in the surgical area.
- Citation: Liu CJ, Yang HJ, Peng YC, Huang DY. Pancreatic neuroendocrine tumor detected by technetium-99m methoxy-2-isobutylisonitrile single photon emission computed tomography/computed tomography: A case report. World J Clin Cases 2023; 11(12): 2825-2831
- URL: https://www.wjgnet.com/2307-8960/full/v11/i12/2825.htm
- DOI: https://dx.doi.org/10.12998/wjcc.v11.i12.2825


