Copyright
©The Author(s) 2023.
World J Clin Cases. Apr 26, 2023; 11(12): 2811-2816
Published online Apr 26, 2023. doi: 10.12998/wjcc.v11.i12.2811
Published online Apr 26, 2023. doi: 10.12998/wjcc.v11.i12.2811
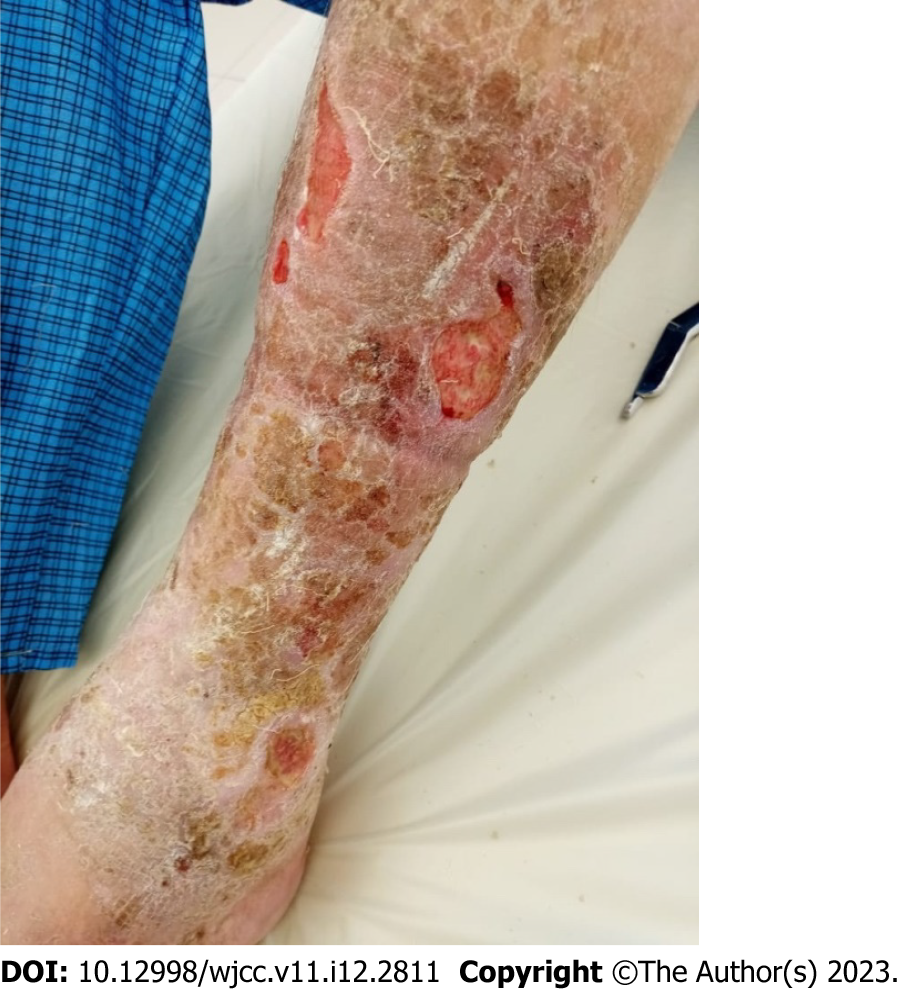
Figure 1
A photograph depicting trophic ulcers of the left lower leg.
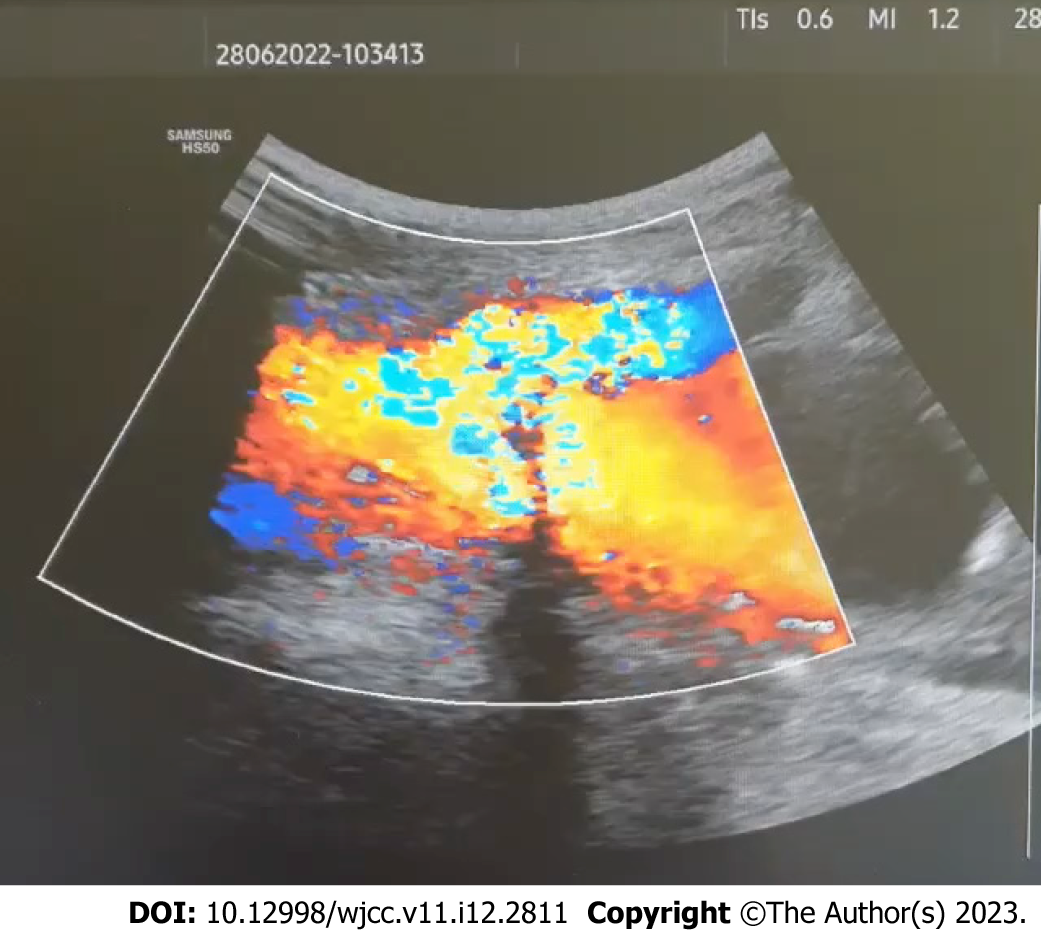
Figure 2
A sonogram of the left groin showing a communication and turbulent blood flow between the left common femoral artery (on top) and the left common femoral vein (on bottom).
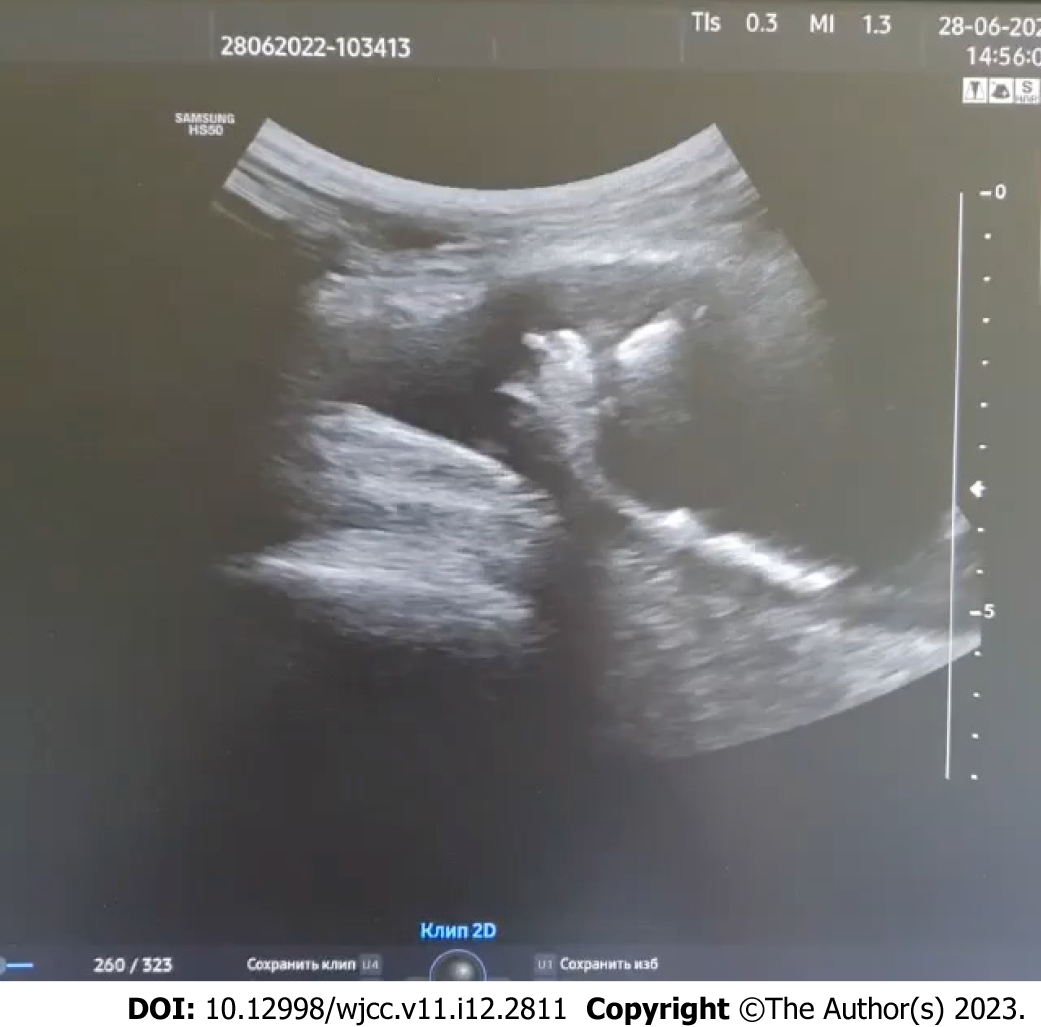
Figure 3
A sonogram of the left groin showing the aneurysm of the left common femoral vein with calcification of posterior and medial walls.
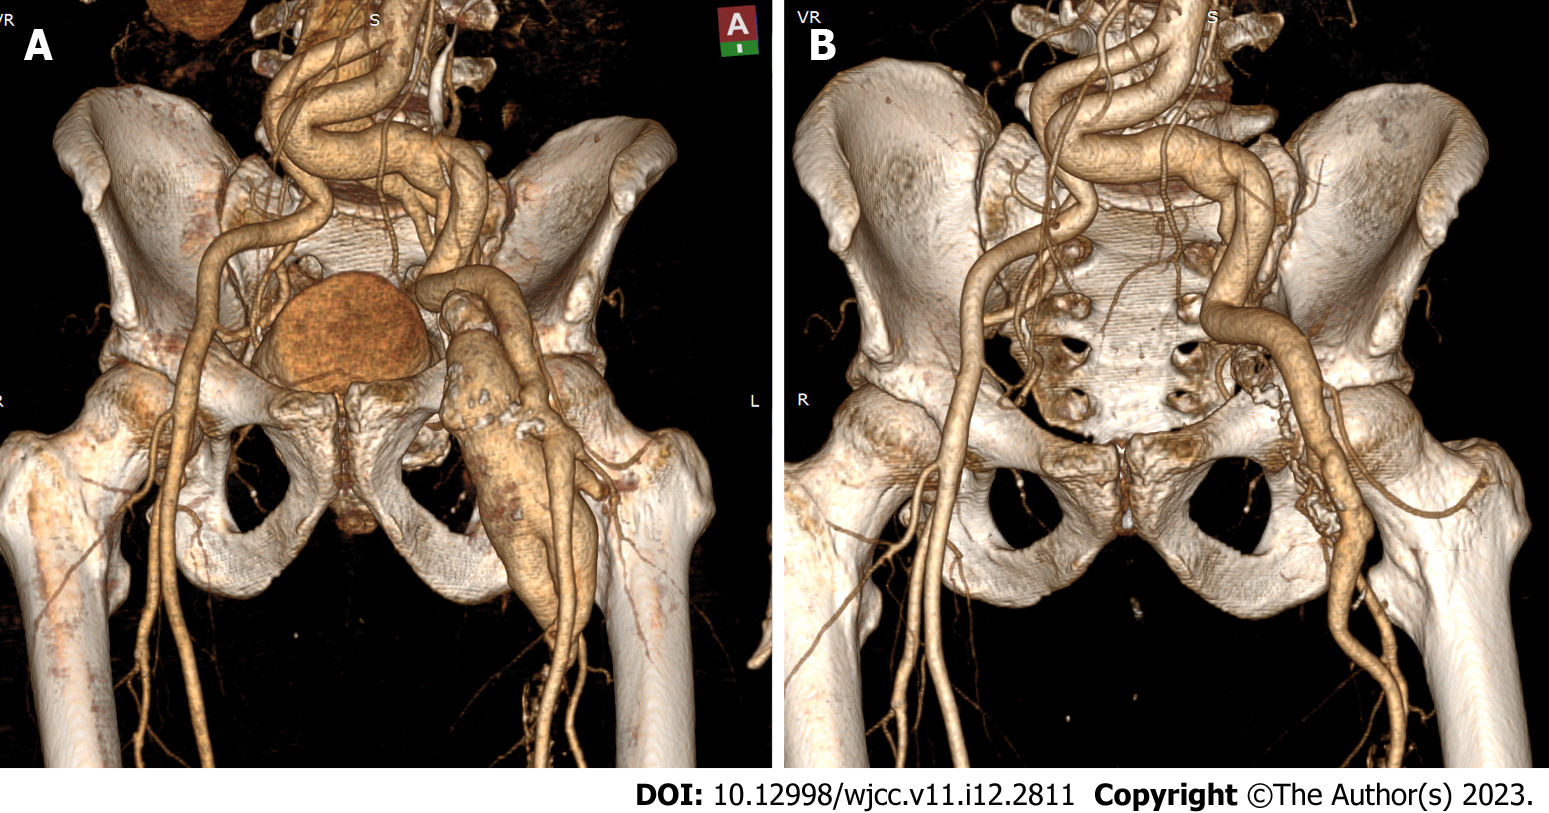
Figure 4 Computed tomography scan.
A: Computed tomography (CT) -scan with contrast enhancement at admission (before treatment) demonstrating arteriovenous fistula between the left common femoral artery and left common femoral vein with an aneurysm of the latter, aneurysms of the proximal parts of the left deep femoral vein, femoral vein with further venous occlusion; CT-scans also shows dilated left iliac arteries; B: CT-scan with contrast enhancement before discharge (after treatment) demonstrating the absence of arteriovenous fistula between the left common femoral artery and left common femoral vein with preserved flow through both femoral and deep femoral arteries.
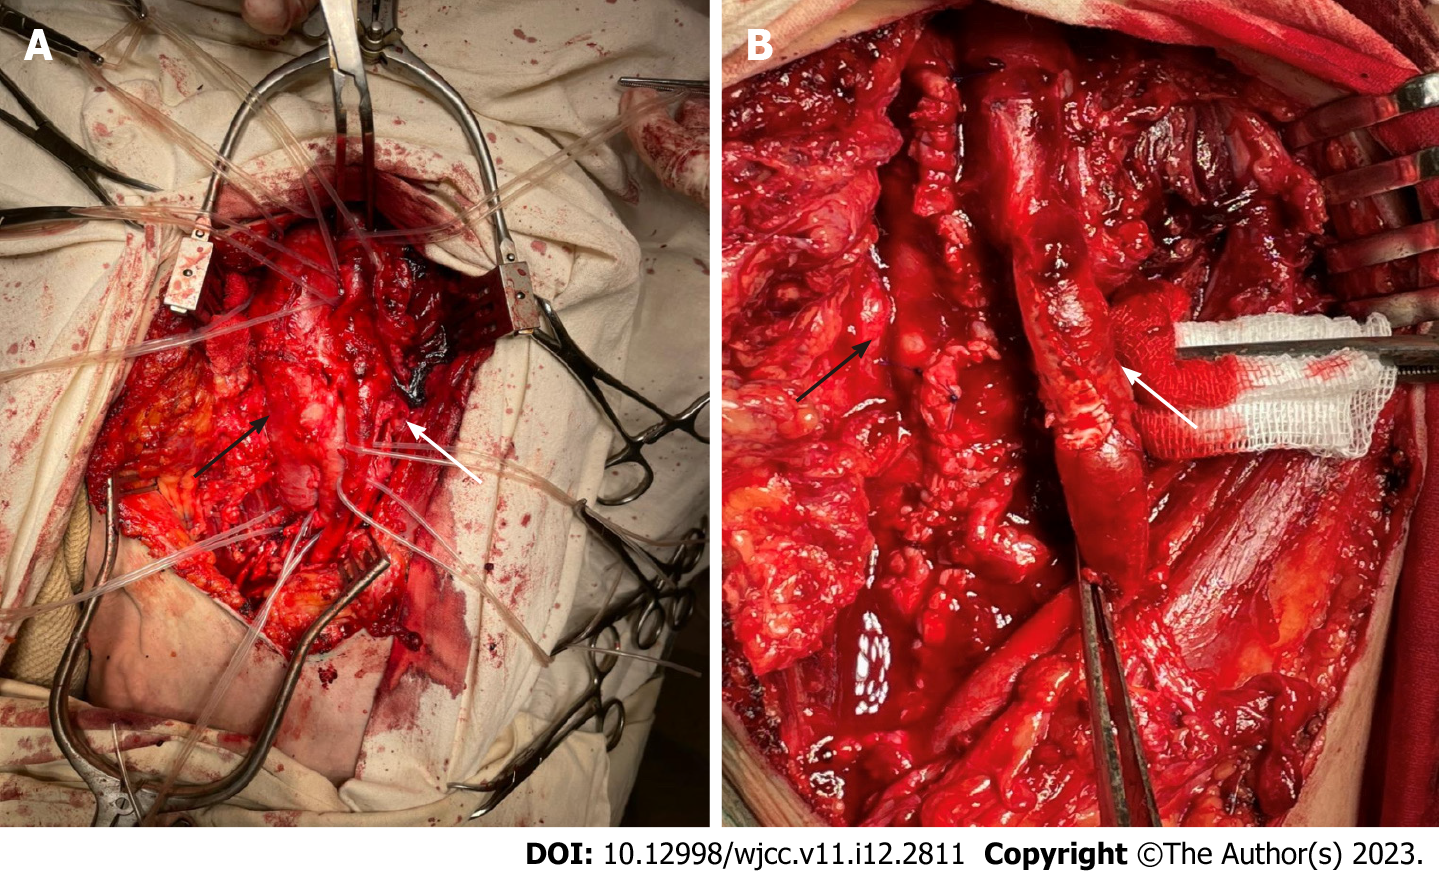
Figure 5 We performed an open procedure.
A: A photograph depicting the arteriovenous fistula between the left common femoral artery and left common femoral vein (white arrow), and the aneurysm of the left common femoral vein (black arrow); B: A photograph depicting a patch closure to the medial aspect of the common femoral artery (white arrow) and the common femoral vein following aneurysmorrhaphy (black arrow).
- Citation: Kalinin R, Suchkov I, Mzhavanadze N, Borisova Y, Panin I. Open surgery: Still a great option to treat patients with post-traumatic arteriovenous fistulas: A case report. World J Clin Cases 2023; 11(12): 2811-2816
- URL: https://www.wjgnet.com/2307-8960/full/v11/i12/2811.htm
- DOI: https://dx.doi.org/10.12998/wjcc.v11.i12.2811


