Copyright
©The Author(s) 2023.
World J Clin Cases. Apr 26, 2023; 11(12): 2766-2779
Published online Apr 26, 2023. doi: 10.12998/wjcc.v11.i12.2766
Published online Apr 26, 2023. doi: 10.12998/wjcc.v11.i12.2766
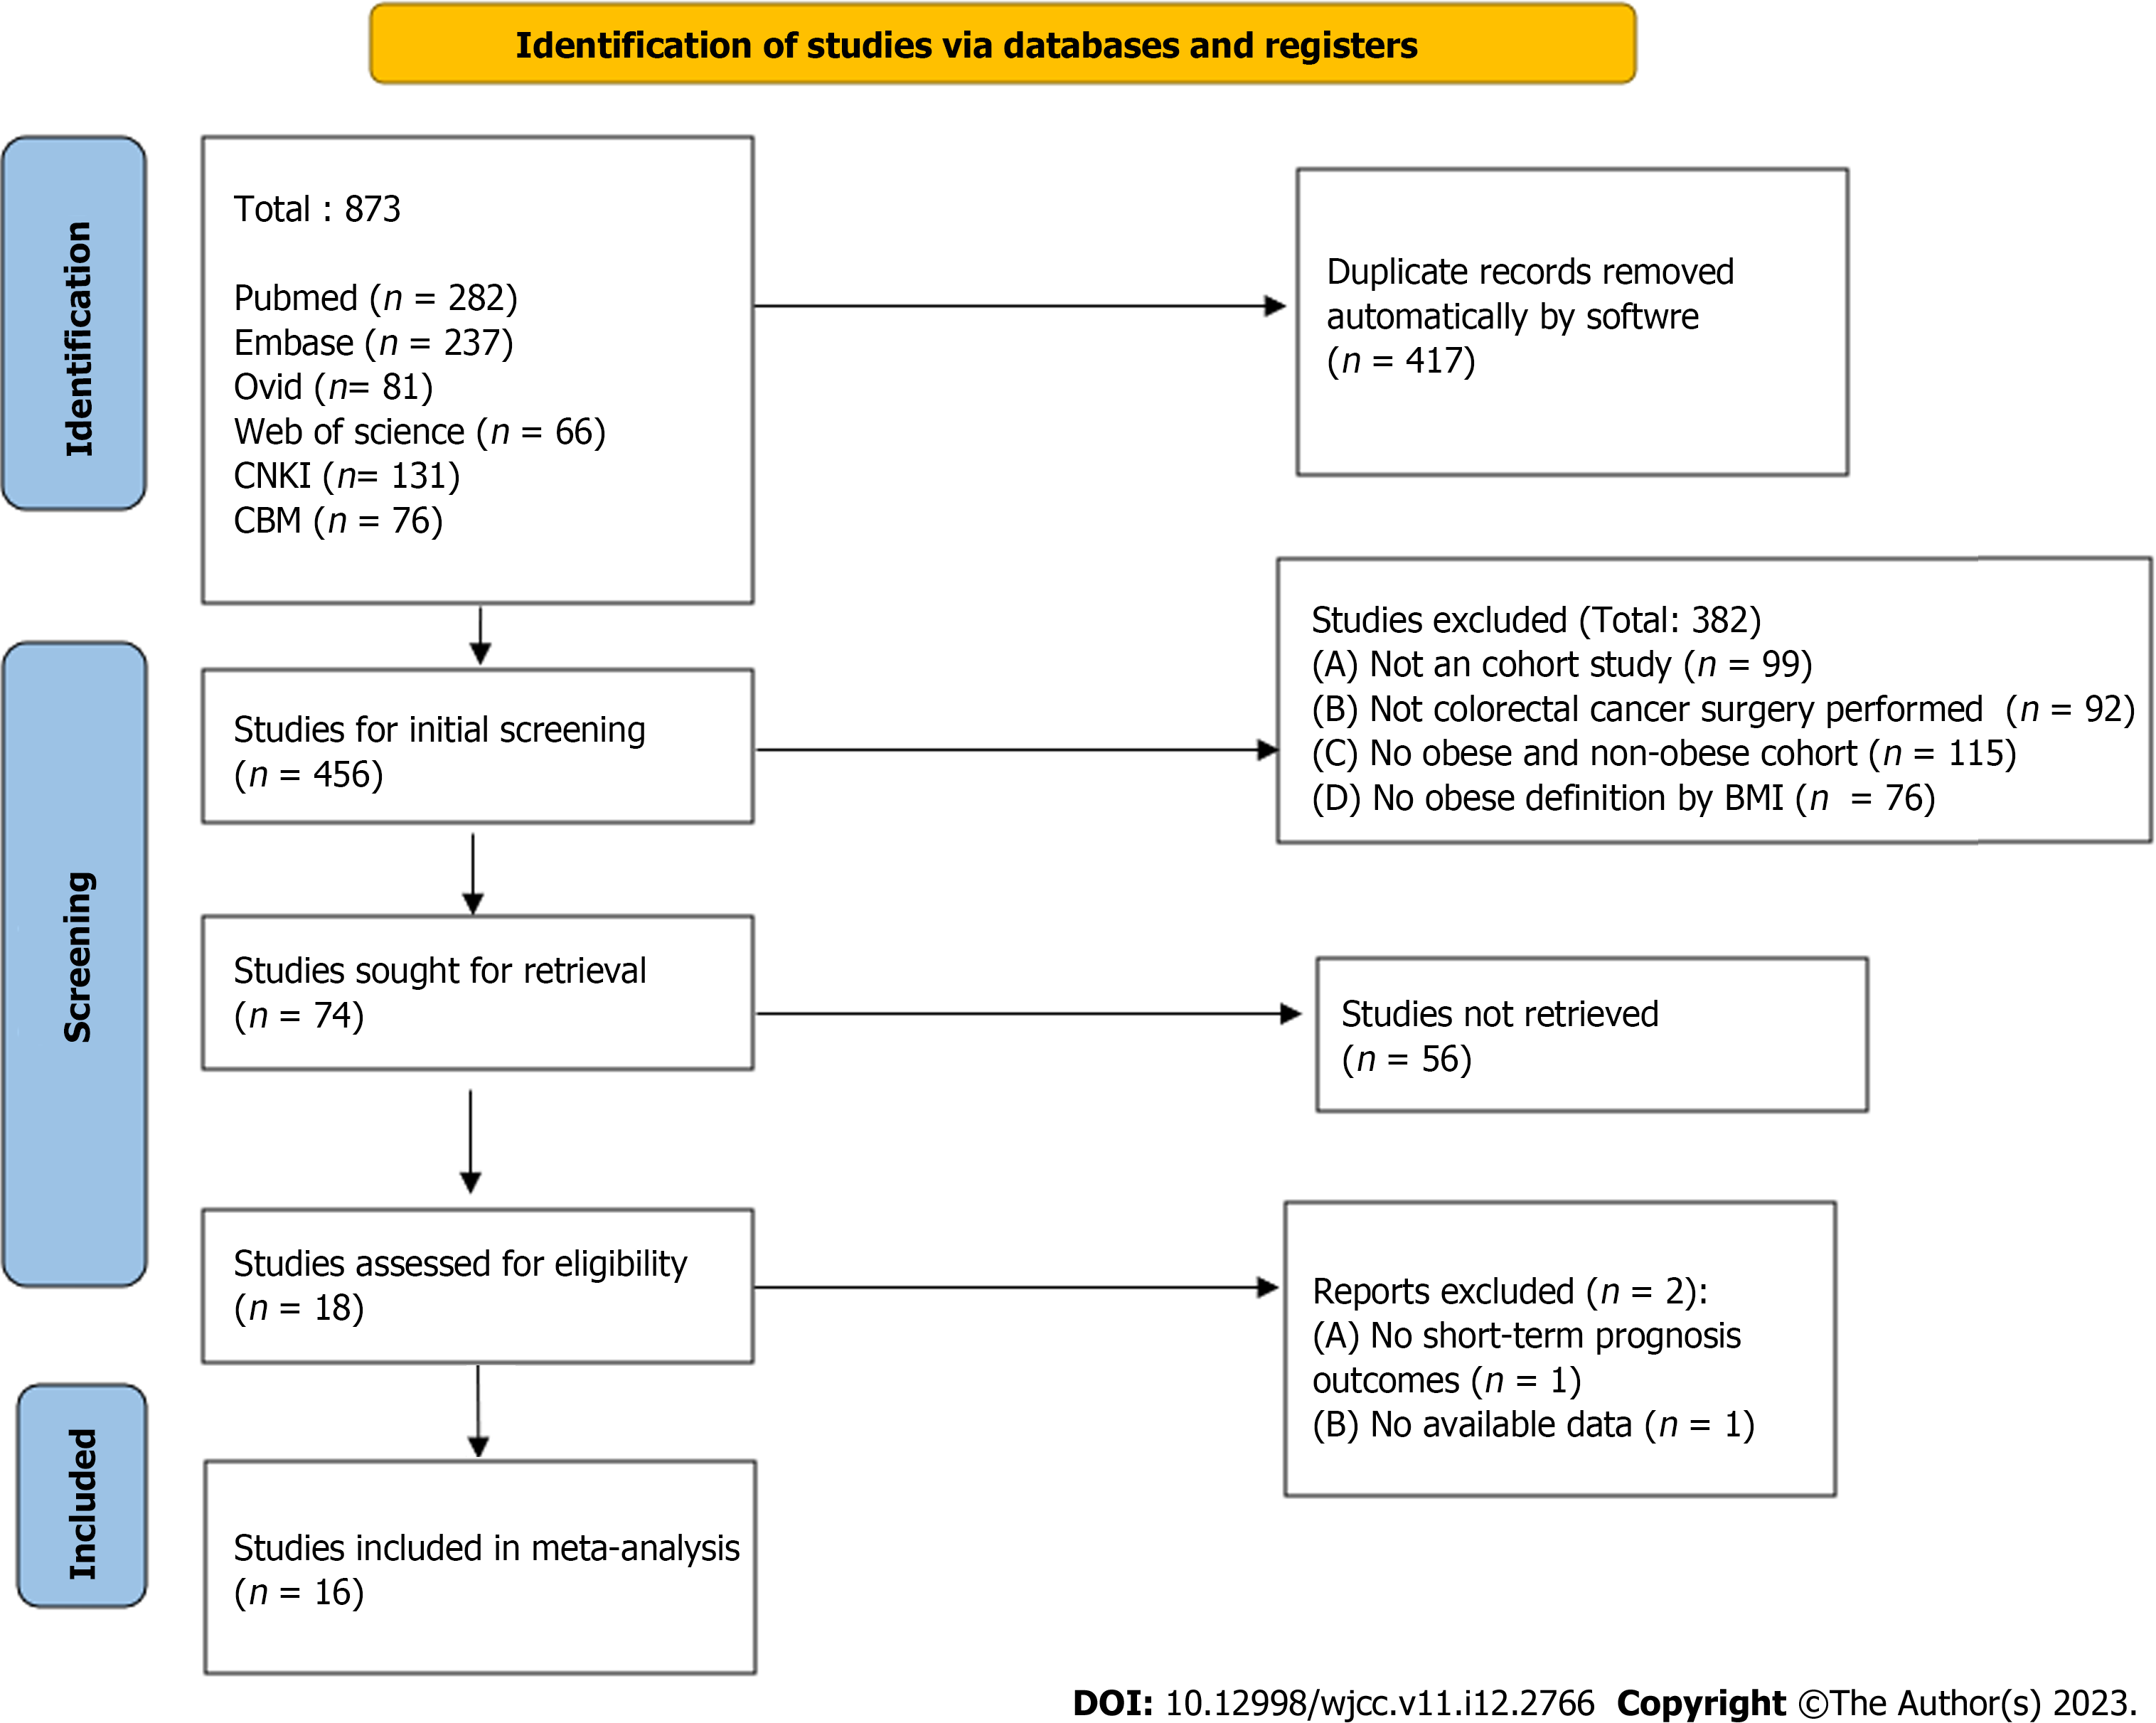
Figure 1
Literature selection flow chart.
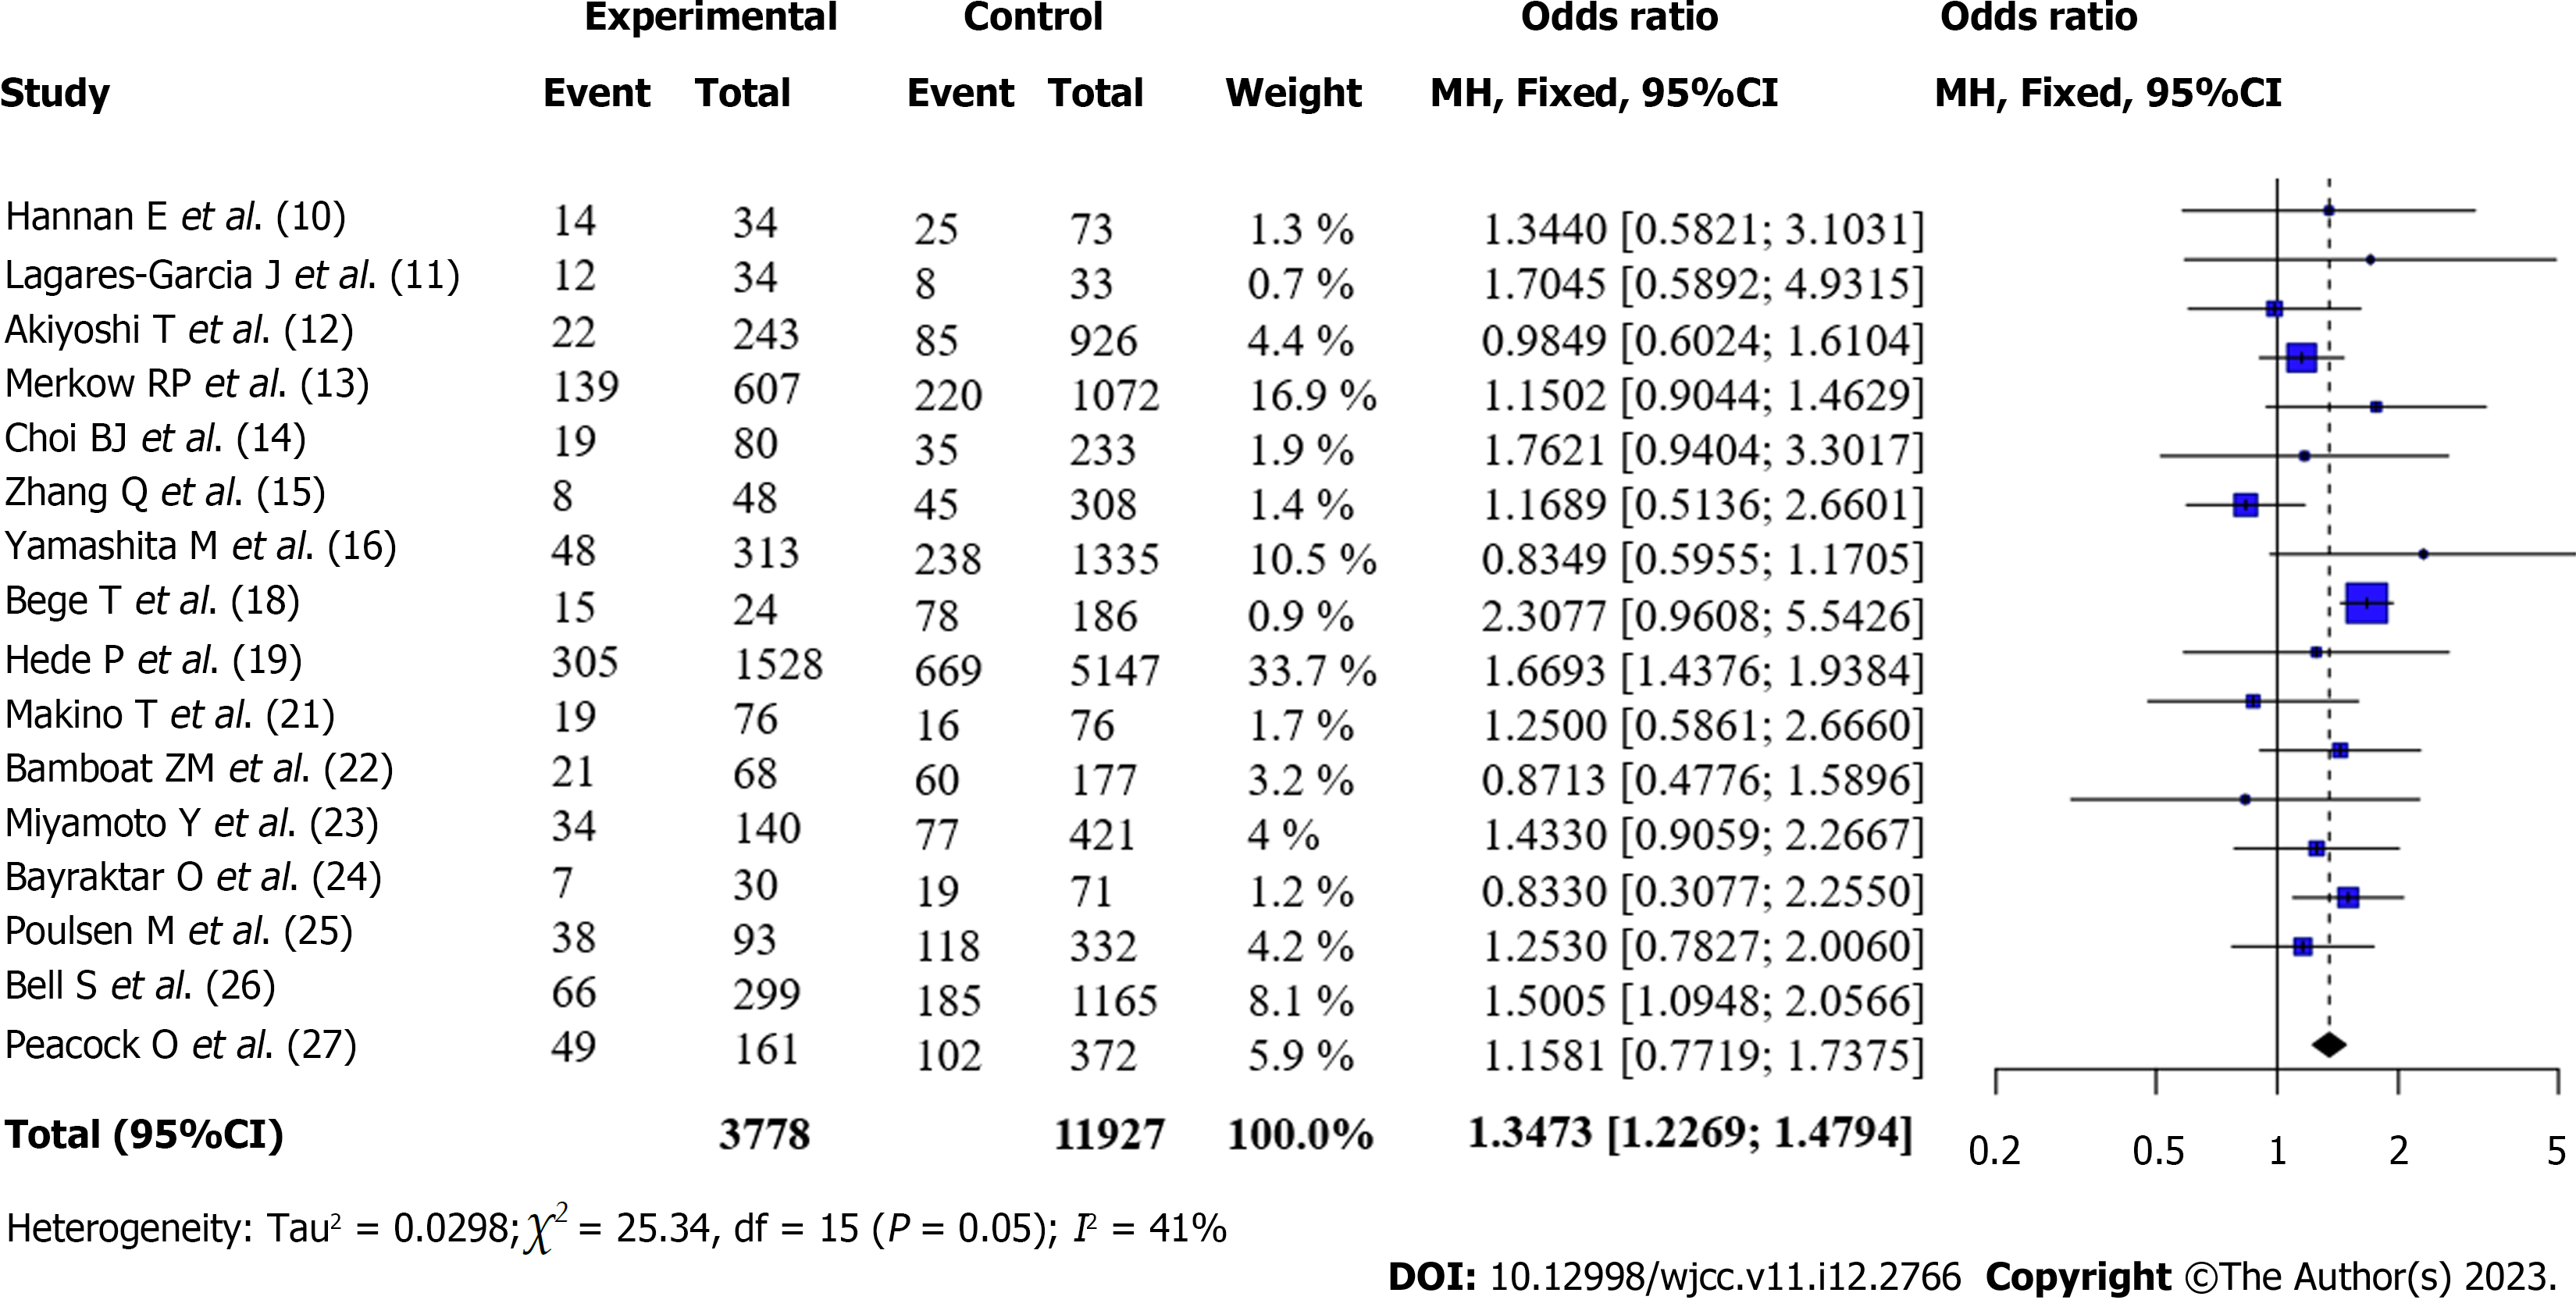
Figure 2
Comparison of total complication rates after surgery in patients with colorectal rectal cancer (Obese VS Non-obese).
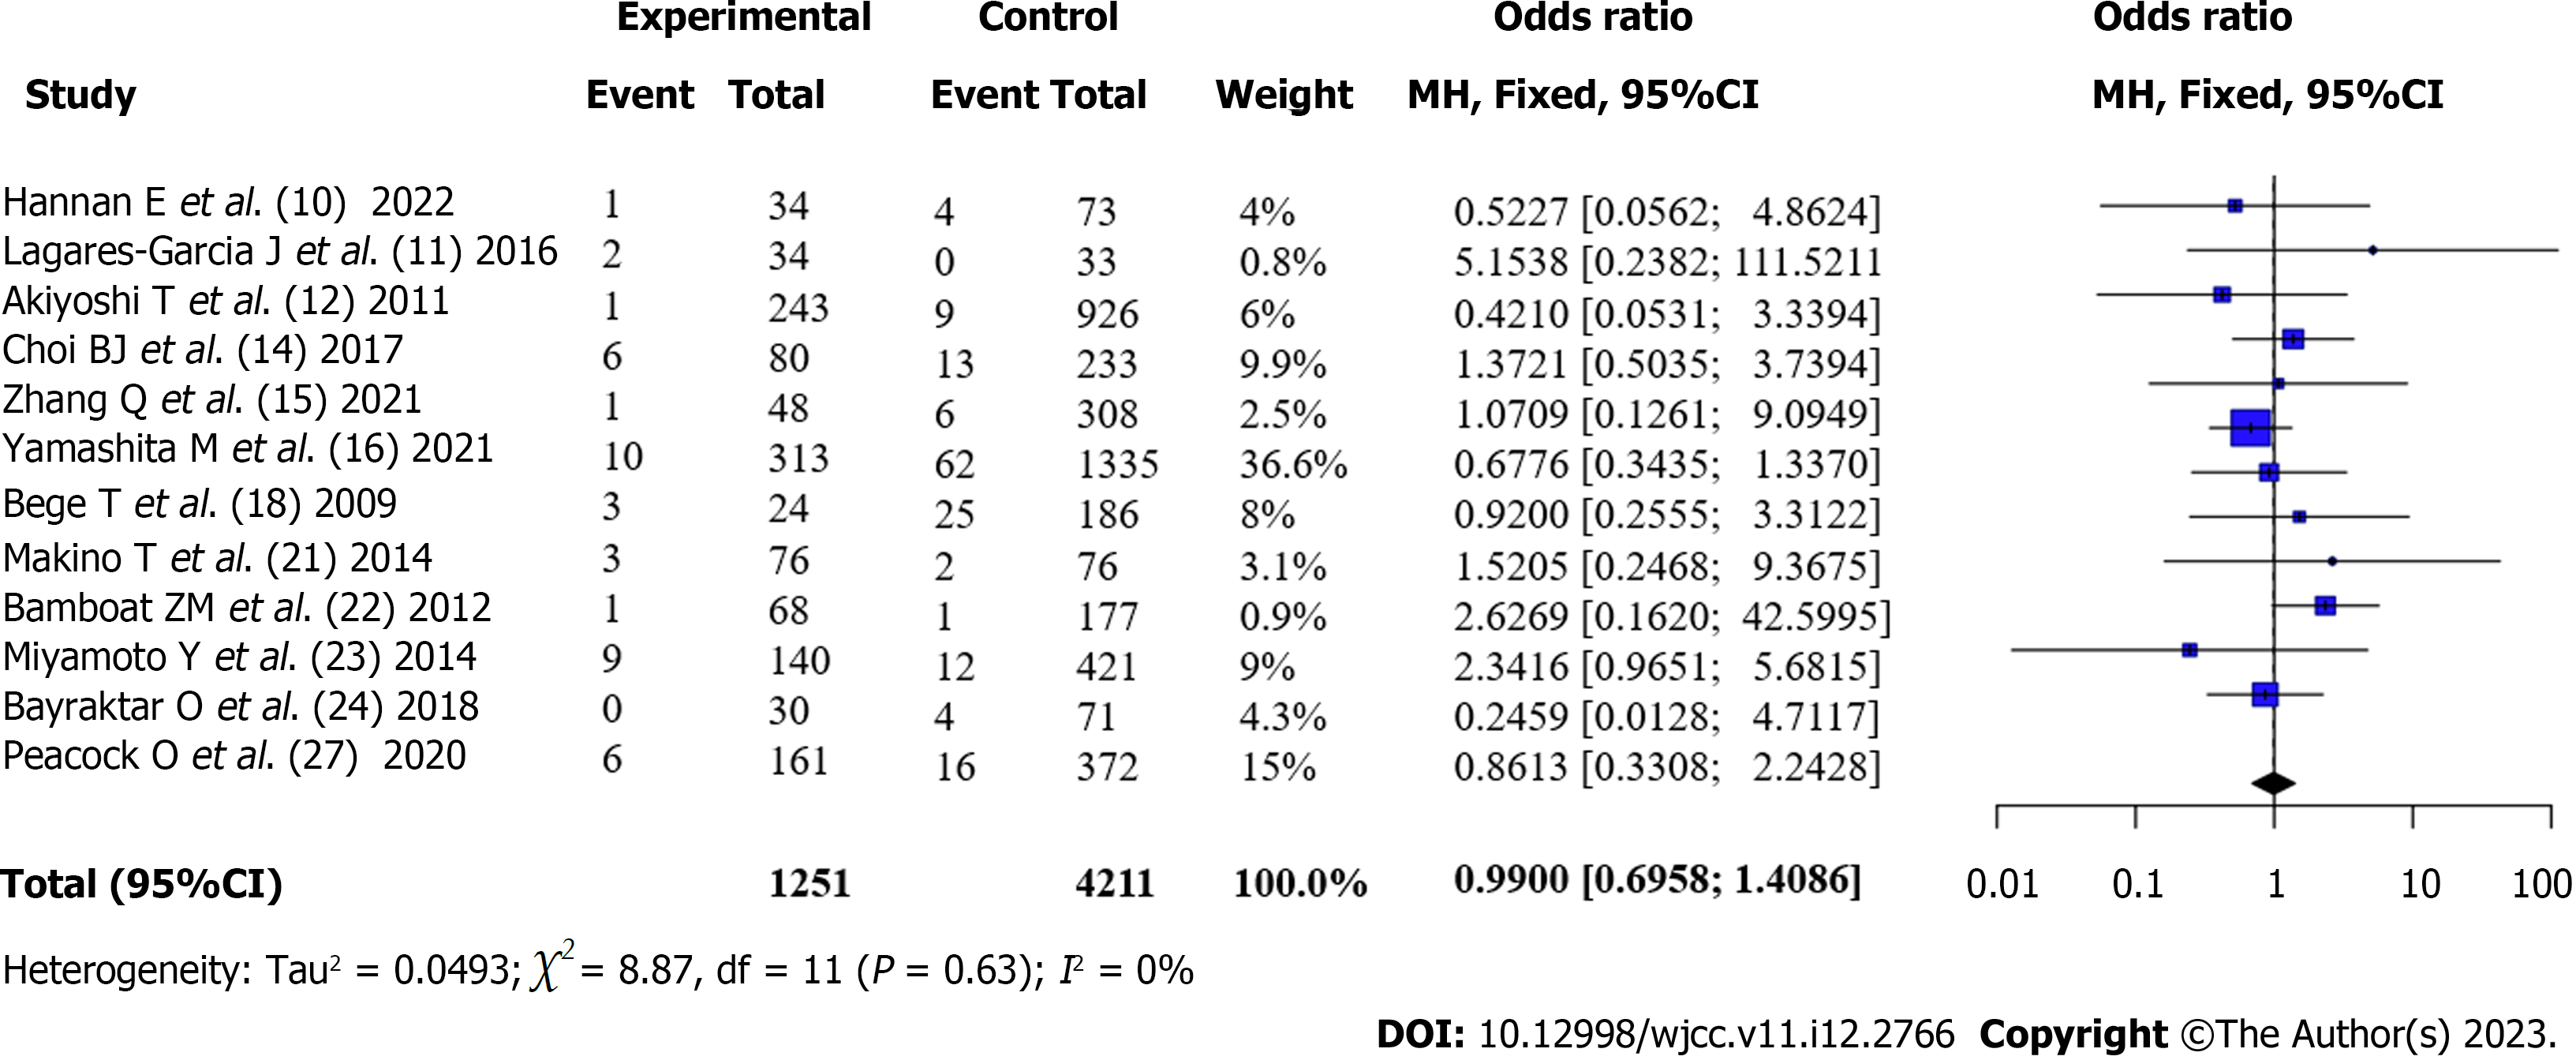
Figure 3
Comparison of the incidence of anastomotic leak after surgery in patients with colorectal rectal cancer (Obese VS Non-obese).
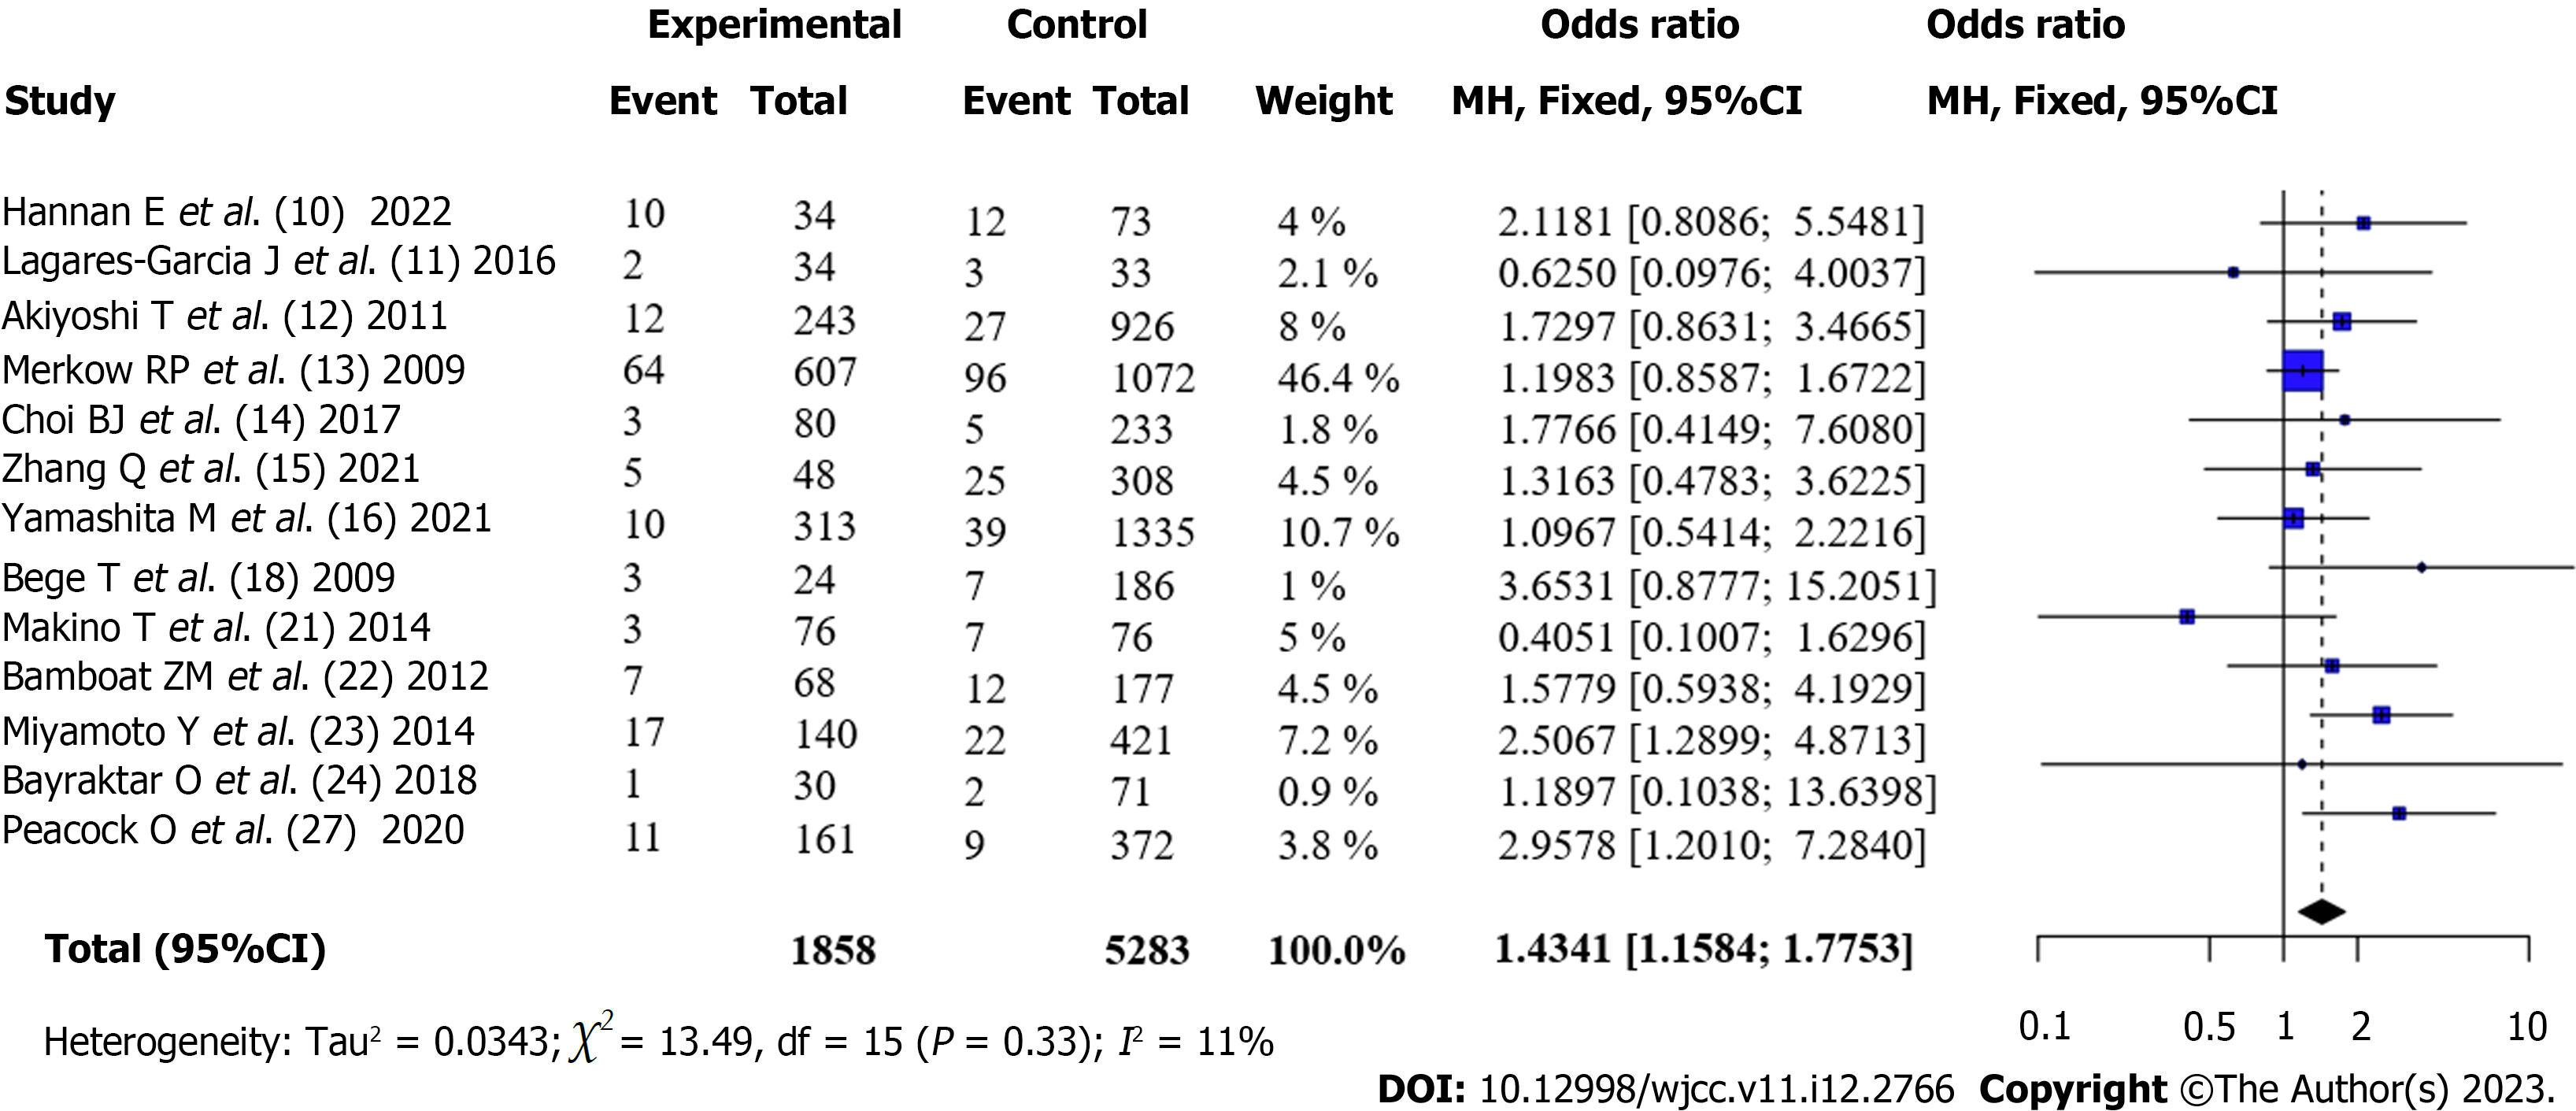
Figure 4
Comparison of surgical site infection incidence in patients with colorectal rectal cancer after surgery (Obese VS Non-obese).
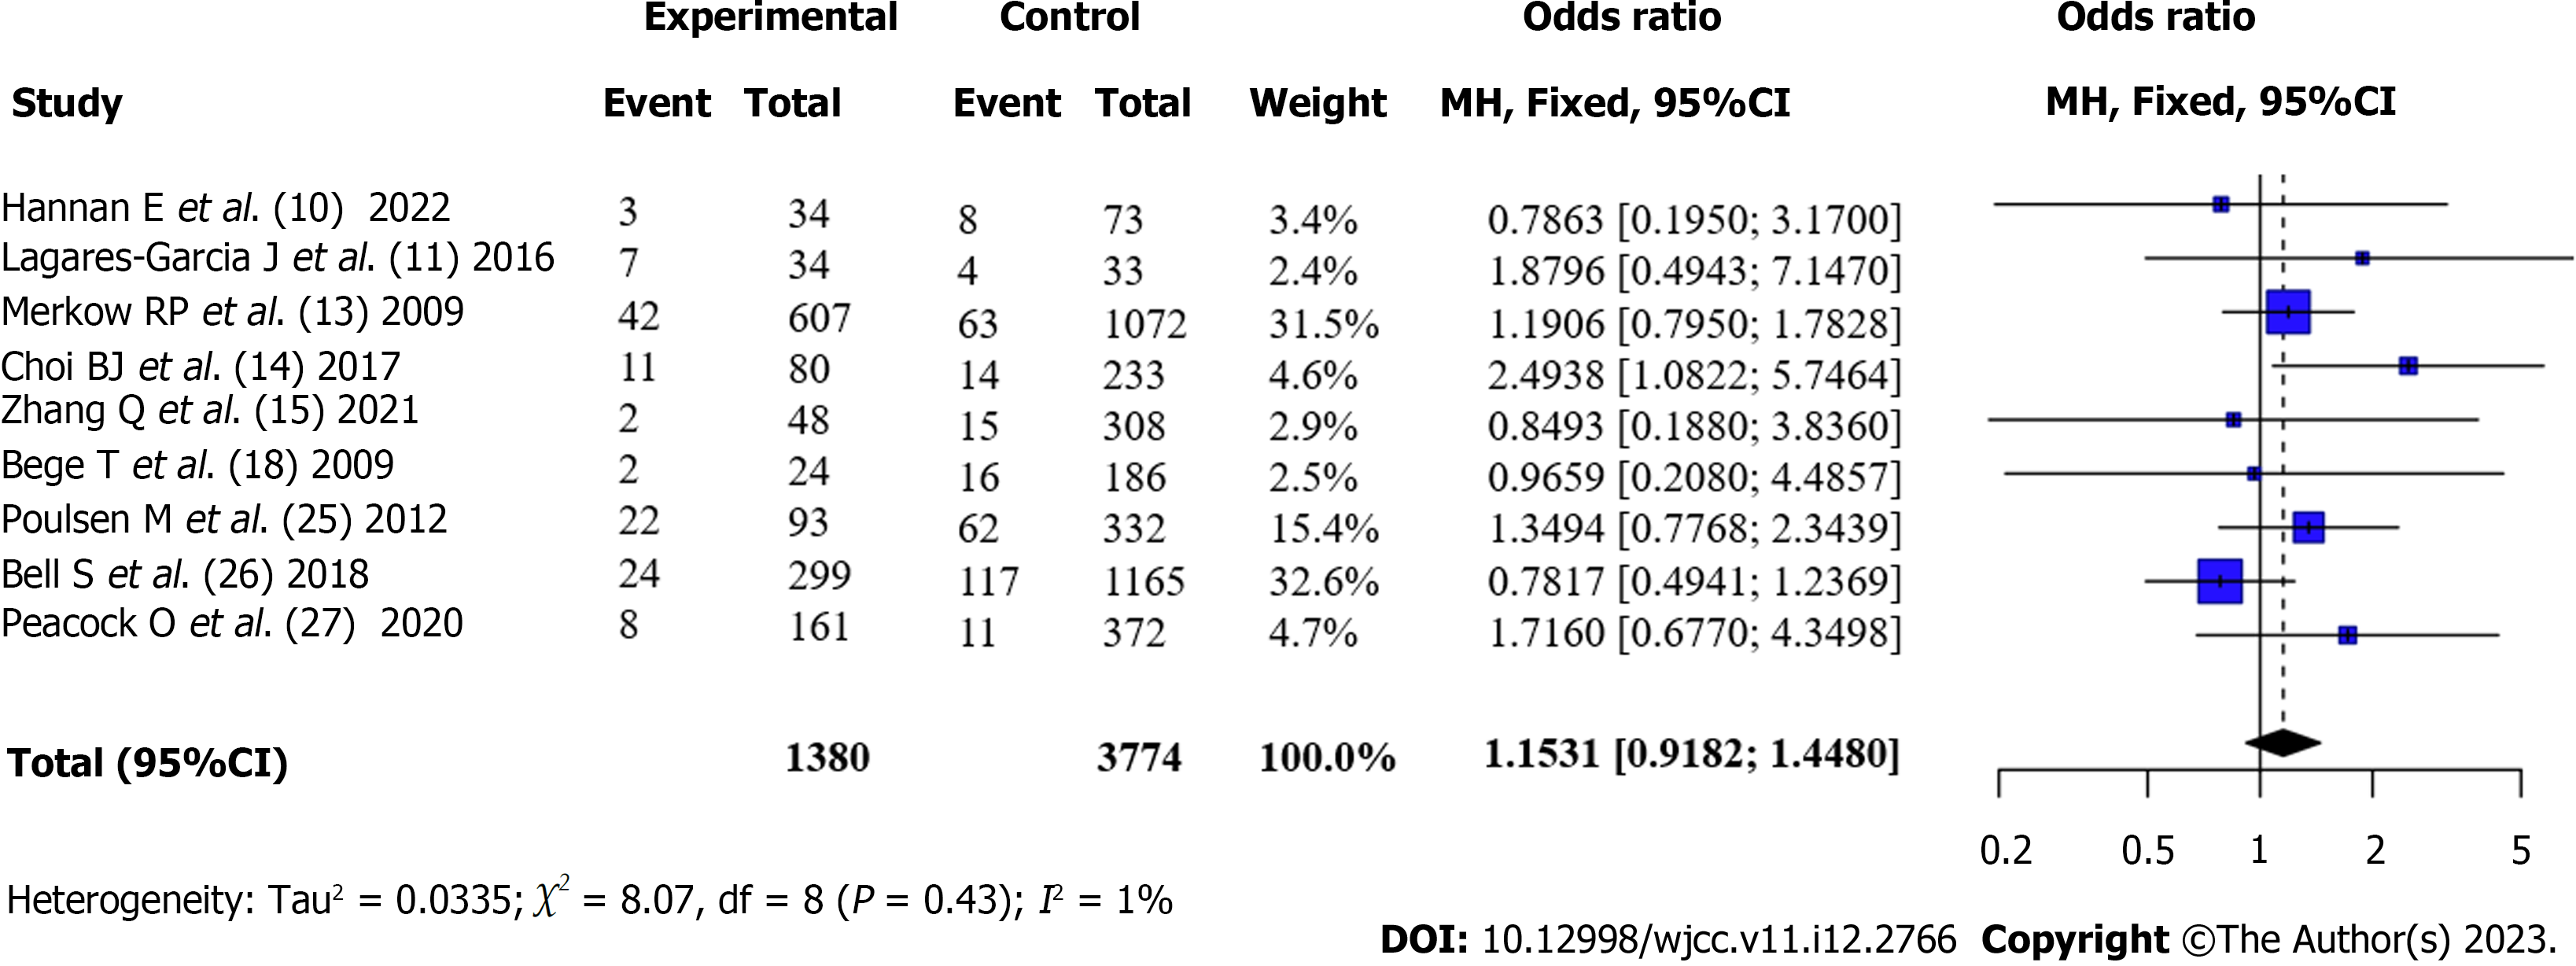
Figure 5
Comparison of the incidence of reoperation after operation in patients with colorectal rectal cancer (Obese VS Non-obese).
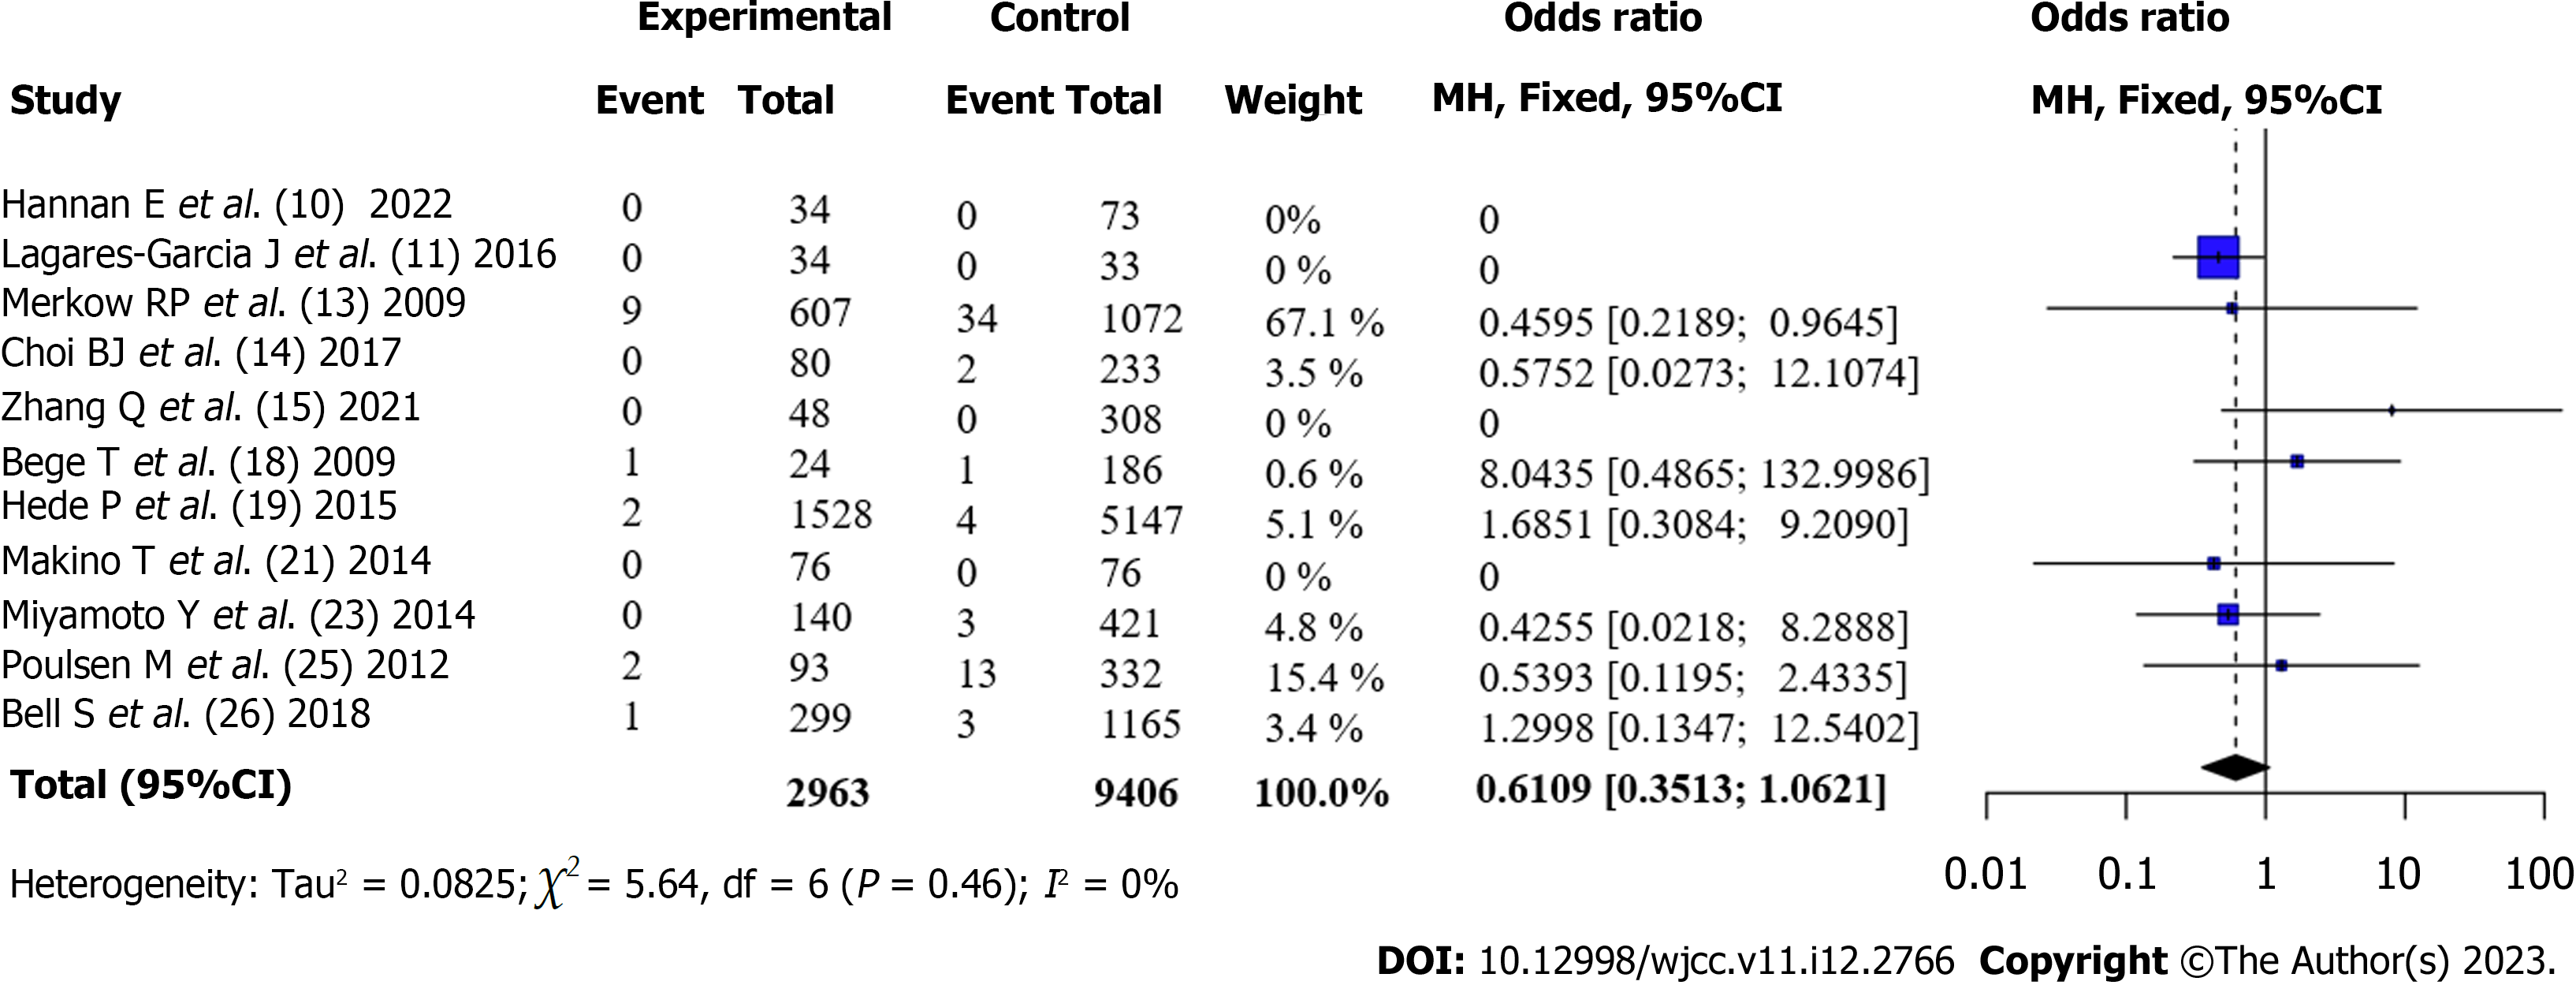
Figure 6
Comparison of mortality rates after surgery in patients with colorectal rectal cancer (Obese VS Non-obese).
Figure 7 Meta-regression analysis of indicators of postoperative complication rate: Publication year (P = 0.
69), sample size (P = 0.10), and patient age factors (P = 0.40).
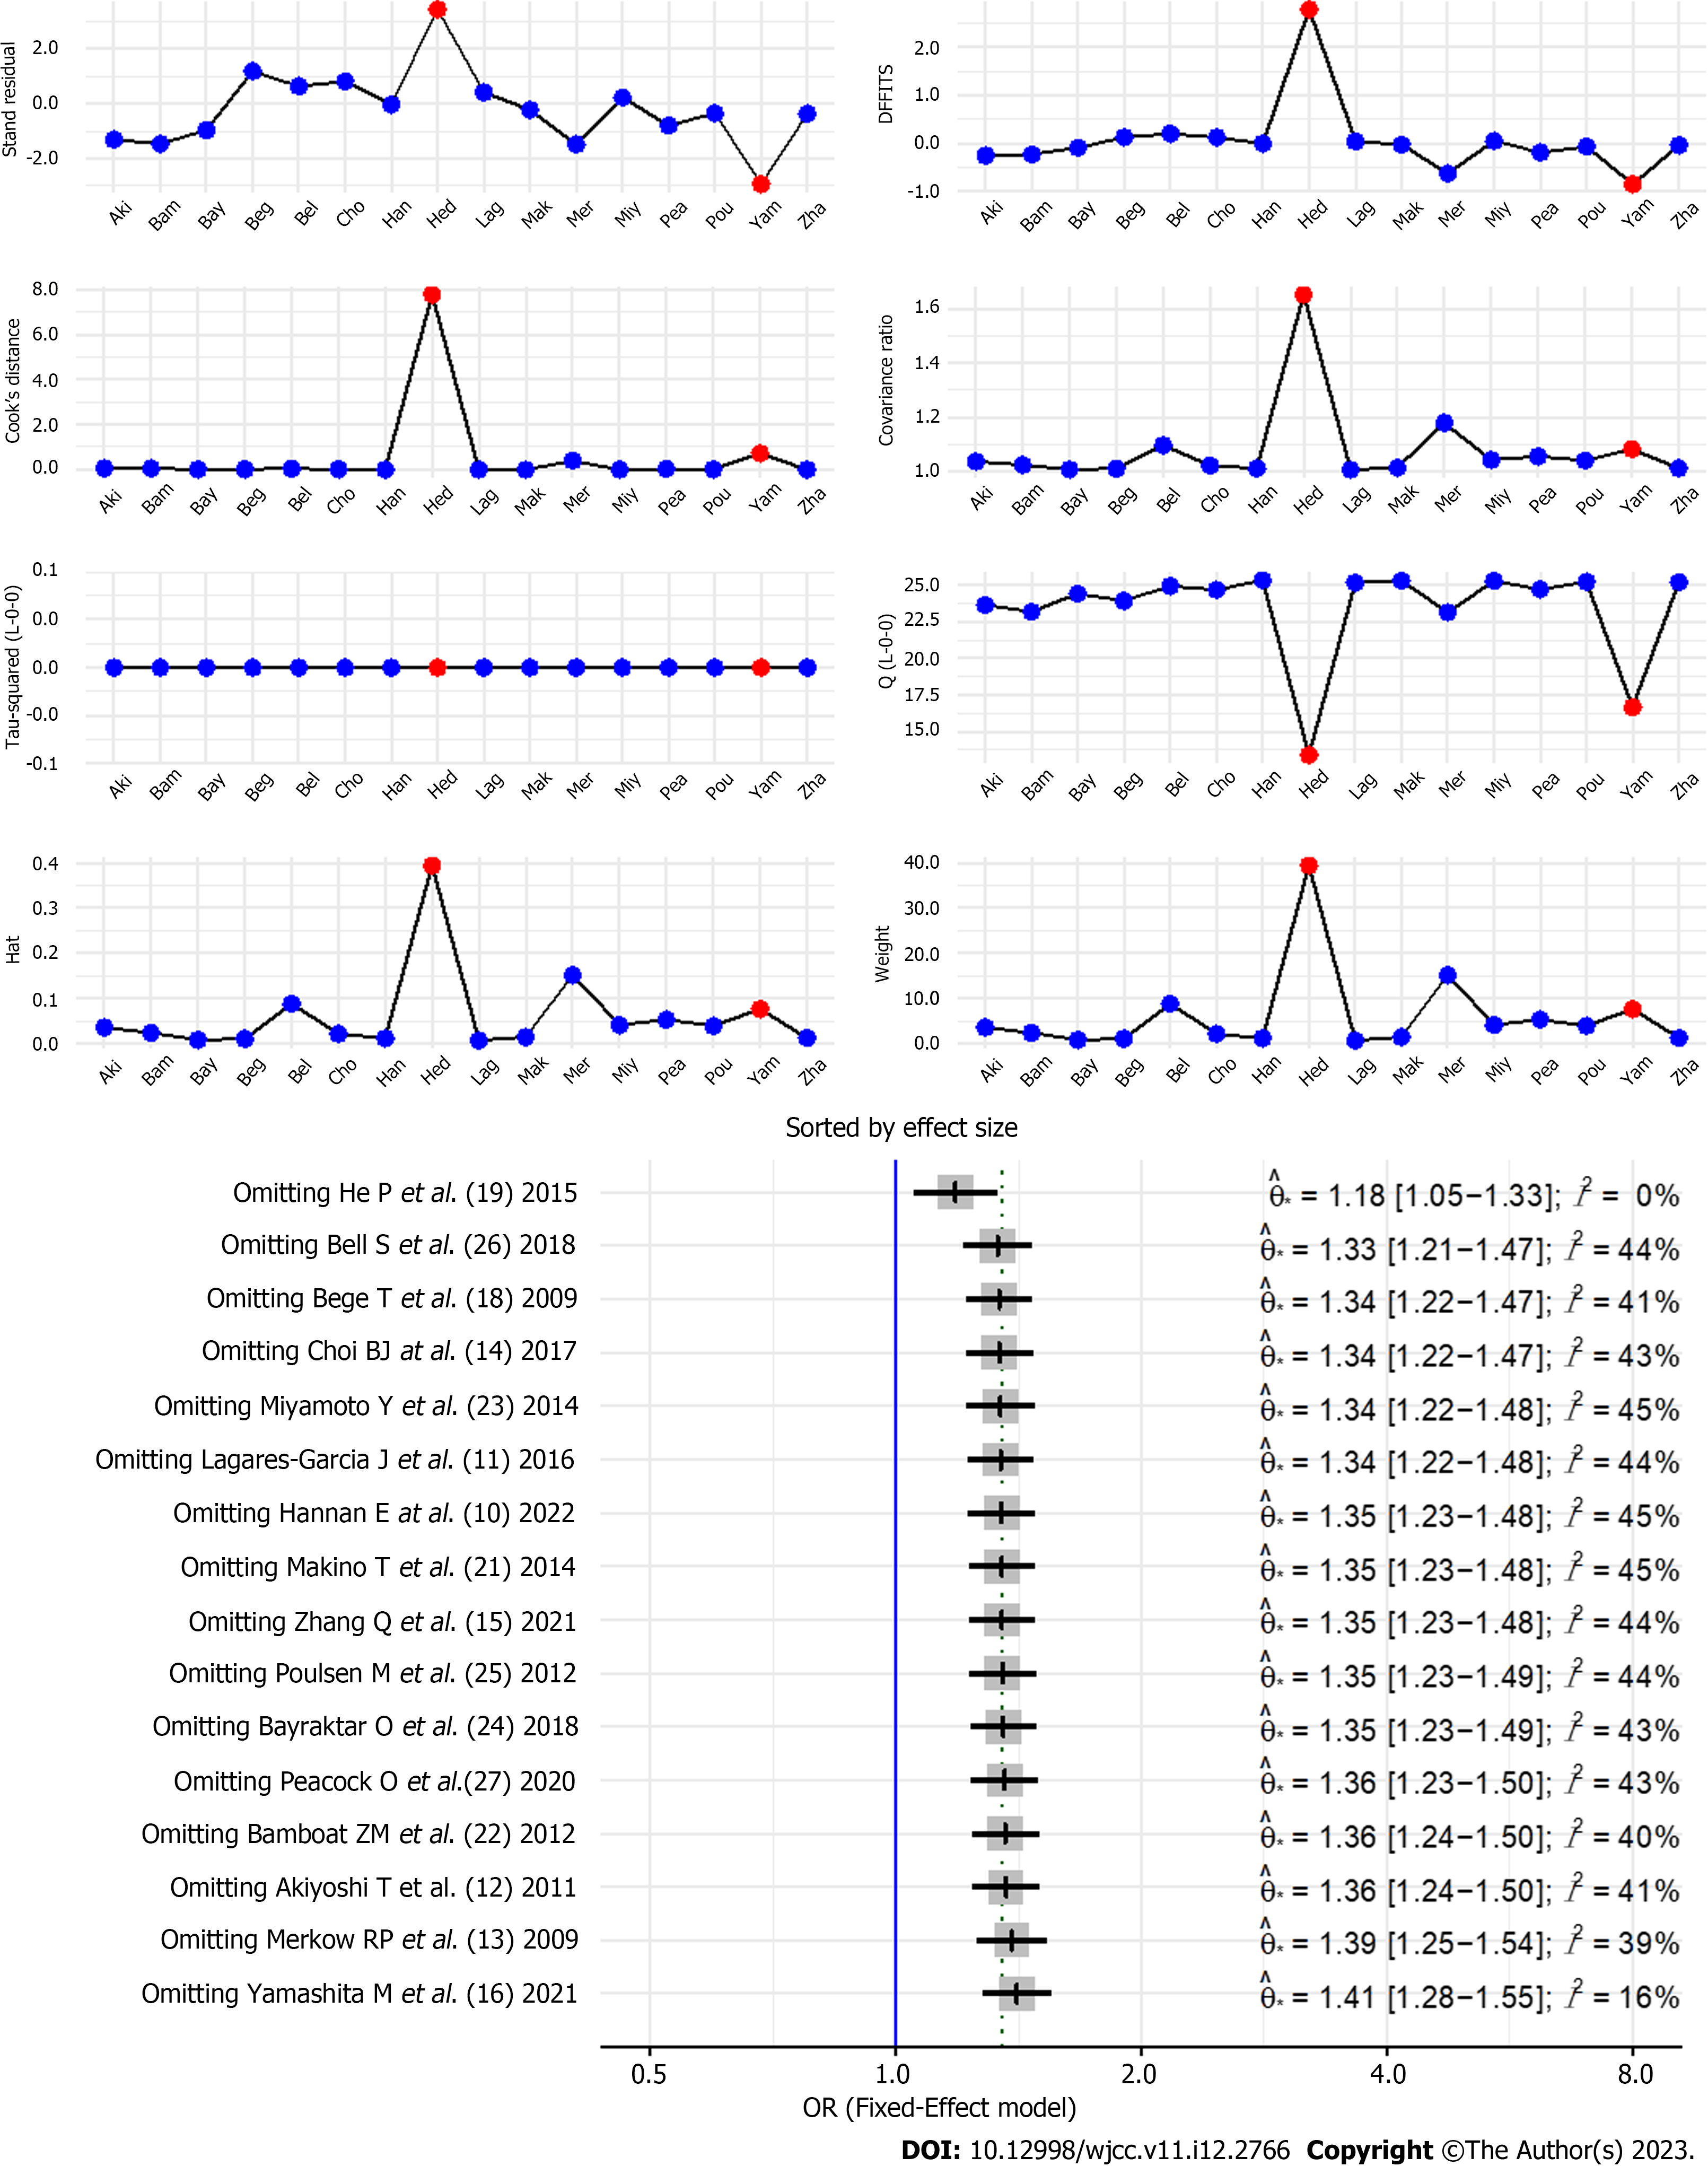
Figure 8
Sensitivity analysis of postoperative complication incidence index.
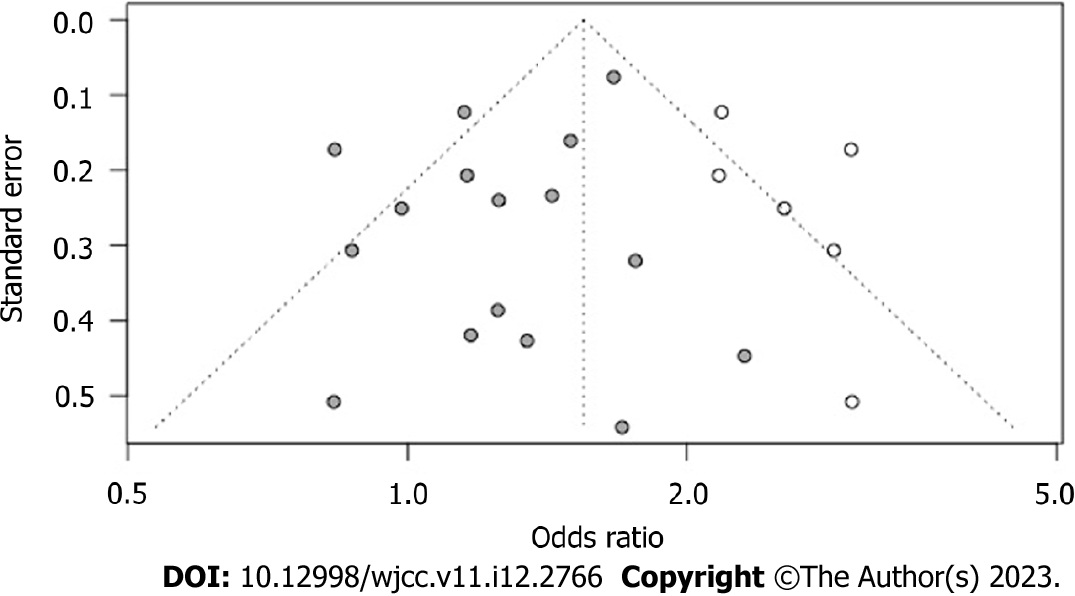
Figure 9
Trim-filled funnel plot of complication incidence after surgery.
- Citation: Li Y, Deng JJ, Jiang J. Relationship between body mass index and short-term postoperative prognosis in patients undergoing colorectal cancer surgery. World J Clin Cases 2023; 11(12): 2766-2779
- URL: https://www.wjgnet.com/2307-8960/full/v11/i12/2766.htm
- DOI: https://dx.doi.org/10.12998/wjcc.v11.i12.2766


